Elasticsearch: Out of Memory due to GlobalOrdinalsWithScoreCollector
Elasticsearch version (bin/elasticsearch --version): 7.4.2
Plugins installed: []
JVM version (java -version):
openjdk 11.0.6 2020-01-14 LTS
OpenJDK Runtime Environment (build 11.0.6+10-LTS)
OpenJDK 64-Bit Server VM (build 11.0.6+10-LTS, mixed mode)
OS version (uname -a if on a Unix-like system):
Linux 4.9.70-25.242.amzn1.x86_64 #1 SMP Wed Jan 3 05:36:22 UTC 2018 x86_64 x86_64 x86_64 GNU/Linux
Description of the problem including expected versus actual behavior:
We are trying to hit a parent join query (exact query can be shared privately)
ES 7.1 works fine, while ES 7.4 ScoreQuery goes OOM. We've ran jvm allocation profiling for 3 minutes, and saw the below allocation profile.
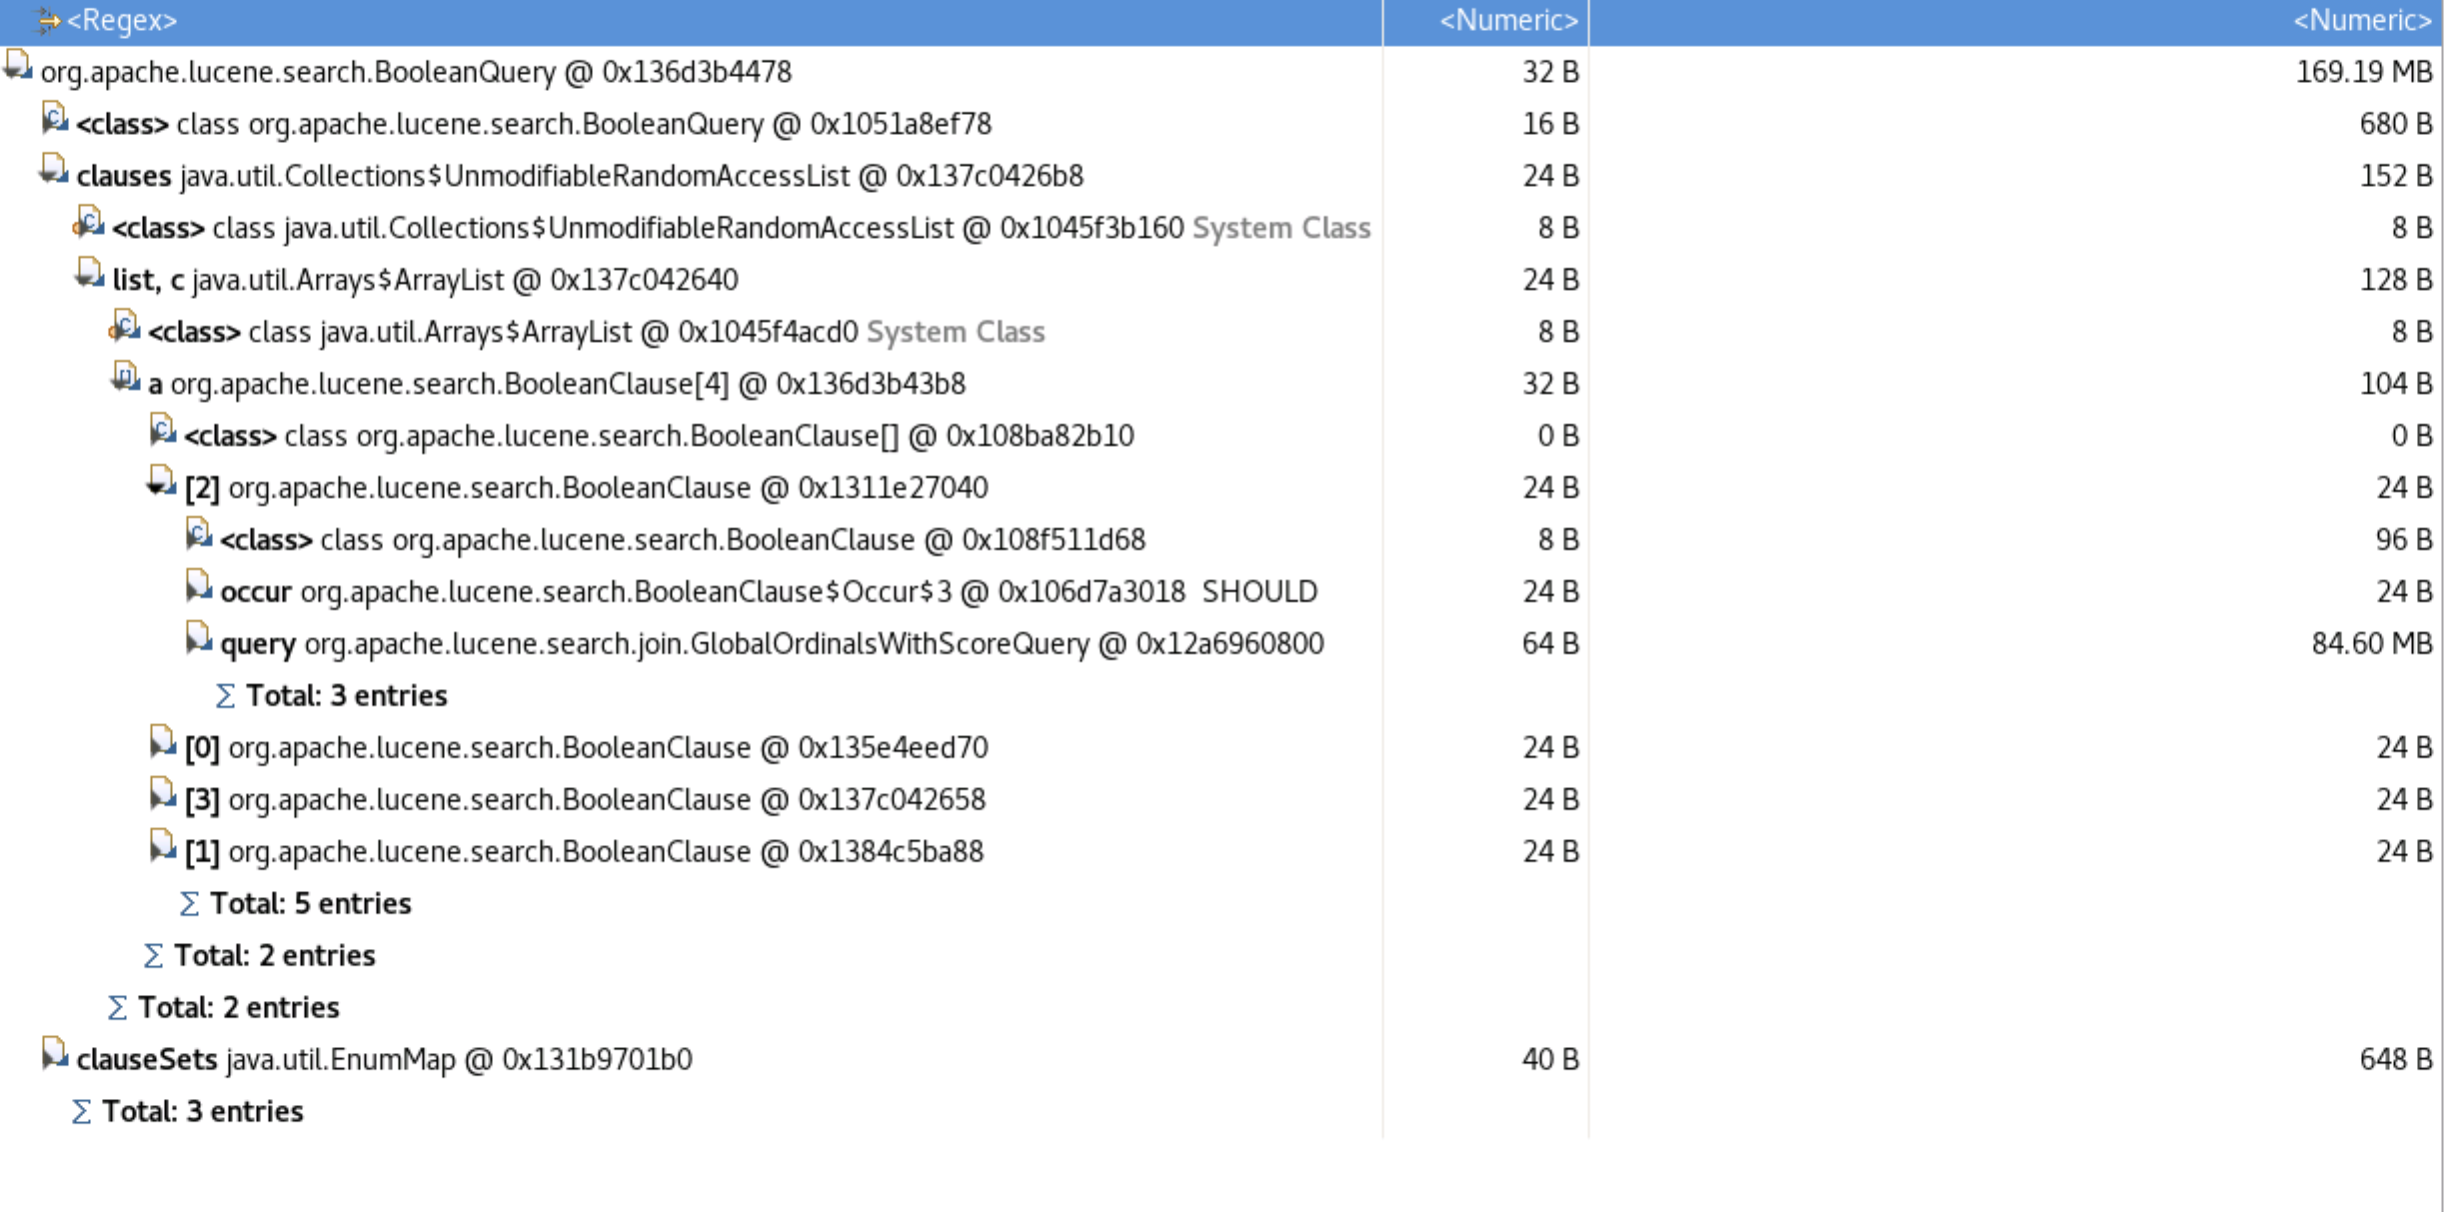
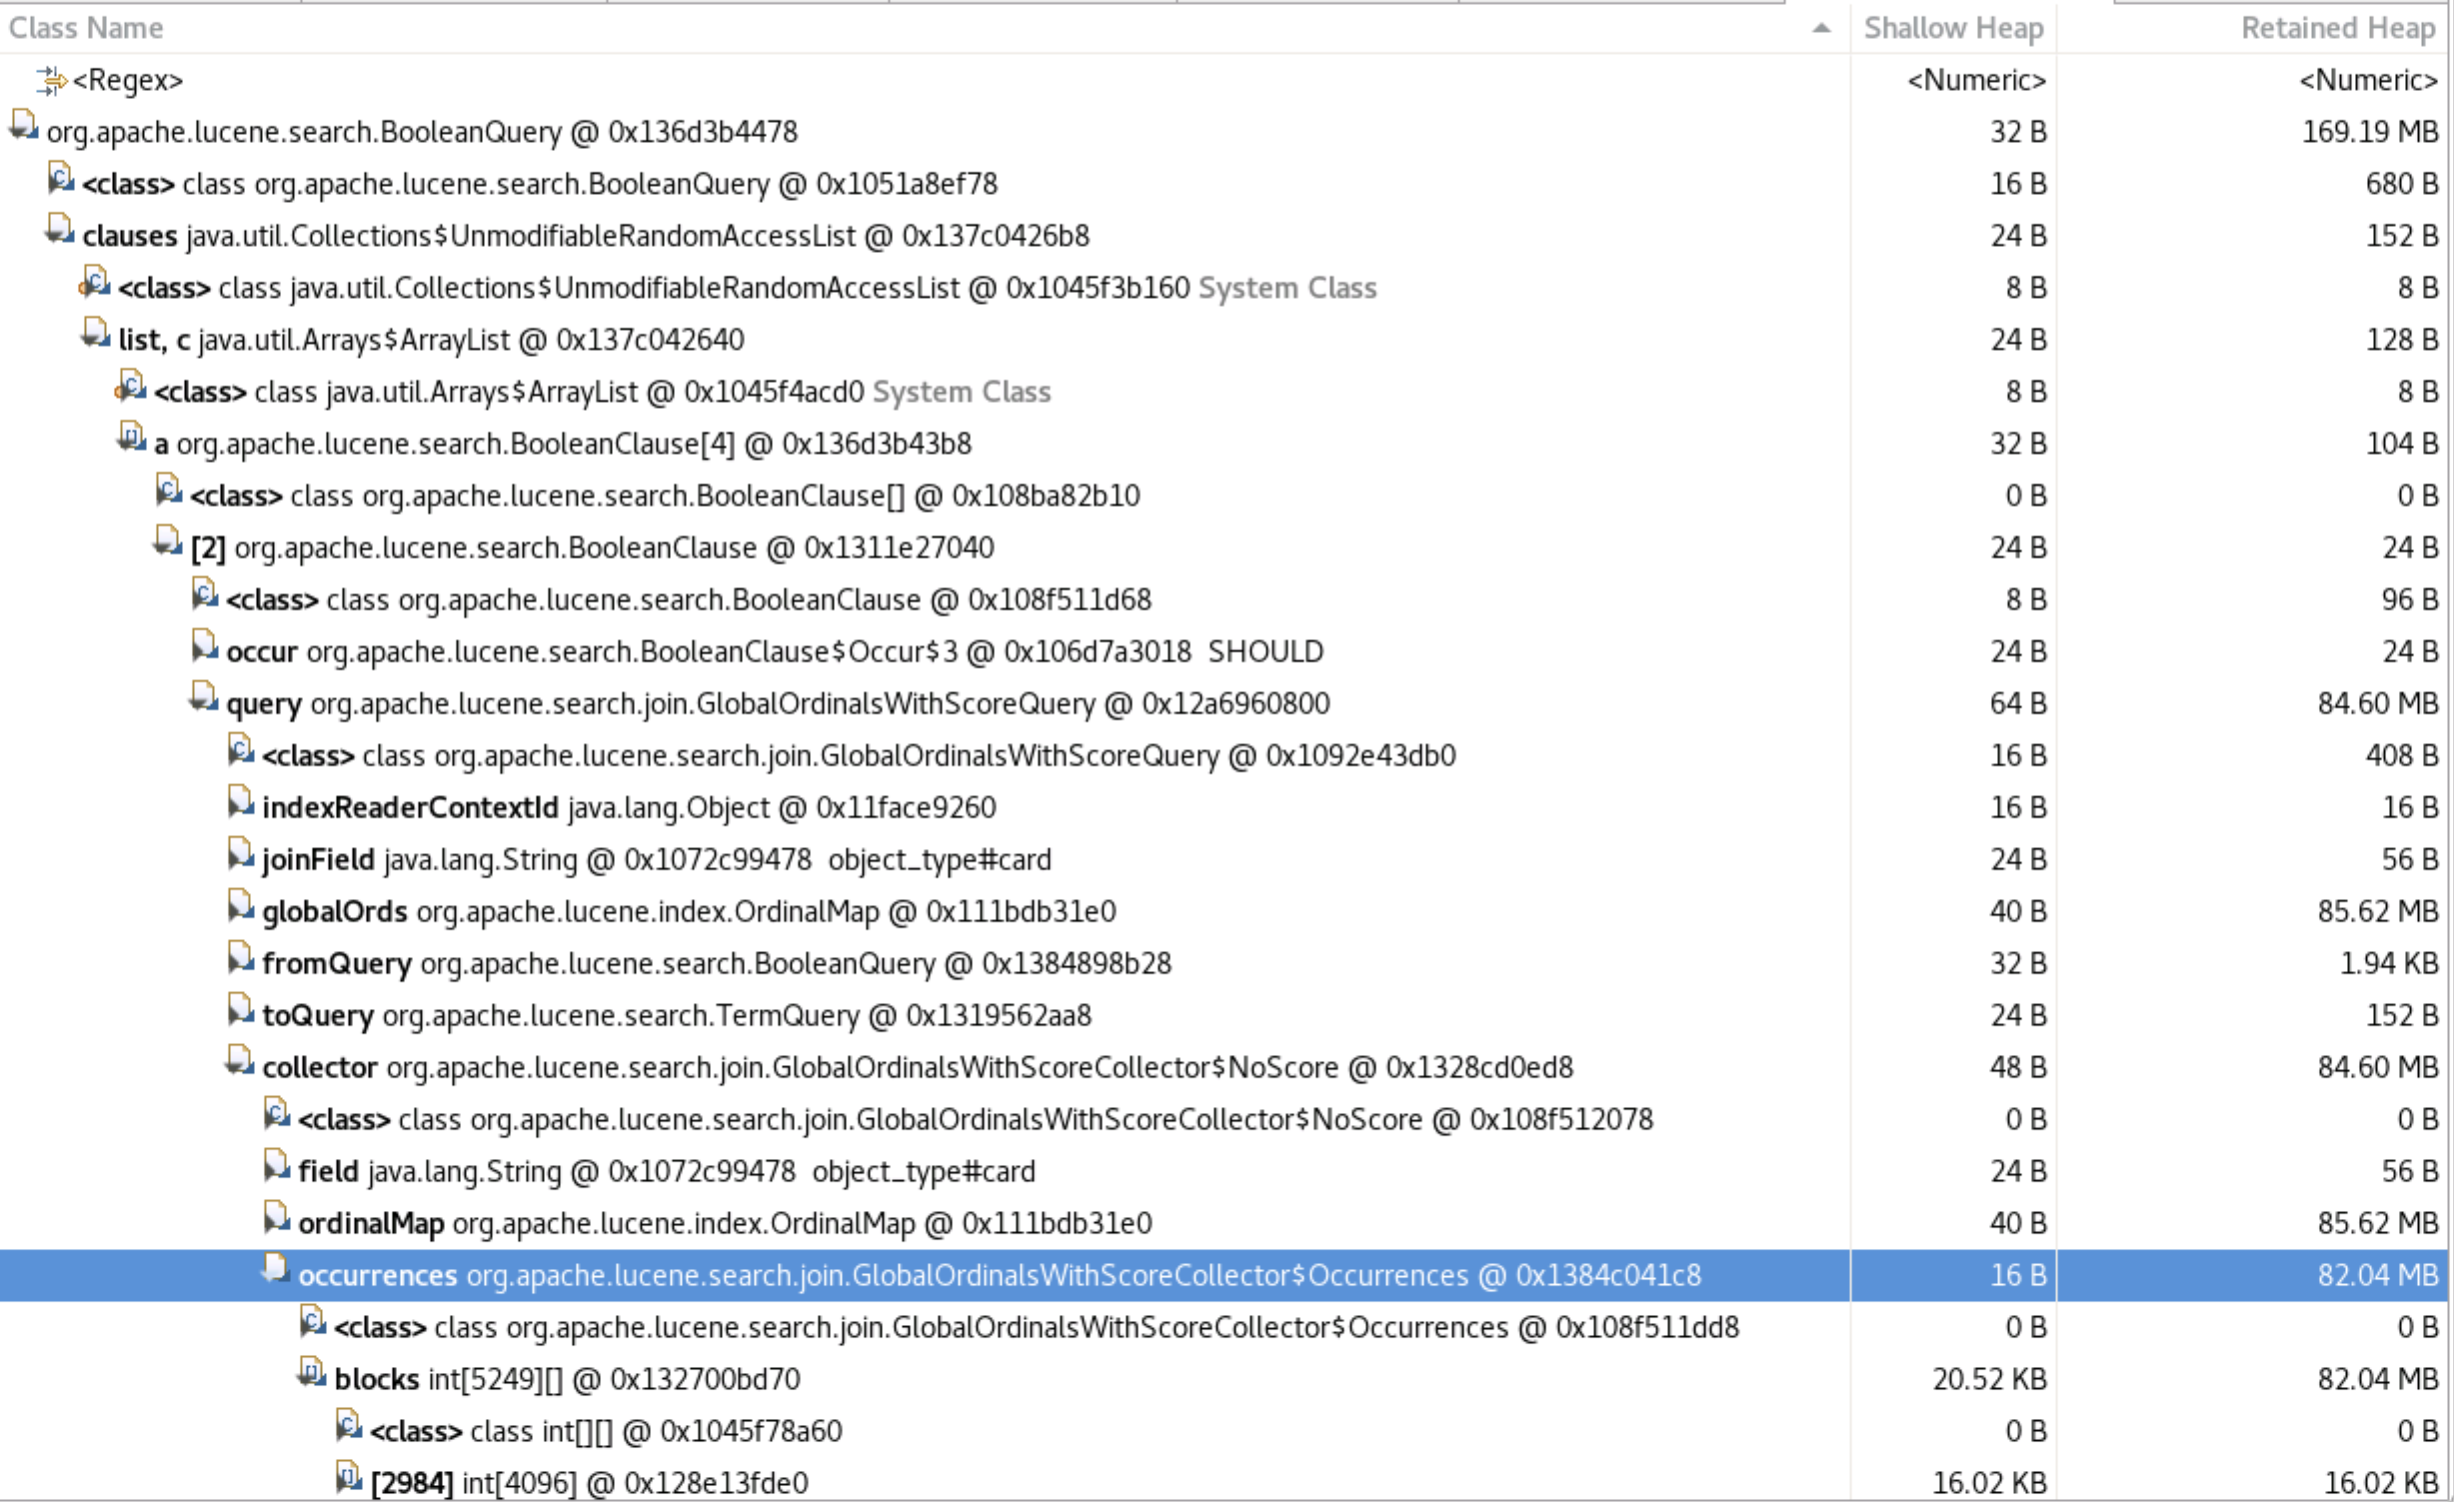
Heap Dump:
Allocation Profiling:
--- Execution profile ---
Total samples:         977413
Non-Java:              11 (0.00%)
Skipped:               31387 (3.21%)
Frame buffer usage:    46.0077%
--- 48294769408 bytes (57.66%), 59447 samples
  [ 0] int[]
  [ 1] org.apache.lucene.search.join.GlobalOrdinalsWithScoreCollector$Occurrences.increment
  [ 2] org.apache.lucene.search.join.GlobalOrdinalsWithScoreCollector$NoScore$1.collect
  [ 3] org.apache.lucene.search.Weight$DefaultBulkScorer.scoreAll
  [ 4] org.apache.lucene.search.Weight$DefaultBulkScorer.score
  [ 5] org.apache.lucene.search.BulkScorer.score
  [ 6] org.apache.lucene.search.IndexSearcher.search
  [ 7] org.apache.lucene.search.IndexSearcher.search
  [ 8] org.apache.lucene.search.join.JoinUtil.createJoinQuery
  [ 9] org.elasticsearch.join.query.HasChildQueryBuilder$LateParsingQuery.rewrite
  [10] org.apache.lucene.search.BooleanQuery.rewrite
  [11] org.apache.lucene.search.BooleanQuery.rewrite
  [12] org.elasticsearch.common.lucene.search.function.FunctionScoreQuery.rewrite
  [13] org.apache.lucene.search.IndexSearcher.rewrite
  [14] org.elasticsearch.search.internal.ContextIndexSearcher.rewrite
  [15] org.elasticsearch.search.DefaultSearchContext.preProcess
  [16] org.elasticsearch.search.query.QueryPhase.preProcess
  [17] org.elasticsearch.search.SearchService.createContext
  [18] org.elasticsearch.search.SearchService.createAndPutContext
  [19] org.elasticsearch.search.SearchService.executeQueryPhase
  [20] org.elasticsearch.search.SearchService.lambda$executeQueryPhase$1
  [21] org.elasticsearch.search.SearchService$$Lambda$3265.1063849546.apply
  [22] org.elasticsearch.action.ActionListener.lambda$map$2
  [23] org.elasticsearch.action.ActionListener$$Lambda$2569.1509551676.accept
  [24] org.elasticsearch.action.ActionListener$1.onResponse
  [25] org.elasticsearch.search.SearchService.lambda$rewriteShardRequest$7
  [26] org.elasticsearch.search.SearchService$$Lambda$3275.1890499706.accept
  [27] org.elasticsearch.action.ActionRunnable$1.doRun
  [28] org.elasticsearch.common.util.concurrent.ThreadContext$ContextPreservingAbstractRunnable.doRun
  [29] org.elasticsearch.common.util.concurrent.AbstractRunnable.run
  [30] java.util.concurrent.ThreadPoolExecutor.runWorker
  [31] java.util.concurrent.ThreadPoolExecutor$Worker.run
  [32] java.lang.Thread.run
--- 11083054400 bytes (13.23%), 675796 samples
  [ 0] int[] (out)
  [ 1] org.apache.lucene.search.join.GlobalOrdinalsWithScoreCollector$Occurrences.increment
  [ 2] org.apache.lucene.search.join.GlobalOrdinalsWithScoreCollector$NoScore$1.collect
  [ 3] org.apache.lucene.search.Weight$DefaultBulkScorer.scoreAll
  [ 4] org.apache.lucene.search.Weight$DefaultBulkScorer.score
  [ 5] org.apache.lucene.search.BulkScorer.score
  [ 6] org.apache.lucene.search.IndexSearcher.search
  [ 7] org.apache.lucene.search.IndexSearcher.search
  [ 8] org.apache.lucene.search.join.JoinUtil.createJoinQuery
  [ 9] org.elasticsearch.join.query.HasChildQueryBuilder$LateParsingQuery.rewrite
  [10] org.apache.lucene.search.BooleanQuery.rewrite
  [11] org.apache.lucene.search.BooleanQuery.rewrite
  [12] org.elasticsearch.common.lucene.search.function.FunctionScoreQuery.rewrite
  [13] org.apache.lucene.search.IndexSearcher.rewrite
  [14] org.elasticsearch.search.internal.ContextIndexSearcher.rewrite
  [15] org.elasticsearch.search.DefaultSearchContext.preProcess
  [16] org.elasticsearch.search.query.QueryPhase.preProcess
  [17] org.elasticsearch.search.SearchService.createContext
  [18] org.elasticsearch.search.SearchService.createAndPutContext
  [19] org.elasticsearch.search.SearchService.executeQueryPhase
  [20] org.elasticsearch.search.SearchService.lambda$executeQueryPhase$1
  [21] org.elasticsearch.search.SearchService$$Lambda$3265.1063849546.apply
  [22] org.elasticsearch.action.ActionListener.lambda$map$2
  [23] org.elasticsearch.action.ActionListener$$Lambda$2569.1509551676.accept
  [24] org.elasticsearch.action.ActionListener$1.onResponse
  [25] org.elasticsearch.search.SearchService.lambda$rewriteShardRequest$7
  [26] org.elasticsearch.search.SearchService$$Lambda$3275.1890499706.accept
  [27] org.elasticsearch.action.ActionRunnable$1.doRun
  [28] org.elasticsearch.common.util.concurrent.ThreadContext$ContextPreservingAbstractRunnable.doRun
  [29] org.elasticsearch.common.util.concurrent.AbstractRunnable.run
  [30] java.util.concurrent.ThreadPoolExecutor.runWorker
  [31] java.util.concurrent.ThreadPoolExecutor$Worker.run
  [32] java.lang.Thread.run
--- 10398745248 bytes (12.41%), 3851 samples
  [ 0] long[] (out)
  [ 1] org.apache.lucene.util.LongBitSet.<init>
  [ 2] org.apache.lucene.search.join.GlobalOrdinalsWithScoreCollector.<init>
  [ 3] org.apache.lucene.search.join.GlobalOrdinalsWithScoreCollector$NoScore.<init>
  [ 4] org.apache.lucene.search.join.JoinUtil.createJoinQuery
  [ 5] org.elasticsearch.join.query.HasChildQueryBuilder$LateParsingQuery.rewrite
  [ 6] org.apache.lucene.search.BooleanQuery.rewrite
  [ 7] org.apache.lucene.search.BooleanQuery.rewrite
  [ 8] org.elasticsearch.common.lucene.search.function.FunctionScoreQuery.rewrite
  [ 9] org.apache.lucene.search.IndexSearcher.rewrite
  [10] org.elasticsearch.search.internal.ContextIndexSearcher.rewrite
  [11] org.elasticsearch.search.DefaultSearchContext.preProcess
  [12] org.elasticsearch.search.query.QueryPhase.preProcess
  [13] org.elasticsearch.search.SearchService.createContext
  [14] org.elasticsearch.search.SearchService.createAndPutContext
  [15] org.elasticsearch.search.SearchService.executeQueryPhase
  [16] org.elasticsearch.search.SearchService.lambda$executeQueryPhase$1
  [17] org.elasticsearch.search.SearchService$$Lambda$3265.1063849546.apply
  [18] org.elasticsearch.action.ActionListener.lambda$map$2
  [19] org.elasticsearch.action.ActionListener$$Lambda$2569.1509551676.accept
  [20] org.elasticsearch.action.ActionListener$1.onResponse
  [21] org.elasticsearch.search.SearchService.lambda$rewriteShardRequest$7
  [22] org.elasticsearch.search.SearchService$$Lambda$3275.1890499706.accept
  [23] org.elasticsearch.action.ActionRunnable$1.doRun
  [24] org.elasticsearch.common.util.concurrent.ThreadContext$ContextPreservingAbstractRunnable.doRun
  [25] org.elasticsearch.common.util.concurrent.AbstractRunnable.run
  [26] java.util.concurrent.ThreadPoolExecutor.runWorker
  [27] java.util.concurrent.ThreadPoolExecutor$Worker.run
  [28] java.lang.Thread.run
 mitalawachat
All 10 comments
This could be caused by the fact that, starting in 7.3, these queries are not cached anymore. The query holds a reference to global ordinals that are computed for the entire shard so they should not be eligible for segment caching.
Are you running multiple queries in parallel ? I guess that it's not a single query that fails an entire node ?
We also committed a change in Lucene recently that should reduce the memory needed to run this query significantly. The GlobalOrdinalsWithScoreCollector$Occurrences that seems to take most of the memory in your summary is not needed if you don't filter by min_children or max_children.
Since the change is in Lucene and not released yet, I'll check if we can apply a workaround in Elasticsearch in the meantime.
 jimczi
on 10 Nov 2020
jimczi
on 10 Nov 2020
Pinging @elastic/es-search (:Search/Search)
 elasticmachine
on 10 Nov 2020
elasticmachine
on 10 Nov 2020
Are you running multiple queries in parallel ? I guess that it's not a single query that fails an entire node ?
Yes, we are running multiple queries in parallel
mitalawachat
on 10 Nov 2020
Do we see a scope of better circuit breakers for global ordinals, given that the global ordinals have caused issues with caching in the past #57400(the one you fixed making it non-cacheable), the side-effect of which is the current issue and a OOM manifestation.
 Bukhtawar
on 10 Nov 2020
Bukhtawar
on 10 Nov 2020
Global ordinals are not really the problem here. It's the internal structures that are used by the Lucene query to store informations about the matching ordinals that cause memory issues. The circuit breaker is in Elasticsearch so it cannot be used to control the memory used by a Lucene query. We could maybe add a way to plug such functionality in the original Lucene query or rewrite it in Elasticsearch using our data structures. However, the optimization I mentioned above should have a significant impact on the memory used so this might be not needed in the majority of use cases.
jimczi
on 10 Nov 2020
Thanks @jimczi :)
Looking at Lucene releases, looks like monthly release (https://lucene.apache.org/core/corenews.html)
We would like to know if what's ES plan to consume this optimization?
Also, if you have any updates about your previous comment: Since the change is in Lucene and not released yet, I'll check if we can apply a workaround in Elasticsearch in the meantime.
mitalawachat
on 17 Nov 2020
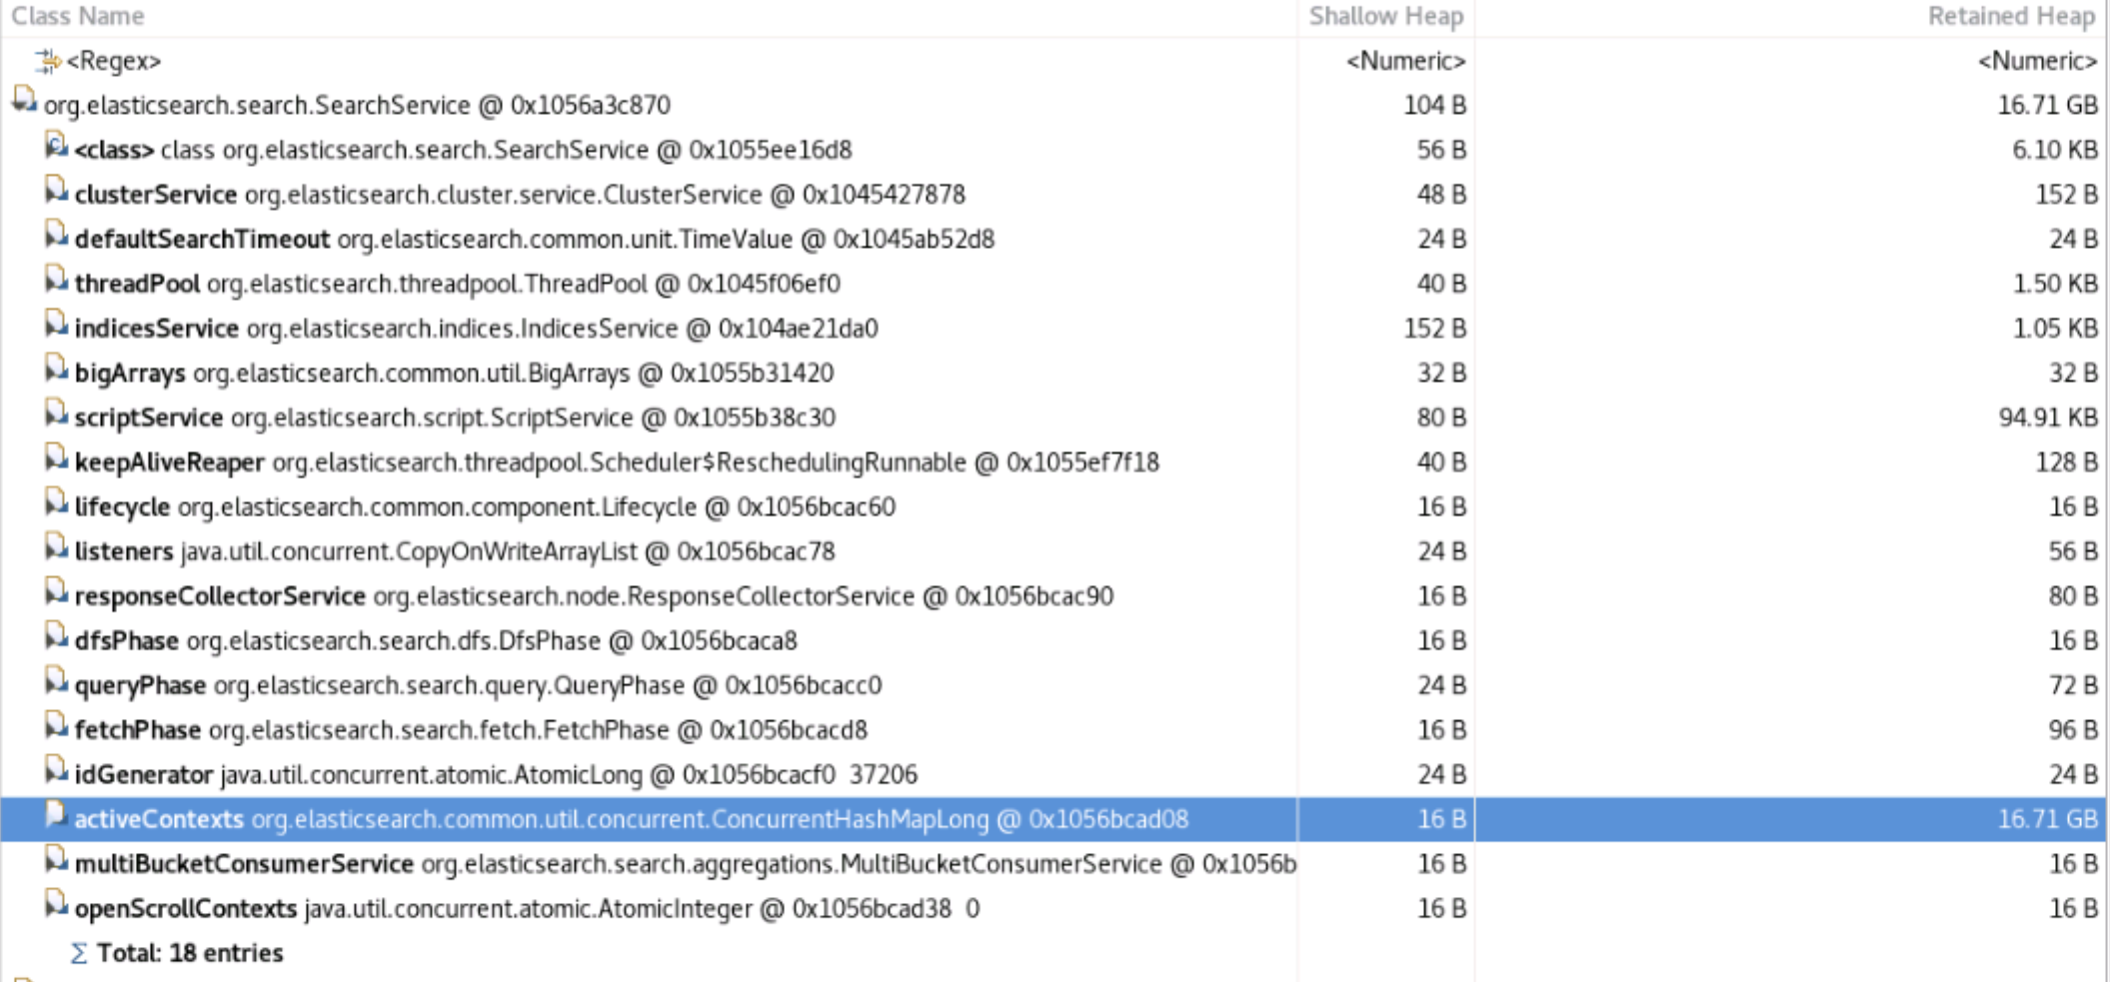
How many active contexts do you have in the heap dump ? If you have more active contexts than concurrent search requests it might be because of _scroll requests. So are you using _scroll and more importantly, are you closing the scroll context consistently ?
jimczi
on 17 Nov 2020
How many active contexts do you have in the heap dump ? If you have more active contexts than concurrent search requests it might be because of _scroll requests. So are you using _scroll and more importantly, are you closing the scroll context consistently ?
We are not using scroll api.
mitalawachat
on 20 Nov 2020
The GlobalOrdinalsWithScoreCollector$Occurrences that seems to take most of the memory in your summary is not needed if you don't filter by min_children or max_children.
I think when #41555 changed the default for min_children, even queries which didn't use min_children got de-optimized. Specifying min_children: 0 (thereby triggering the deprecation warning on purpose) seems to help in our case. I think it triggers the optimization again until the optimization gets merged when ES updates to Lucene 8.8.
 Sebmaster
on 20 Nov 2020
Sebmaster
on 20 Nov 2020
Thanks @Sebmaster, that's the workaround you can use until we release LUCENE-9023.
The fix is merged and will be available in the next minor release of Lucene so I am closing this issue. Thanks for reporting @mitalawachat !
jimczi
on 23 Nov 2020
Related issues
 martijnvg
·
3Comments
martijnvg
·
3Comments
 ppf2
·
3Comments
ppf2
·
3Comments
 clintongormley
·
3Comments
clintongormley
·
3Comments
 malpani
·
3Comments
malpani
·
3Comments
 jpountz
·
3Comments
jpountz
·
3Comments
Most helpful comment
This could be caused by the fact that, starting in 7.3, these queries are not cached anymore. The query holds a reference to global ordinals that are computed for the entire shard so they should not be eligible for segment caching.
Are you running multiple queries in parallel ? I guess that it's not a single query that fails an entire node ?
We also committed a change in Lucene recently that should reduce the memory needed to run this query significantly. The
GlobalOrdinalsWithScoreCollector$Occurrencesthat seems to take most of the memory in your summary is not needed if you don't filter bymin_childrenormax_children.Since the change is in Lucene and not released yet, I'll check if we can apply a workaround in Elasticsearch in the meantime.