Elasticsearch: use_real_memory setting causes GC collection issues
Elasticsearch version (bin/elasticsearch --version): 7.8.1
Plugins installed: []
JVM version (java -version): bundled
OS version (uname -a if on a Unix-like system): rhel 6 & 7
Description of the problem including expected versus actual behavior:
Garbage collection not happening as expected when use_real_memory setting is enabled.
Steps to reproduce:
Please include a minimal but complete recreation of the problem,
including (e.g.) index creation, mappings, settings, query etc. The easier
you make for us to reproduce it, the more likely that somebody will take the
time to look at it.
    #Circuit Breaker Settings
    'indices.breaker.fielddata.limit' => '1%',
    'indices.breaker.fielddata.overhead' => '1.03',
    'indices.breaker.request.limit' => '60%',
    'indices.breaker.request.overhead' =>'1',
    'indices.breaker.total.limit' => '95%',
    'network.breaker.inflight_requests.limit' => '85%',
    'network.breaker.inflight_requests.overhead' => "2",
jvm.options
      10-:-XX:+UseG1GC
      10-:-XX:G1ReservePercent=20
      10-:-XX:InitiatingHeapOccupancyPercent=30
      10-:-XX:G1HeapRegionSize=16m
      10-:-XX:MaxGCPauseMillis=400
      10-:-XX:ParallelGCThreads=8
      10-:-XX:ConcGCThreads=6
      10-:-XX:+UseStringDeduplication
      -server
      -Djava.awt.headless=true
      -Dfile.encoding=UTF-8
      -Dio.netty.noUnsafe=true
      -Dio.netty.noKeySetOptimization=true
      -Dio.netty.recycler.maxCapacityPerThread=0
      -Dio.netty.allocator.type=unpooled
      -Dlog4j.shutdownHookEnabled=false
      -Dlog4j2.disable.jmx=true
      -Dlog4j.skipJansi=true
      -XX:+HeapDumpOnOutOfMemoryError
query... which was ran against 6Tb data
{"aggs":{"2":{"terms":{"field":"visit.applicationDetails.applicationType","order":{"_count":"desc"},"size":5},"aggs":{"3":{"terms":{"field":"state.view.previousPage.pageName","order":{"_count":"desc"},"size":50},"aggs":{"4":{"terms":{"field":"message.name","order":{"_count":"desc"},"size":5},"aggs":{"5":{"terms":{"field":"operation.operationType","order":{"_count":"desc"},"size":20},"aggs":{"6":{"terms":{"field":"state.view.currentPage.elements.standardizedName","order":{"_count":"desc"},"size":20},"aggs":{"7":{"cardinality":{"field":"visit.account.encAccountNumber"}}}}}}}}}}}}},"size":0,"_source":{"excludes":[]},"stored_fields":["*"],"query":{"bool":{"must":[],"filter":[{"match_all":{}},{"match_phrase":{"visit.applicationDetails.applicationName":{"query":"Spectrum Guide"}}},{"bool":{"should":[{"match_phrase":{"message.name":"selectAction"}},{"match_phrase":{"message.name":"playbackSelect"}}],"minimum_should_match":1}},{"range":{"message.timestamp":{"format":"strict_date_optional_time","gte":"2020-08-16T06:00:00.000Z","lte":"2020-09-24T06:00:00.000Z"}}}],"should":[],"must_not":[]}}}
Provide logs (if relevant):
First set of query runs with use_real_memory: false
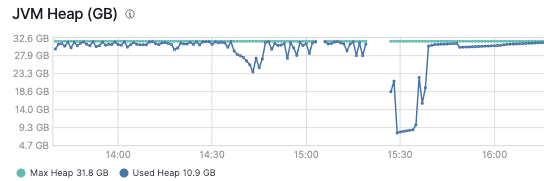
Second set of queries run with use_real_memory: true, also stopped running the queries due to circuit breaker exceptions after ~5 minutes
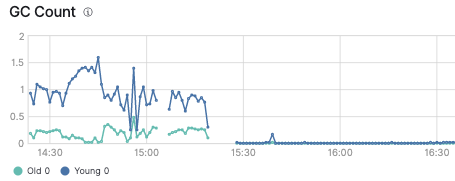
You can see no GC happening for second set of queries
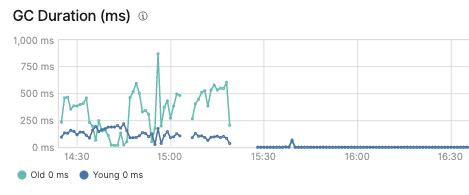
GC Duration also not happening on second set of queries
 lanerjo
All 10 comments
Upon further investigation of this matter. I noticed, that because GC has not cleaned up the memory in use, the node will continue to report circuit breaker exceptions for all subsequent calls, effectively making the node useless.
lanerjo
on 12 Sep 2020
@lanerjo
What was your heap usage before running those queries? It looks like it's close to 100% for most of the above graph.
What kind of client were you using to run those queries? Could it be that the client started backing off from sending more requests due to the 503 errors (that happened pretty much all the time due to being almost out of heap to begin with) and that's why there's no GC happening?
 original-brownbear
on 14 Sep 2020
original-brownbear
on 14 Sep 2020
I am using rally with a custom query load to generate those queries.
Here is the graph for the entire day...
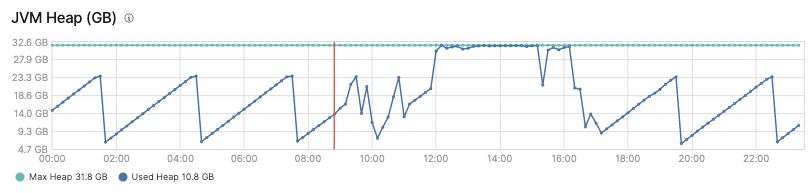
The difference...
Use real memory turned off, the same set of queries succeed and GC happens queries return successfully.
Use real memory enabled, the same set of queries first one succeeds, then subsequent queries fail with circuit breaker exception.
Short simple explanation, use real memory does not release heap in a reasonable amount of time. causing coordinating only node to become useless, stop serving even light queries, run into OOM on a query that was returning previously. It seems like most issues with circuit breakers the default answer from most Elastic responses seems to be to use_real_memory: true.
The rally client was not backing off queries, which I would expect to not happen during a load test.
I did find another issue related to this, so this should be a known bug... This was known before the 7.8.1 release, fixed before the 7.8.1 release, but it was not ported to 7.8.1. However this is not listed in the documentation.
This is a potentially breaking bug, that could cause a lot of admins headaches beyond belief... I cannot even imagine having to restart coordinating only nodes due to an issue like this. I am glad I discovered this issue through testing, and before deploying to a production environment, where my users would have been affected.
lanerjo
on 14 Sep 2020
I can confirm similar problem on data nodes (ES version 7.8.0).
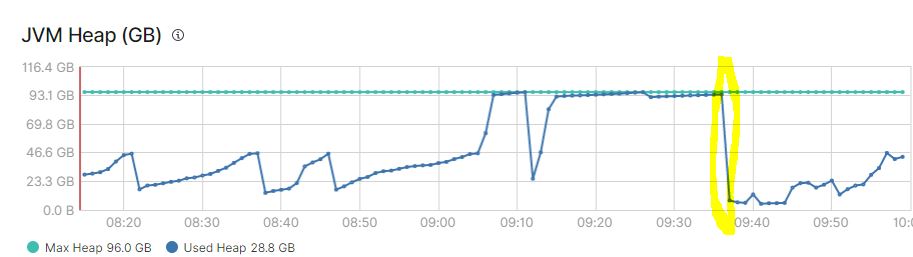
If use_real_memory setting is enabled and I put cluster under memory pressure for example by increasing number of replicas at once (at 9:05 on the graph bellow), I get into situation that some data nodes start to refuse requests, they even say that shards cannot be correctly opened etc.
If I try to wait, it doesn't help. Eventually I had to restart affected data nodes (the yellow mark on the graph).
I had to disable use_real_memory setting at all to ensure that my cluster doesn't crash every time it starts to create more than few replicas at once. With this option disabled, memory consumption goes up for a while, but GC handles it well.
 zdeseb
on 14 Sep 2020
zdeseb
on 14 Sep 2020
Pinging @elastic/es-core-infra (:Core/Infra/Circuit Breakers)
 elasticmachine
on 15 Sep 2020
elasticmachine
on 15 Sep 2020
I would expect this issue to be better on Elasticsearch 7.9.0+ with the fix @henningandersen made for these situations in #58674.
@zdeseb @lanerjo are you able to upgrade to 7.9?
 jaymode
on 18 Sep 2020
jaymode
on 18 Sep 2020
@jaymode At the moment I am quite happy with the workaround (disabled use_real_memory setting) but I believe that in a few weeks we will upgrade our test cluster and then we will see...
zdeseb
on 18 Sep 2020
@zdeseb @lanerjo Were you able to try 7.9.0+? As Jay mentioned, we expect the situation to be better there. There doesn't seem to be much we can do here as we have not experienced this issue in our own tests, nor have we heard other reports.
 rjernst
on 15 Dec 2020
rjernst
on 15 Dec 2020
Since this is likely fixed in 7.9+, I will close this issue. @zdeseb and @lanerjo please reopen this if you still encounter this issue after upgrade to 7.9+.
 henningandersen
on 29 Dec 2020
henningandersen
on 29 Dec 2020
@zdeseb @lanerjo Were you able to try 7.9.0+? As Jay mentioned, we expect the situation to be better there. There doesn't seem to be much we can do here as we have not experienced this issue in our own tests, nor have we heard other reports.
@rjernst I am sorry but we were not :-(
Still running the same version as in September (other business priorities etc...)
zdeseb
on 29 Dec 2020
Related issues
rjernst
·
3Comments
 brwe
·
3Comments
brwe
·
3Comments
 rbayliss
·
3Comments
rbayliss
·
3Comments
 Praveen82
·
3Comments
Praveen82
·
3Comments
 makeyang
·
3Comments
makeyang
·
3Comments