Elasticsearch: Data node with spinning disk crashes (OutOfMemoryError)
Hi everyone.
We're experiencing a critical production issue when trying to utilize cold-nodes architecture (moving indices from SSD disk nodes to HDD disk nodes). The following the is the full report:
Elasticsearch version (bin/elasticsearch --version):
5.2.2
Plugins installed: []
ingest-attachment
ingest-geoip
mapper-murmur3
mapper-size
repository-azure
repository-gcs
repository-s3
x-pack
JVM version (java -version):
openjdk version "1.8.0_151"
OpenJDK Runtime Environment (build 1.8.0_151-8u151-b12-0ubuntu0.16.04.2-b12)
OpenJDK 64-Bit Server VM (build 25.151-b12, mixed mode)
OS version (uname -a if on a Unix-like system):
Linux 4.4.0-47-generic #68-Ubuntu SMP 2016 x86_64 GNU/Linux
Description of the problem including expected versus actual behavior:
Our cluster has fast, local SSD disks nodes for indexing new data, and slower spinning SSD disks for older data. esdatacold nodes specification:
8 cores
32GB of ram (16GB allocated for es heap)
10TB of disks (5 spinning disks, 2TB each formatted using GPT and ext4)
~700 shards / 3TB of data used on each node
Older indices are backed-up using a snapshot to cold storage, and then we change their settings:
{
    "index.routing.allocation.include._name": "esdatacold*",
    "index.routing.allocation.total_shards_per_node": "-1"
}
Additionally, to minimize the amount of work each esdatacold handling consecutively, we've reduced cluster.routing.allocation.node_concurrent_recoveries to 1 (moving only 1 shard per node into the esdatacold nodes).
However, the elasticsearch process in these nodes crashes with an OutOfMemory exception. Looking at the stacktrace, it seems that all threads are waiting for a lock to be released. This is the full stacktrace of the process: https://pastebin.com/6q8GtSeg
I can understand if an overloaded node (e.g. high number of shards per GB heap or something similar) performs poorly, but a crash has severe performance effects on the whole cluster, and this should definitely be protected against.
Is there anything we can do to prevent this crash?
Is there any memory configuration we're missing?
Steps to reproduce:
Please include a minimal but complete recreation of the problem, including
(e.g.) index creation, mappings, settings, query etc. The easier you make for
us to reproduce it, the more likely that somebody will take the time to look at it.
None yet. This is a production-scale issue, so it is not easy to reproduce.
I'd be happy to provide additional details, whatever is needed.
Thanks!
 redlus
All 24 comments
@elastic/es-distributed
 albertzaharovits
on 20 Feb 2018
albertzaharovits
on 20 Feb 2018
This looks like another Netty's recycler issue, but it should be disabled in 5.2.2 thanks to #22452.
@redlus Can you please provide the JVM options for the node esdatacold2-prod? They are printed out in the logs at startup time (something like [INFO ][o.e.n.Node] [node-0] JVM arguments [...] ) or you can list them using curl -XGET 'http://localhost:9200/_nodes/node-0/jvm?pretty'
Also, a heap dump would help to identify the objects that fill the memory.
elasticsearch[esdatacold2-prod][[transport_server_worker.default]][T#14] [DAEMON] RUNNABLE tid: 60
java.lang.OutOfMemoryError.<init>() OutOfMemoryError.java:48
io.netty.buffer.PoolArena$HeapArena.newUnpooledChunk(int) PoolArena.java:661
 tlrx
on 20 Feb 2018
tlrx
on 20 Feb 2018
@tlrx The JVM arguments are not logged at startup nor available in the API in 5.2.2, that is only since 5.4.1 (#24450, #24451). Here, to have the JVM arguments, the user needs to shell into an instance running Elasticsearch and execute jps -l -m -v and share the output.
 jasontedor
on 20 Feb 2018
jasontedor
on 20 Feb 2018
Thanks @jasontedor. I thought it was older but I admit I didn't double checked.
tlrx
on 20 Feb 2018
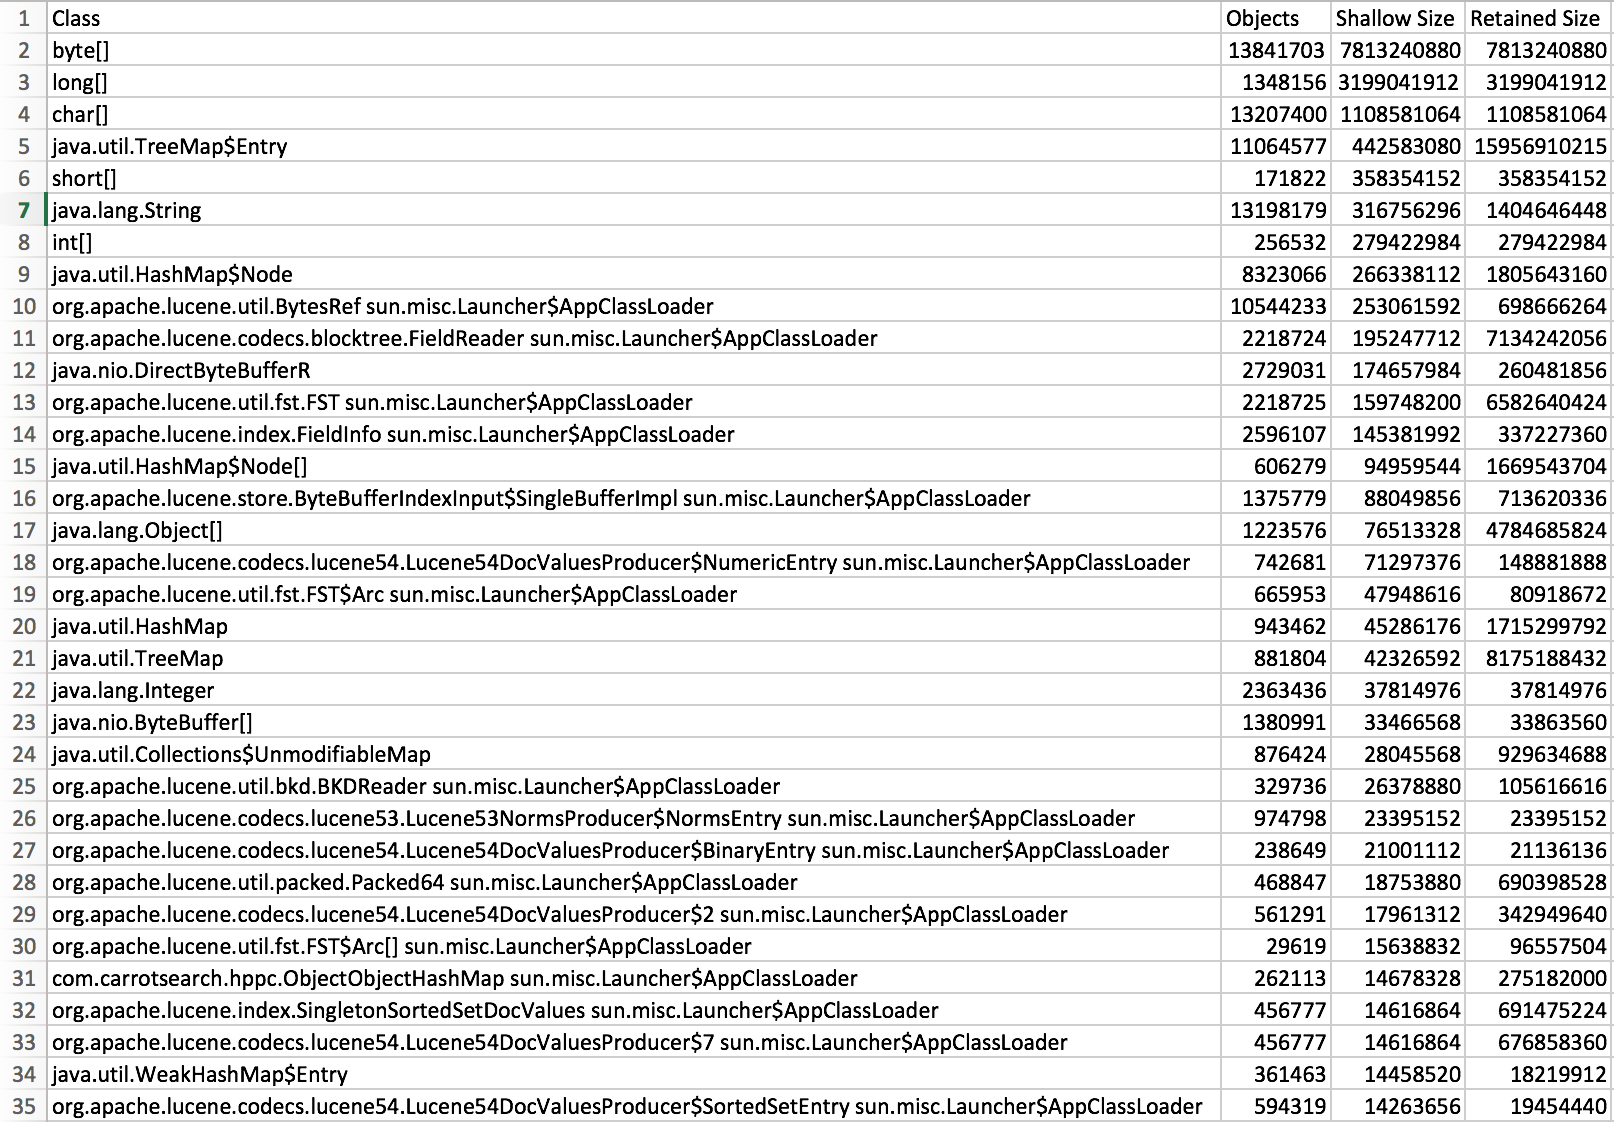
We will upload the full memory dump (17 GB, 6GB compressed), until then here is an export form yourKit of the objects by class. Hope it will help.
Objects-by-class.csv.zip
 farin99
on 20 Feb 2018
farin99
on 20 Feb 2018
@tlrx here are the JVM options, along with GC/memory pools if relevant:
{
  "jvm": {
    "pid": 77144,
    "version": "1.8.0_151",
    "vm_name": "OpenJDK 64-Bit Server VM",
    "vm_version": "25.151-b12",
    "vm_vendor": "Oracle Corporation",
    "start_time_in_millis": 1519136454276,
    "mem": {
      "heap_init_in_bytes": 16106127360,
      "heap_max_in_bytes": 16036397056,
      "non_heap_init_in_bytes": 2555904,
      "non_heap_max_in_bytes": 0,
      "direct_max_in_bytes": 16036397056
    },
    "gc_collectors": [
      "ParNew",
      "ConcurrentMarkSweep"
    ],
    "memory_pools": [
      "Code Cache",
      "Metaspace",
      "Compressed Class Space",
      "Par Eden Space",
      "Par Survivor Space",
      "CMS Old Gen"
    ],
    "using_compressed_ordinary_object_pointers": "true"
  }
}
The heap dump is pretty large, but I'll upload it soon.
redlus
on 20 Feb 2018
We will upload the full memory dump (17 GB, 6GB compressed), until then here is an export form yourKit of the objects by class. Hope it will help.
@farin99 @redlus A full memory dump might contain sensitive data so I'm not sure you want to make it public. But an overview of the biggest objects can help.
tlrx
on 20 Feb 2018
Thanks @redlus. Can you apply Jason's comment and provide the output please?
tlrx
on 20 Feb 2018
@tlrx for sure..:
77144 org.elasticsearch.bootstrap.Elasticsearch -p /var/run/elasticsearch/elasticsearch.pid --quiet -Edefault.path.logs=/var/log/elasticsearch -Edefault.path.data=/var/lib/elasticsearch -Edefault.path.conf=/etc/elasticsearch -Xms15g -Xmx15g -XX:+UseConcMarkSweepGC -XX:CMSInitiatingOccupancyFraction=75 -XX:+UseCMSInitiatingOccupancyOnly -XX:+DisableExplicitGC -XX:+AlwaysPreTouch -Xss1m -Djava.awt.headless=true -Dfile.encoding=UTF-8 -Djna.nosys=true -Djdk.io.permissionsUseCanonicalPath=true -Dio.netty.noUnsafe=true -Dio.netty.noKeySetOptimization=true -Dio.netty.recycler.maxCapacityPerThread=0 -Dlog4j.shutdownHookEnabled=false -Dlog4j2.disable.jmx=true -Dlog4j.skipJansi=true -XX:+HeapDumpOnOutOfMemoryError -XX:MaxGCPauseMillis=800 -Des.path.home=/usr/share/elasticsearch
redlus
on 20 Feb 2018
@tlrx also, does the .csv file @farin99 uploaded contain the object requested?
e.g.
redlus
on 20 Feb 2018
@redlus You have to run this as the same user that runs the Elasticsearch process and on a machine where one of the instances in your cluster is running.
jasontedor
on 20 Feb 2018
Here is an overview of the biggest objects
Objects-with-biggest-retained-size.csv.zip
farin99
on 20 Feb 2018
@jasontedor right, I've amended the previous comment with the correct information.
redlus
on 20 Feb 2018
Do you set index.merge.scheduler.max_thread_count on your cold nodes with the spinning disks? If so, would you please share the value that you're setting it to? If not, would you please set index.merge.scheduler.max_thread_count to 1?
jasontedor
on 20 Feb 2018
We haven't changed this setting, so I believe it is set to the default (4, in our case).
redlus
on 20 Feb 2018
I encourage you to change this setting to 1 for your cold nodes with spinning disks. Please let us know what impact this has on your cluster after making this change.
jasontedor
on 20 Feb 2018
I will try changing this setting to check if it affects the crash. However, the fact that a default setting actually causes the process to crash is a bit bizarre. Shouldn't there be some kind of protection against such cases?
redlus
on 20 Feb 2018
Two quick questions about merge thread count:
- This seems to be an index setting. Is there a way to set this per node?
- How many threads would the merge module run if two indices with different max_thread_count settings are located in the same node (with a spinning disk)? i.e., one index with 4 and one index with 1.
redlus
on 20 Feb 2018
This seems to be an index setting. Is there a way to set this per node?
No, you can only set this an index setting; you would have to set this as part your migration to your cold tier.
How many threads would the merge module run if two indices with different max_thread_count settings are located in the same node (with a spinning disk)? i.e., one index with 4 and one index with 1.
Up to five concurrent threads could be running here.
jasontedor
on 20 Feb 2018
@tlrx @jasontedor
If this helps, I now have the full compressed dump available. We can discuss how to privately let you access this file (to prevent this information from being publicly available).
redlus
on 20 Feb 2018
Up to five concurrent threads could be running here.
@jasontedor so if I have 100 indexes (index.merge.scheduler.max_thread_count=4 in each one ), I could have 400 threads running at the same time? Are they limited by a thread pool of any kind?
I encourage you to change this setting to 1 for your cold nodes with spinning disks. Please let us know what impact this has on your cluster after making this change.
How will this prevent many threads from running on a spinning disk node if such a node has 100 indices set to 1 thread per index?
Regarding the dump, there are many threads in WAITING state. Most of them has the same call stack :
elasticsearch[esdatacold2-prod][bulk][T#6] [DAEMON] State: WAITING tid: 115
sun.misc.Unsafe.park(boolean, long) Unsafe.java
java.util.concurrent.locks.LockSupport.park(Object) LockSupport.java:175
java.util.concurrent.LinkedTransferQueue.awaitMatch(LinkedTransferQueue$Node, LinkedTransferQueue$Node, Object, boolean, long) LinkedTransferQueue.java:737
java.util.concurrent.LinkedTransferQueue.xfer(Object, boolean, int, long) LinkedTransferQueue.java:647
java.util.concurrent.LinkedTransferQueue.take() LinkedTransferQueue.java:1269
org.elasticsearch.common.util.concurrent.SizeBlockingQueue.take() SizeBlockingQueue.java:161
java.util.concurrent.ThreadPoolExecutor.getTask() ThreadPoolExecutor.java:1074
java.util.concurrent.ThreadPoolExecutor.runWorker(ThreadPoolExecutor$Worker) ThreadPoolExecutor.java:1134
java.util.concurrent.ThreadPoolExecutor
@jasontedor
I encourage you to change this setting to 1 for your cold nodes with spinning disks. Please let us know what impact this has on your cluster after making this change.
I'm running one of the spinning disk nodes for the last couple of hours after setting index.merge.scheduler.max_thread_count=1 to all of the indices it contains. These indices are marked for rerouting to other nodes (with SSD disks), and for now everything seems to work.
This poses two issues:
How many threads would the merge module run if two indices with different max_thread_count settings are located in the same node (with a spinning disk)? i.e., one index with 4 and one index with 1.
Up to five concurrent threads could be running here.
- The fact that the default setting of this parameter causes spinning disk nodes to crash is troubling. There must be some memory / thread pool bug which should be isolated here. Also, if I understand correctly, rerouting many indices into such spinning disk nodes may actually cause an out of memory exception again - as more threads handle merging (as it is 1 thread per index). This thought is alarming is well.
@tlrx, is there any other information needed to tackle this, or the dump information we have already provided is enough?
This seems to be an index setting. Is there a way to set this per node?
No, you can only set this an index setting; you would have to set this as part your migration to your cold tier.
- A strategy where this parameter is set per index is odd in my opinion. When I want to move these indices to other nodes I must actually monitor when the reroute has finished and only when they reside in the new (SSD) nodes I can re-set index.merge.scheduler.max_thread_count back to 4 - otherwise risking a crash in these (originating) HDD nodes. This is especially true if the effect of such a parameter is based on hardware (the node) and not the data (the shards/indices).
feature_request...
redlus
on 21 Feb 2018
For the issues that you raise, please see #28555, I think it covers everything?
This is the first time that I have ever seen this lead to out of memory issues. Previously we assumed spinning and required adjustment if on SSD, today we do the opposite. We do document that on spinning disks users should set this setting to 1.
I am going to close this as we've solved your immediate production issue and I think the issues you raised are covered in an existing issue.
jasontedor
on 21 Feb 2018
I forgot to reply to this concern, sorry:
Regarding the dump, there are many threads in WAITING state. Most of them has the same call stack :
elasticsearch[esdatacold2-prod][bulk][T#6] [DAEMON] State: WAITING tid: 115
sun.misc.Unsafe.park(boolean, long) Unsafe.java
java.util.concurrent.locks.LockSupport.park(Object) LockSupport.java:175
java.util.concurrent.LinkedTransferQueue.awaitMatch(LinkedTransferQueue$Node, LinkedTransferQueue$Node, Object, boolean, long) LinkedTransferQueue.java:737
java.util.concurrent.LinkedTransferQueue.xfer(Object, boolean, int, long) LinkedTransferQueue.java:647
java.util.concurrent.LinkedTransferQueue.take() LinkedTransferQueue.java:1269
org.elasticsearch.common.util.concurrent.SizeBlockingQueue.take() SizeBlockingQueue.java:161
java.util.concurrent.ThreadPoolExecutor.getTask() ThreadPoolExecutor.java:1074
java.util.concurrent.ThreadPoolExecutor.runWorker(ThreadPoolExecutor$Worker) ThreadPoolExecutor.java:1134
java.util.concurrent.ThreadPoolExecutor
This is normal, these are threads that are parked waiting for a task to execute.
jasontedor
on 22 Feb 2018
Related issues
 makeyang
·
3Comments
jasontedor
·
3Comments
makeyang
·
3Comments
jasontedor
·
3Comments
 dadoonet
·
3Comments
dadoonet
·
3Comments
 DhairyashilBhosale
·
3Comments
DhairyashilBhosale
·
3Comments
 dawi
·
3Comments
dawi
·
3Comments