Elasticsearch: Broken stats serialization
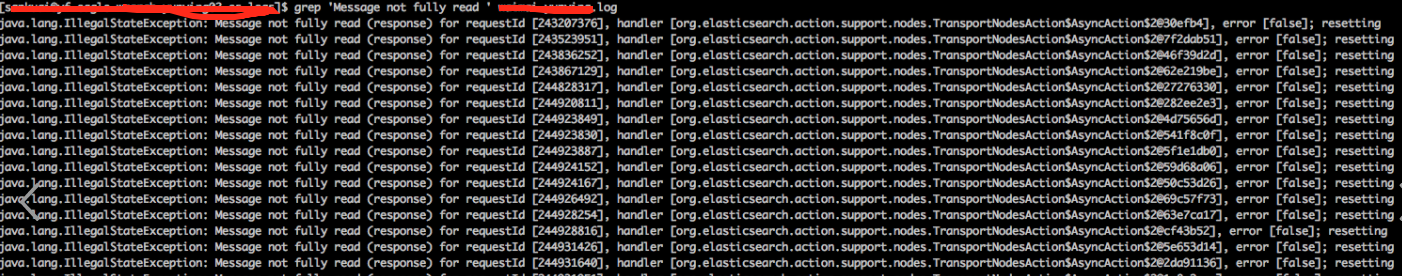
We have a serialization bug somewhere in the stats serialization code. I've now seen five six independent reports (2, 4, 5 and two three more that are not linkable) of:
[2016-12-12T09:26:50,081][WARN ][o.e.t.n.Netty4Transport  ] [...] exception caught on transport layer [[id: 0xcbdaf621, L:/...:35678 - R:.../...:9300]], closing connection
java.lang.IllegalStateException: Message not fully read (response) for requestId [...], handler [org.elasticsearch.transport.TransportService$ContextRestoreResponseHandler/org.elasticsearch.action.support.nodes.TransportNodesAction$AsyncAction$1@44aa70c], error [false]; resetting
    at org.elasticsearch.transport.TcpTransport.messageReceived(TcpTransport.java:1257) ~[elasticsearch-5.1.1.jar:5.1.1]
and the related
Caused by: java.io.EOFException: tried to read: 91755306 bytes but only 114054 remaining
and
Caused by: java.lang.IllegalStateException: No routing state mapped for [103]
    at org.elasticsearch.cluster.routing.ShardRoutingState.fromValue(ShardRoutingState.java:71) ~[elasticsearch-5.1.1.jar:5.1.1]
It seems to always be in some stats response, either a node stats response, or a cluster stats response and it's coming from TransportBroadcastByNodeAction and the single action defined by a lambda in TransportNodesAction$AsyncAction. We are blowing reading the stream somewhere and then reading garbage subsequently.
Whatever it is, it's pesky. So far, there is not a reliable reproduction and finding the bug is tricky since these responses serialize the entire world.
The first instance of this led to #21478 so that we know the handler name, #22152 so we can detect corruption earlier, and #22223 to clean up some serialization code. Right now, I do not think we've squashed the issue.
 jasontedor
All 22 comments
This is possibly related to having indices from 2.x in the cluster.
jasontedor
on 21 Dec 2016
This is possibly related to having indices from 2.x in the cluster.
This was a red herring, it was far more sinister.
jasontedor
on 21 Dec 2016
So what was the solution? We are seeing a simliar error message that is removing our data nodes from our cluster:
[WARN ][o.e.t.n.Netty4Transport  ] [...] exception caught on transport layer [[id: 0x2ece9a4b, L:/..:49172 - R:../...:9300]], closing connection
java.lang.IllegalStateException: Message not fully read (response) for requestId [2336886], handler [org.elasticsearch.transport.TransportService$ContextRestoreResponseHandler/org.elasticsearch.action.support.broadcast.node.TransportBroadcastByNodeAction$AsyncAction$1@5d3a1f72], error [false]; resetting
        at org.elasticsearch.transport.TcpTransport.messageReceived(TcpTransport.java:1257) ~[elasticsearch-5.1.1.jar:5.1.1]
        at org.elasticsearch.transport.netty4.Netty4MessageChannelHandler.channelRead(Netty4MessageChannelHandler.java:74) ~[transport-netty4-5.1.1.jar:5.1.1]
        at io.netty.channel.AbstractChannelHandlerContext.invokeChannelRead(AbstractChannelHandlerContext.java:373) [netty-transport-4.1.6.Final.jar:4.1.6.Final]
        at io.netty.channel.AbstractChannelHandlerContext.invokeChannelRead(AbstractChannelHandlerContext.java:359) [netty-transport-4.1.6.Final.jar:4.1.6.Final]
        at io.netty.channel.AbstractChannelHandlerContext.fireChannelRead(AbstractChannelHandlerContext.java:351) [netty-transport-4.1.6.Final.jar:4.1.6.Final]
        at io.netty.handler.codec.ByteToMessageDecoder.fireChannelRead(ByteToMessageDecoder.java:293) [netty-codec-4.1.6.Final.jar:4.1.6.Final]
        at io.netty.handler.codec.ByteToMessageDecoder.fireChannelRead(ByteToMessageDecoder.java:280) [netty-codec-4.1.6.Final.jar:4.1.6.Final]
        at io.netty.handler.codec.ByteToMessageDecoder.callDecode(ByteToMessageDecoder.java:396) [netty-codec-4.1.6.Final.jar:4.1.6.Final]
        at io.netty.handler.codec.ByteToMessageDecoder.channelRead(ByteToMessageDecoder.java:248) [netty-codec-4.1.6.Final.jar:4.1.6.Final]
        at io.netty.channel.AbstractChannelHandlerContext.invokeChannelRead(AbstractChannelHandlerContext.java:373) [netty-transport-4.1.6.Final.jar:4.1.6.Final]
        at io.netty.channel.AbstractChannelHandlerContext.invokeChannelRead(AbstractChannelHandlerContext.java:359) [netty-transport-4.1.6.Final.jar:4.1.6.Final]
        at io.netty.channel.AbstractChannelHandlerContext.fireChannelRead(AbstractChannelHandlerContext.java:351) [netty-transport-4.1.6.Final.jar:4.1.6.Final]
        at io.netty.channel.DefaultChannelPipeline$HeadContext.channelRead(DefaultChannelPipeline.java:1334) [netty-transport-4.1.6.Final.jar:4.1.6.Final]
        at io.netty.channel.AbstractChannelHandlerContext.invokeChannelRead(AbstractChannelHandlerContext.java:373) [netty-transport-4.1.6.Final.jar:4.1.6.Final]
        at io.netty.channel.AbstractChannelHandlerContext.invokeChannelRead(AbstractChannelHandlerContext.java:359) [netty-transport-4.1.6.Final.jar:4.1.6.Final]
        at io.netty.channel.DefaultChannelPipeline.fireChannelRead(DefaultChannelPipeline.java:926) [netty-transport-4.1.6.Final.jar:4.1.6.Final]
        at io.netty.channel.nio.AbstractNioByteChannel$NioByteUnsafe.read(AbstractNioByteChannel.java:129) [netty-transport-4.1.6.Final.jar:4.1.6.Final]
        at io.netty.channel.nio.NioEventLoop.processSelectedKey(NioEventLoop.java:651) [netty-transport-4.1.6.Final.jar:4.1.6.Final]
        at io.netty.channel.nio.NioEventLoop.processSelectedKeysPlain(NioEventLoop.java:536) [netty-transport-4.1.6.Final.jar:4.1.6.Final]
        at io.netty.channel.nio.NioEventLoop.processSelectedKeys(NioEventLoop.java:490) [netty-transport-4.1.6.Final.jar:4.1.6.Final]
        at io.netty.channel.nio.NioEventLoop.run(NioEventLoop.java:450) [netty-transport-4.1.6.Final.jar:4.1.6.Final]
        at io.netty.util.concurrent.SingleThreadEventExecutor$5.run(SingleThreadEventExecutor.java:873) [netty-common-4.1.6.Final.jar:4.1.6.Final]
        at java.lang.Thread.run(Thread.java:745) [?:1.8.0_111-internal]
 OmarDarwish
on 31 Jan 2017
OmarDarwish
on 31 Jan 2017
 nik9000
Using 5.2.1 it seems I'm still having this issue:
Feb 22 10:14:43 pc elasticsearch[10964]: [2017-02-22T10:14:43,374][INFO ][o.e.n.Node               ] [elasticsearch-data] initializing ...
Feb 22 10:14:43 pc elasticsearch[10964]: [2017-02-22T10:14:43,508][INFO ][o.e.e.NodeEnvironment    ] [elasticsearch-data] using [1] data paths, mounts [[/usr/share/elasticsearch/data (datapool/app/data)]], net usable_space [13.5gb], net total_space [14gb], spins? [possibly], types [zfs]
Feb 22 10:14:43 pc elasticsearch[10964]: [2017-02-22T10:14:43,508][INFO ][o.e.e.NodeEnvironment    ] [elasticsearch-data] heap size [1.9gb], compressed ordinary object pointers [true]
Feb 22 10:14:43 pc elasticsearch[10964]: [2017-02-22T10:14:43,587][INFO ][o.e.n.Node               ] [elasticsearch-data] node name [elasticsearch-data], node ID [yXgT_M87STebU13T98U4Dw]
Feb 22 10:14:43 pc elasticsearch[10964]: [2017-02-22T10:14:43,591][INFO ][o.e.n.Node               ] [elasticsearch-data] version[5.2.1], pid[1], build[db0d481/2017-02-09T22:05:32.386Z], OS[Linux/4.4.0-21-generic/amd64], JVM[Oracle Corporation/OpenJDK 64-Bit Server VM/1.8.0_121/25.121-b13]
Feb 22 10:14:47 pc elasticsearch[10964]: [2017-02-22T10:14:47,413][INFO ][o.e.p.PluginsService     ] [elasticsearch-data] loaded module [aggs-matrix-stats]
Feb 22 10:14:47 pc elasticsearch[10964]: [2017-02-22T10:14:47,414][INFO ][o.e.p.PluginsService     ] [elasticsearch-data] loaded module [ingest-common]
Feb 22 10:14:47 pc elasticsearch[10964]: [2017-02-22T10:14:47,414][INFO ][o.e.p.PluginsService     ] [elasticsearch-data] loaded module [lang-expression]
Feb 22 10:14:47 pc elasticsearch[10964]: [2017-02-22T10:14:47,414][INFO ][o.e.p.PluginsService     ] [elasticsearch-data] loaded module [lang-groovy]
Feb 22 10:14:47 pc elasticsearch[10964]: [2017-02-22T10:14:47,414][INFO ][o.e.p.PluginsService     ] [elasticsearch-data] loaded module [lang-mustache]
Feb 22 10:14:47 pc elasticsearch[10964]: [2017-02-22T10:14:47,414][INFO ][o.e.p.PluginsService     ] [elasticsearch-data] loaded module [lang-painless]
Feb 22 10:14:47 pc elasticsearch[10964]: [2017-02-22T10:14:47,414][INFO ][o.e.p.PluginsService     ] [elasticsearch-data] loaded module [percolator]
Feb 22 10:14:47 pc elasticsearch[10964]: [2017-02-22T10:14:47,415][INFO ][o.e.p.PluginsService     ] [elasticsearch-data] loaded module [reindex]
Feb 22 10:14:47 pc elasticsearch[10964]: [2017-02-22T10:14:47,415][INFO ][o.e.p.PluginsService     ] [elasticsearch-data] loaded module [transport-netty3]
Feb 22 10:14:47 pc elasticsearch[10964]: [2017-02-22T10:14:47,415][INFO ][o.e.p.PluginsService     ] [elasticsearch-data] loaded module [transport-netty4]
Feb 22 10:14:47 pc elasticsearch[10964]: [2017-02-22T10:14:47,418][INFO ][o.e.p.PluginsService     ] [elasticsearch-data] no plugins loaded
Feb 22 10:14:47 pc elasticsearch[10964]: [2017-02-22T10:14:47,958][WARN ][o.e.d.s.g.GroovyScriptEngineService] [groovy] scripts are deprecated, use [painless] scripts instead
Feb 22 10:14:52 pc elasticsearch[10964]: [2017-02-22T10:14:52,711][INFO ][o.e.n.Node               ] [elasticsearch-data] initialized
Feb 22 10:14:52 pc elasticsearch[10964]: [2017-02-22T10:14:52,713][INFO ][o.e.n.Node               ] [elasticsearch-data] starting ...
Feb 22 10:14:52 pc elasticsearch[10964]: [2017-02-22T10:14:52,901][WARN ][i.n.u.i.MacAddressUtil   ] Failed to find a usable hardware address from the network interfaces; using random bytes: f3:36:48:59:c3:a6:a0:f5
Feb 22 10:14:53 pc elasticsearch[10964]: [2017-02-22T10:14:53,267][INFO ][o.e.t.TransportService   ] [elasticsearch-data] publish_address {10.0.0.3:9300}, bound_addresses {10.0.0.3:9300}, {172.18.0.4:9300}
Feb 22 10:14:53 pc elasticsearch[10964]: [2017-02-22T10:14:53,284][INFO ][o.e.b.BootstrapChecks    ] [elasticsearch-data] bound or publishing to a non-loopback or non-link-local address, enforcing bootstrap checks
Feb 22 10:14:56 pc elasticsearch[10964]: [2017-02-22T10:14:56,906][INFO ][o.e.c.s.ClusterService   ] [elasticsearch] added {{elasticsearch-data}{yXgT_M87STebU13T98U4Dw}{iVrGLxOWQAmAEmBSvW4WJQ}{10.0.0.3}{10.0.0.3:9300},}, reason: zen-disco-node-join[{elasticsearch-data}{yXgT_M87STebU13T98U4Dw}{iVrGLxOWQAmAEmBSvW4WJQ}{10.0.0.3}{10.0.0.3:9300}]
Feb 22 10:14:57 pc elasticsearch[10964]: [2017-02-22T10:14:57,327][INFO ][o.e.c.s.ClusterService   ] [elasticsearch-data] detected_master {elasticsearch}{pFof7ItCR3Weurx60K77Dw}{pciKrHiiTxuxXsXoy28loQ}{10.0.0.2}{10.0.0.2:9300}, added {{elasticsearch}{pFof7ItCR3Weurx60K77Dw}{pciKrHiiTxuxXsXoy28loQ}{10.0.0.2}{10.0.0.2:9300},}, reason: zen-disco-receive(from master [master {elasticsearch}{pFof7ItCR3Weurx60K77Dw}{pciKrHiiTxuxXsXoy28loQ}{10.0.0.2}{10.0.0.2:9300} committed version [160]])
Feb 22 10:14:58 pc elasticsearch[10964]: [2017-02-22T10:14:58,089][INFO ][o.e.h.HttpServer         ] [elasticsearch-data] publish_address {10.0.0.3:9200}, bound_addresses {10.0.0.3:9200}, {172.18.0.4:9200}
Feb 22 10:14:58 pc elasticsearch[10964]: [2017-02-22T10:14:58,089][INFO ][o.e.n.Node               ] [elasticsearch-data] started
Feb 22 10:14:59 pc elasticsearch[10964]: [2017-02-22T10:14:59,194][DEBUG][o.e.a.a.i.s.TransportIndicesStatsAction] [elasticsearch] failed to execute [indices:monitor/stats] on node [yXgT_M87STebU13T98U4Dw]
Feb 22 10:14:59 pc elasticsearch[10964]: org.elasticsearch.transport.NodeDisconnectedException: [elasticsearch-data][10.0.0.3:9300][indices:monitor/stats[n]] disconnected
Feb 22 10:14:59 pc elasticsearch[10964]: [2017-02-22T10:14:59,199][DEBUG][o.e.a.a.c.n.s.TransportNodesStatsAction] [elasticsearch] failed to execute on node [yXgT_M87STebU13T98U4Dw]
Feb 22 10:14:59 pc elasticsearch[10964]: org.elasticsearch.transport.NodeDisconnectedException: [elasticsearch-data][10.0.0.3:9300][cluster:monitor/nodes/stats[n]] disconnected
Feb 22 10:14:59 pc elasticsearch[10964]: [2017-02-22T10:14:59,201][INFO ][o.e.c.s.ClusterService   ] [elasticsearch] removed {{elasticsearch-data}{yXgT_M87STebU13T98U4Dw}{iVrGLxOWQAmAEmBSvW4WJQ}{10.0.0.3}{10.0.0.3:9300},}, reason: zen-disco-node-failed({elasticsearch-data}{yXgT_M87STebU13T98U4Dw}{iVrGLxOWQAmAEmBSvW4WJQ}{10.0.0.3}{10.0.0.3:9300}), reason(transport disconnected)[{elasticsearch-data}{yXgT_M87STebU13T98U4Dw}{iVrGLxOWQAmAEmBSvW4WJQ}{10.0.0.3}{10.0.0.3:9300} transport disconnected]
Feb 22 10:14:59 pc elasticsearch[10964]: [2017-02-22T10:14:59,200][WARN ][o.e.a.a.c.n.s.TransportNodesStatsAction] [elasticsearch] not accumulating exceptions, excluding exception from response
Feb 22 10:14:59 pc elasticsearch[10964]: org.elasticsearch.action.FailedNodeException: Failed node [yXgT_M87STebU13T98U4Dw]
Feb 22 10:14:59 pc elasticsearch[10964]: #011at org.elasticsearch.action.support.nodes.TransportNodesAction$AsyncAction.onFailure(TransportNodesAction.java:247) ~[elasticsearch-5.2.1.jar:5.2.1]
Feb 22 10:14:59 pc elasticsearch[10964]: #011at org.elasticsearch.action.support.nodes.TransportNodesAction$AsyncAction.access$300(TransportNodesAction.java:160) ~[elasticsearch-5.2.1.jar:5.2.1]
Feb 22 10:14:59 pc elasticsearch[10964]: #011at org.elasticsearch.action.support.nodes.TransportNodesAction$AsyncAction$1.handleException(TransportNodesAction.java:219) ~[elasticsearch-5.2.1.jar:5.2.1]
Feb 22 10:14:59 pc elasticsearch[10964]: #011at org.elasticsearch.transport.TransportService$ContextRestoreResponseHandler.handleException(TransportService.java:1024) ~[elasticsearch-5.2.1.jar:5.2.1]
Feb 22 10:14:59 pc elasticsearch[10964]: #011at org.elasticsearch.transport.TransportService$Adapter.lambda$onNodeDisconnected$6(TransportService.java:851) ~[elasticsearch-5.2.1.jar:5.2.1]
Feb 22 10:14:59 pc elasticsearch[10964]: #011at org.elasticsearch.common.util.concurrent.ThreadContext$ContextPreservingRunnable.run(ThreadContext.java:527) [elasticsearch-5.2.1.jar:5.2.1]
Feb 22 10:14:59 pc elasticsearch[10964]: #011at java.util.concurrent.ThreadPoolExecutor.runWorker(ThreadPoolExecutor.java:1142) [?:1.8.0_121]
Feb 22 10:14:59 pc elasticsearch[10964]: #011at java.util.concurrent.ThreadPoolExecutor$Worker.run(ThreadPoolExecutor.java:617) [?:1.8.0_121]
Feb 22 10:14:59 pc elasticsearch[10964]: #011at java.lang.Thread.run(Thread.java:745) [?:1.8.0_121]
Feb 22 10:14:59 pc elasticsearch[10964]: Caused by: org.elasticsearch.transport.NodeDisconnectedException: [elasticsearch-data][10.0.0.3:9300][cluster:monitor/nodes/stats[n]] disconnected
Feb 22 10:14:59 pc elasticsearch[10964]: [2017-02-22T10:14:59,202][INFO ][o.e.c.r.DelayedAllocationService] [elasticsearch] scheduling reroute for delayed shards in [59.9s] (4 delayed shards)
Is there anything I can do?
 mostolog
on 22 Feb 2017
mostolog
on 22 Feb 2017
@mostolog are you running an older version of ES in your cluster anywhere?
 s1monw
on 22 Feb 2017
s1monw
on 22 Feb 2017
I would say not, but after so many tests I don't know what I tried and what I didn't.
I don't know it could be related, but cerebro was running each time it happened. (I'm trying to get a replication use case)
mostolog
on 22 Feb 2017
@mostolog this request will tell you what versions are running:
curl -XGET "http://localhost:9200/_nodes?pretty&filter_path=nodes.*.version"
(btw, cerebro is the kopf rewrite https://github.com/lmenezes/cerebro so stats related)
 clintongormley
on 22 Feb 2017
clintongormley
on 22 Feb 2017
{
  "nodes" : {
    "G2cl2gwLTQaQUY4Oca5bHg" : {
      "version" : "5.2.1"
    },
    "9L57Rh05QvqXvC9LqsUvSg" : {
      "version" : "5.2.1"
    }
  }
}
@mostolog how can you tell that this is related to stats serialization? I can't see a stacktrace in your case
s1monw
on 22 Feb 2017
Just reproduced a similar error without cerebro or any references to stats, so'll probably have to look elsewhere:
Feb 22 10:49:27 pc elasticsearch[10964]: [2017-02-22T10:49:27,708][INFO ][o.e.c.m.MetaDataCreateIndexService] [elasticsearch] [group:app1@2017-02-22-10] creating index, cause [auto(bulk api)], templates [], shards [5]/[1], mappings []
Feb 22 10:49:31 pc elasticsearch[10964]: [2017-02-22T10:49:30,984][WARN ][o.e.m.j.JvmGcMonitorService] [elasticsearch] [gc][young][356][2] duration [2.7s], collections [1]/[3.1s], total [2.7s]/[2.9s], memory [568.9mb]->[298.8mb]/[1.9gb], all_pools {[young] [521.6mb]->[7.4mb]/[532.5mb]}{[survivor] [47.2mb]->[66.4mb]/[66.5mb]}{[old] [0b]->[228.3mb]/[1.3gb]}
Feb 22 10:49:31 pc elasticsearch[10964]: [2017-02-22T10:49:31,021][WARN ][o.e.m.j.JvmGcMonitorService] [elasticsearch] [gc][356] overhead, spent [2.7s] collecting in the last [3.1s]
Feb 22 10:49:31 pc elasticsearch[10964]: [2017-02-22T10:49:31,079][INFO ][o.e.c.m.MetaDataMappingService] [elasticsearch] [group:app1@2017-02-22-10/NpYVbZxHQuG0far9dfcHsQ] create_mapping [logs]
Feb 22 10:49:31 pc elasticsearch[10964]: [2017-02-22T10:49:31,102][INFO ][o.e.c.m.MetaDataMappingService] [elasticsearch] [group:app1@2017-02-22-10/NpYVbZxHQuG0far9dfcHsQ] update_mapping [logs]
Feb 22 10:49:31 pc elasticsearch[10964]: [2017-02-22T10:49:31,152][INFO ][o.e.c.m.MetaDataMappingService] [elasticsearch] [group:app1@2017-02-22-10/NpYVbZxHQuG0far9dfcHsQ] update_mapping [logs]
Feb 22 10:49:31 pc elasticsearch[10964]: [2017-02-22T10:49:31,755][INFO ][o.e.c.m.MetaDataMappingService] [elasticsearch] [group:app1@2017-02-22-10/NpYVbZxHQuG0far9dfcHsQ] update_mapping [logs]
Feb 22 10:49:32 pc elasticsearch[10964]: [2017-02-22T10:49:32,381][DEBUG][o.e.a.a.i.m.p.TransportPutMappingAction] [elasticsearch-data] connection exception while trying to forward request with action name [indices:admin/mapping/put] to master node [{elasticsearch}{G2cl2gwLTQaQUY4Oca5bHg}{5GA7XQjcTKWJuGAb1wwILg}{10.0.0.2}{10.0.0.2:9300}], scheduling a retry. Error: [org.elasticsearch.transport.NodeDisconnectedException: [elasticsearch][10.0.0.2:9300][indices:admin/mapping/put] disconnected]
Feb 22 10:49:32 pc elasticsearch[10964]: [2017-02-22T10:49:32,381][DEBUG][o.e.a.a.i.m.p.TransportPutMappingAction] [elasticsearch-data] connection exception while trying to forward request with action name [indices:admin/mapping/put] to master node [{elasticsearch}{G2cl2gwLTQaQUY4Oca5bHg}{5GA7XQjcTKWJuGAb1wwILg}{10.0.0.2}{10.0.0.2:9300}], scheduling a retry. Error: [org.elasticsearch.transport.NodeDisconnectedException: [elasticsearch][10.0.0.2:9300][indices:admin/mapping/put] disconnected]
Feb 22 10:49:32 pc elasticsearch[10964]: [2017-02-22T10:49:32,432][DEBUG][o.e.a.a.i.m.p.TransportPutMappingAction] [elasticsearch-data] connection exception while trying to forward request with action name [indices:admin/mapping/put] to master node [{elasticsearch}{G2cl2gwLTQaQUY4Oca5bHg}{5GA7XQjcTKWJuGAb1wwILg}{10.0.0.2}{10.0.0.2:9300}], scheduling a retry. Error: [org.elasticsearch.transport.NodeNotConnectedException: [elasticsearch][10.0.0.2:9300] Node not connected]
Feb 22 10:49:32 pc elasticsearch[10964]: [2017-02-22T10:49:32,432][DEBUG][o.e.a.a.i.m.p.TransportPutMappingAction] [elasticsearch-data] connection exception while trying to forward request with action name [indices:admin/mapping/put] to master node [{elasticsearch}{G2cl2gwLTQaQUY4Oca5bHg}{5GA7XQjcTKWJuGAb1wwILg}{10.0.0.2}{10.0.0.2:9300}], scheduling a retry. Error: [org.elasticsearch.transport.NodeNotConnectedException: [elasticsearch][10.0.0.2:9300] Node not connected]
Feb 22 10:49:32 pc elasticsearch[10964]: [2017-02-22T10:49:32,435][DEBUG][o.e.a.a.i.m.p.TransportPutMappingAction] [elasticsearch-data] connection exception while trying to forward request with action name [indices:admin/mapping/put] to master node [{elasticsearch}{G2cl2gwLTQaQUY4Oca5bHg}{5GA7XQjcTKWJuGAb1wwILg}{10.0.0.2}{10.0.0.2:9300}], scheduling a retry. Error: [org.elasticsearch.transport.NodeNotConnectedException: [elasticsearch][10.0.0.2:9300] Node not connected]
Feb 22 10:49:32 pc elasticsearch[10964]: [2017-02-22T10:49:32,454][INFO ][o.e.d.z.ZenDiscovery     ] [elasticsearch-data] master_left [{elasticsearch}{G2cl2gwLTQaQUY4Oca5bHg}{5GA7XQjcTKWJuGAb1wwILg}{10.0.0.2}{10.0.0.2:9300}], reason [transport disconnected]
Feb 22 10:49:32 pc elasticsearch[10964]: [2017-02-22T10:49:32,456][WARN ][o.e.d.z.ZenDiscovery     ] [elasticsearch-data] master left (reason = transport disconnected), current nodes: nodes:
Feb 22 10:49:32 pc elasticsearch[10964]:    {elasticsearch}{G2cl2gwLTQaQUY4Oca5bHg}{5GA7XQjcTKWJuGAb1wwILg}{10.0.0.2}{10.0.0.2:9300}, master
Feb 22 10:49:32 pc elasticsearch[10964]:    {elasticsearch-data}{9L57Rh05QvqXvC9LqsUvSg}{-WGBky5yQt2VC1ngcoy89g}{10.0.0.3}{10.0.0.3:9300}, local
Feb 22 10:49:32 pc elasticsearch[10964]:
Feb 22 10:49:35 pc elasticsearch[10964]: [2017-02-22T10:49:35,625][WARN ][o.e.m.j.JvmGcMonitorService] [elasticsearch-data] [gc][young][336][2] duration [3.1s], collections [1]/[3.5s], total [3.1s]/[3.2s], memory [558.4mb]->[312.1mb]/[1.9gb], all_pools {[young] [511.1mb]->[4.7mb]/[532.5mb]}{[survivor] [47.2mb]->[66.5mb]/[66.5mb]}{[old] [0b]->[244.3mb]/[1.3gb]}
Feb 22 10:49:35 pc elasticsearch[10964]: [2017-02-22T10:49:35,632][WARN ][o.e.m.j.JvmGcMonitorService] [elasticsearch-data] [gc][336] overhead, spent [3.1s] collecting in the last [3.5s]
Feb 22 10:49:35 pc elasticsearch[10964]: [2017-02-22T10:49:35,658][WARN ][o.e.c.NodeConnectionsService] [elasticsearch-data] failed to connect to node {elasticsearch}{G2cl2gwLTQaQUY4Oca5bHg}{5GA7XQjcTKWJuGAb1wwILg}{10.0.0.2}{10.0.0.2:9300} (tried [1] times)
Feb 22 10:49:35 pc elasticsearch[10964]: org.elasticsearch.transport.ConnectTransportException: [elasticsearch][10.0.0.2:9300] connect_timeout[30s]
Feb 22 10:49:35 pc elasticsearch[10964]: #011at org.elasticsearch.transport.netty4.Netty4Transport.connectToChannels(Netty4Transport.java:370) ~[?:?]
Feb 22 10:49:35 pc elasticsearch[10964]: #011at org.elasticsearch.transport.TcpTransport.openConnection(TcpTransport.java:495) ~[elasticsearch-5.2.1.jar:5.2.1]
Feb 22 10:49:35 pc elasticsearch[10964]: #011at org.elasticsearch.transport.TcpTransport.connectToNode(TcpTransport.java:460) ~[elasticsearch-5.2.1.jar:5.2.1]
Feb 22 10:49:35 pc elasticsearch[10964]: #011at org.elasticsearch.transport.TransportService.connectToNode(TransportService.java:318) ~[elasticsearch-5.2.1.jar:5.2.1]
Feb 22 10:49:35 pc elasticsearch[10964]: #011at org.elasticsearch.transport.TransportService.connectToNode(TransportService.java:305) ~[elasticsearch-5.2.1.jar:5.2.1]
Feb 22 10:49:35 pc elasticsearch[10964]: #011at org.elasticsearch.cluster.NodeConnectionsService.validateNodeConnected(NodeConnectionsService.java:121) [elasticsearch-5.2.1.jar:5.2.1]
Feb 22 10:49:35 pc elasticsearch[10964]: #011at org.elasticsearch.cluster.NodeConnectionsService.connectToNodes(NodeConnectionsService.java:87) [elasticsearch-5.2.1.jar:5.2.1]
Feb 22 10:49:35 pc elasticsearch[10964]: #011at org.elasticsearch.cluster.service.ClusterService.publishAndApplyChanges(ClusterService.java:775) [elasticsearch-5.2.1.jar:5.2.1]
Feb 22 10:49:35 pc elasticsearch[10964]: #011at org.elasticsearch.cluster.service.ClusterService.runTasks(ClusterService.java:628) [elasticsearch-5.2.1.jar:5.2.1]
Feb 22 10:49:35 pc elasticsearch[10964]: #011at org.elasticsearch.cluster.service.ClusterService$UpdateTask.run(ClusterService.java:1112) [elasticsearch-5.2.1.jar:5.2.1]
Feb 22 10:49:35 pc elasticsearch[10964]: #011at org.elasticsearch.common.util.concurrent.ThreadContext$ContextPreservingRunnable.run(ThreadContext.java:527) [elasticsearch-5.2.1.jar:5.2.1]
Feb 22 10:49:35 pc elasticsearch[10964]: #011at org.elasticsearch.common.util.concurrent.PrioritizedEsThreadPoolExecutor$TieBreakingPrioritizedRunnable.runAndClean(PrioritizedEsThreadPoolExecutor.java:238) [elasticsearch-5.2.1.jar:5.2.1]
Feb 22 10:49:35 pc elasticsearch[10964]: #011at org.elasticsearch.common.util.concurrent.PrioritizedEsThreadPoolExecutor$TieBreakingPrioritizedRunnable.run(PrioritizedEsThreadPoolExecutor.java:201) [elasticsearch-5.2.1.jar:5.2.1]
Feb 22 10:49:35 pc elasticsearch[10964]: #011at java.util.concurrent.ThreadPoolExecutor.runWorker(ThreadPoolExecutor.java:1142) [?:1.8.0_121]
Feb 22 10:49:35 pc elasticsearch[10964]: #011at java.util.concurrent.ThreadPoolExecutor$Worker.run(ThreadPoolExecutor.java:617) [?:1.8.0_121]
Feb 22 10:49:35 pc elasticsearch[10964]: #011at java.lang.Thread.run(Thread.java:745) [?:1.8.0_121]
Feb 22 10:49:35 pc elasticsearch[10964]: Caused by: io.netty.channel.AbstractChannel$AnnotatedConnectException: Connection refused: 10.0.0.2/10.0.0.2:9300
Feb 22 10:49:35 pc elasticsearch[10964]: #011at sun.nio.ch.SocketChannelImpl.checkConnect(Native Method) ~[?:?]
Feb 22 10:49:35 pc elasticsearch[10964]: #011at sun.nio.ch.SocketChannelImpl.finishConnect(SocketChannelImpl.java:717) ~[?:?]
Feb 22 10:49:35 pc elasticsearch[10964]: #011at io.netty.channel.socket.nio.NioSocketChannel.doFinishConnect(NioSocketChannel.java:346) ~[?:?]
Feb 22 10:49:35 pc elasticsearch[10964]: #011at io.netty.channel.nio.AbstractNioChannel$AbstractNioUnsafe.finishConnect(AbstractNioChannel.java:340) ~[?:?]
Feb 22 10:49:35 pc elasticsearch[10964]: #011at io.netty.channel.nio.NioEventLoop.processSelectedKey(NioEventLoop.java:630) ~[?:?]
Feb 22 10:49:35 pc elasticsearch[10964]: #011at io.netty.channel.nio.NioEventLoop.processSelectedKeysPlain(NioEventLoop.java:527) ~[?:?]
Feb 22 10:49:35 pc elasticsearch[10964]: #011at io.netty.channel.nio.NioEventLoop.processSelectedKeys(NioEventLoop.java:481) ~[?:?]
Feb 22 10:49:35 pc elasticsearch[10964]: #011at io.netty.channel.nio.NioEventLoop.run(NioEventLoop.java:441) ~[?:?]
Feb 22 10:49:35 pc elasticsearch[10964]: #011at io.netty.util.concurrent.SingleThreadEventExecutor$5.run(SingleThreadEventExecutor.java:858) ~[?:?]
Feb 22 10:49:35 pc elasticsearch[10964]: #011... 1 more
Feb 22 10:49:38 pc elasticsearch[10964]: [2017-02-22T10:49:38,149][INFO ][o.e.n.Node               ] [elasticsearch] initializing ...
Feb 22 10:49:38 pc elasticsearch[10964]: [2017-02-22T10:49:38,258][INFO ][o.e.e.NodeEnvironment    ] [elasticsearch] using [1] data paths, mounts [[/usr/share/elasticsearch/data (/dev/mapper/Disk1-root)]], net usable_space [2.4gb], net total_space [8.3gb], spins? [possibly], types [ext4]
Feb 22 10:49:38 pc elasticsearch[10964]: [2017-02-22T10:49:38,259][INFO ][o.e.e.NodeEnvironment    ] [elasticsearch] heap size [1.9gb], compressed ordinary object pointers [true]
Feb 22 10:49:38 pc elasticsearch[10964]: [2017-02-22T10:49:38,269][INFO ][o.e.n.Node               ] [elasticsearch] node name [elasticsearch], node ID [G2cl2gwLTQaQUY4Oca5bHg]
Feb 22 10:49:38 pc elasticsearch[10964]: [2017-02-22T10:49:38,271][INFO ][o.e.n.Node               ] [elasticsearch] version[5.2.1], pid[1], build[db0d481/2017-02-09T22:05:32.386Z], OS[Linux/4.4.0-21-generic/amd64], JVM[Oracle Corporation/OpenJDK 64-Bit Server VM/1.8.0_121/25.121-b13]
...
Feb 22 10:49:27 pc elasticsearch[10964]: [2017-02-22T10:49:27,708][INFO ][o.e.c.m.MetaDataCreateIndexService] [elasticsearch] [group:app1@2017-02-22-10] creating index, cause [auto(bulk api)], templates [], shards [5]/[1], mappings []
Feb 22 10:49:31 pc elasticsearch[10964]: [2017-02-22T10:49:30,984][WARN ][o.e.m.j.JvmGcMonitorService] [elasticsearch] [gc][young][356][2] duration [2.7s], collections [1]/[3.1s], total [2.7s]/[2.9s], memory [568.9mb]->[298.8mb]/[1.9gb], all_pools {[young] [521.6mb]->[7.4mb]/[532.5mb]}{[survivor] [47.2mb]->[66.4mb]/[66.5mb]}{[old] [0b]->[228.3mb]/[1.3gb]}
Feb 22 10:49:31 pc elasticsearch[10964]: [2017-02-22T10:49:31,021][WARN ][o.e.m.j.JvmGcMonitorService] [elasticsearch] [gc][356] overhead, spent [2.7s] collecting in the last [3.1s]
Feb 22 10:49:31 pc elasticsearch[10964]: [2017-02-22T10:49:31,079][INFO ][o.e.c.m.MetaDataMappingService] [elasticsearch] [group:app1@2017-02-22-10/NpYVbZxHQuG0far9dfcHsQ] create_mapping [logs]
Feb 22 10:49:31 pc elasticsearch[10964]: [2017-02-22T10:49:31,102][INFO ][o.e.c.m.MetaDataMappingService] [elasticsearch] [group:app1@2017-02-22-10/NpYVbZxHQuG0far9dfcHsQ] update_mapping [logs]
Feb 22 10:49:31 pc elasticsearch[10964]: [2017-02-22T10:49:31,152][INFO ][o.e.c.m.MetaDataMappingService] [elasticsearch] [group:app1@2017-02-22-10/NpYVbZxHQuG0far9dfcHsQ] update_mapping [logs]
Feb 22 10:49:31 pc elasticsearch[10964]: [2017-02-22T10:49:31,755][INFO ][o.e.c.m.MetaDataMappingService] [elasticsearch] [group:app1@2017-02-22-10/NpYVbZxHQuG0far9dfcHsQ] update_mapping [logs]
Feb 22 10:49:32 pc elasticsearch[10964]: [2017-02-22T10:49:32,381][DEBUG][o.e.a.a.i.m.p.TransportPutMappingAction] [elasticsearch-data] connection exception while trying to forward request with action name [indices:admin/mapping/put] to master node [{elasticsearch}{G2cl2gwLTQaQUY4Oca5bHg}{5GA7XQjcTKWJuGAb1wwILg}{10.0.0.2}{10.0.0.2:9300}], scheduling a retry. Error: [org.elasticsearch.transport.NodeDisconnectedException: [elasticsearch][10.0.0.2:9300][indices:admin/mapping/put] disconnected]
Feb 22 10:49:32 pc elasticsearch[10964]: [2017-02-22T10:49:32,381][DEBUG][o.e.a.a.i.m.p.TransportPutMappingAction] [elasticsearch-data] connection exception while trying to forward request with action name [indices:admin/mapping/put] to master node [{elasticsearch}{G2cl2gwLTQaQUY4Oca5bHg}{5GA7XQjcTKWJuGAb1wwILg}{10.0.0.2}{10.0.0.2:9300}], scheduling a retry. Error: [org.elasticsearch.transport.NodeDisconnectedException: [elasticsearch][10.0.0.2:9300][indices:admin/mapping/put] disconnected]
Feb 22 10:49:32 pc elasticsearch[10964]: [2017-02-22T10:49:32,432][DEBUG][o.e.a.a.i.m.p.TransportPutMappingAction] [elasticsearch-data] connection exception while trying to forward request with action name [indices:admin/mapping/put] to master node [{elasticsearch}{G2cl2gwLTQaQUY4Oca5bHg}{5GA7XQjcTKWJuGAb1wwILg}{10.0.0.2}{10.0.0.2:9300}], scheduling a retry. Error: [org.elasticsearch.transport.NodeNotConnectedException: [elasticsearch][10.0.0.2:9300] Node not connected]
Feb 22 10:49:32 pc elasticsearch[10964]: [2017-02-22T10:49:32,432][DEBUG][o.e.a.a.i.m.p.TransportPutMappingAction] [elasticsearch-data] connection exception while trying to forward request with action name [indices:admin/mapping/put] to master node [{elasticsearch}{G2cl2gwLTQaQUY4Oca5bHg}{5GA7XQjcTKWJuGAb1wwILg}{10.0.0.2}{10.0.0.2:9300}], scheduling a retry. Error: [org.elasticsearch.transport.NodeNotConnectedException: [elasticsearch][10.0.0.2:9300] Node not connected]
Feb 22 10:49:32 pc elasticsearch[10964]: [2017-02-22T10:49:32,435][DEBUG][o.e.a.a.i.m.p.TransportPutMappingAction] [elasticsearch-data] connection exception while trying to forward request with action name [indices:admin/mapping/put] to master node [{elasticsearch}{G2cl2gwLTQaQUY4Oca5bHg}{5GA7XQjcTKWJuGAb1wwILg}{10.0.0.2}{10.0.0.2:9300}], scheduling a retry. Error: [org.elasticsearch.transport.NodeNotConnectedException: [elasticsearch][10.0.0.2:9300] Node not connected]
Feb 22 10:49:32 pc elasticsearch[10964]: [2017-02-22T10:49:32,454][INFO ][o.e.d.z.ZenDiscovery     ] [elasticsearch-data] master_left [{elasticsearch}{G2cl2gwLTQaQUY4Oca5bHg}{5GA7XQjcTKWJuGAb1wwILg}{10.0.0.2}{10.0.0.2:9300}], reason [transport disconnected]
Feb 22 10:49:32 pc elasticsearch[10964]: [2017-02-22T10:49:32,456][WARN ][o.e.d.z.ZenDiscovery     ] [elasticsearch-data] master left (reason = transport disconnected), current nodes: nodes:
Feb 22 10:49:32 pc elasticsearch[10964]:    {elasticsearch}{G2cl2gwLTQaQUY4Oca5bHg}{5GA7XQjcTKWJuGAb1wwILg}{10.0.0.2}{10.0.0.2:9300}, master
Feb 22 10:49:32 pc elasticsearch[10964]:    {elasticsearch-data}{9L57Rh05QvqXvC9LqsUvSg}{-WGBky5yQt2VC1ngcoy89g}{10.0.0.3}{10.0.0.3:9300}, local
Feb 22 10:49:32 pc elasticsearch[10964]:
Feb 22 10:49:35 pc elasticsearch[10964]: [2017-02-22T10:49:35,625][WARN ][o.e.m.j.JvmGcMonitorService] [elasticsearch-data] [gc][young][336][2] duration [3.1s], collections [1]/[3.5s], total [3.1s]/[3.2s], memory [558.4mb]->[312.1mb]/[1.9gb], all_pools {[young] [511.1mb]->[4.7mb]/[532.5mb]}{[survivor] [47.2mb]->[66.5mb]/[66.5mb]}{[old] [0b]->[244.3mb]/[1.3gb]}
Feb 22 10:49:35 pc elasticsearch[10964]: [2017-02-22T10:49:35,632][WARN ][o.e.m.j.JvmGcMonitorService] [elasticsearch-data] [gc][336] overhead, spent [3.1s] collecting in the last [3.5s]
Feb 22 10:49:35 pc elasticsearch[10964]: [2017-02-22T10:49:35,658][WARN ][o.e.c.NodeConnectionsService] [elasticsearch-data] failed to connect to node {elasticsearch}{G2cl2gwLTQaQUY4Oca5bHg}{5GA7XQjcTKWJuGAb1wwILg}{10.0.0.2}{10.0.0.2:9300} (tried [1] times)
Feb 22 10:49:35 pc elasticsearch[10964]: org.elasticsearch.transport.ConnectTransportException: [elasticsearch][10.0.0.2:9300] connect_timeout[30s]
Feb 22 10:49:35 pc elasticsearch[10964]: #011at org.elasticsearch.transport.netty4.Netty4Transport.connectToChannels(Netty4Transport.java:370) ~[?:?]
Feb 22 10:49:35 pc elasticsearch[10964]: #011at org.elasticsearch.transport.TcpTransport.openConnection(TcpTransport.java:495) ~[elasticsearch-5.2.1.jar:5.2.1]
Feb 22 10:49:35 pc elasticsearch[10964]: #011at org.elasticsearch.transport.TcpTransport.connectToNode(TcpTransport.java:460) ~[elasticsearch-5.2.1.jar:5.2.1]
Feb 22 10:49:35 pc elasticsearch[10964]: #011at org.elasticsearch.transport.TransportService.connectToNode(TransportService.java:318) ~[elasticsearch-5.2.1.jar:5.2.1]
Feb 22 10:49:35 pc elasticsearch[10964]: #011at org.elasticsearch.transport.TransportService.connectToNode(TransportService.java:305) ~[elasticsearch-5.2.1.jar:5.2.1]
Feb 22 10:49:35 pc elasticsearch[10964]: #011at org.elasticsearch.cluster.NodeConnectionsService.validateNodeConnected(NodeConnectionsService.java:121) [elasticsearch-5.2.1.jar:5.2.1]
Feb 22 10:49:35 pc elasticsearch[10964]: #011at org.elasticsearch.cluster.NodeConnectionsService.connectToNodes(NodeConnectionsService.java:87) [elasticsearch-5.2.1.jar:5.2.1]
Feb 22 10:49:35 pc elasticsearch[10964]: #011at org.elasticsearch.cluster.service.ClusterService.publishAndApplyChanges(ClusterService.java:775) [elasticsearch-5.2.1.jar:5.2.1]
Feb 22 10:49:35 pc elasticsearch[10964]: #011at org.elasticsearch.cluster.service.ClusterService.runTasks(ClusterService.java:628) [elasticsearch-5.2.1.jar:5.2.1]
Feb 22 10:49:35 pc elasticsearch[10964]: #011at org.elasticsearch.cluster.service.ClusterService$UpdateTask.run(ClusterService.java:1112) [elasticsearch-5.2.1.jar:5.2.1]
Feb 22 10:49:35 pc elasticsearch[10964]: #011at org.elasticsearch.common.util.concurrent.ThreadContext$ContextPreservingRunnable.run(ThreadContext.java:527) [elasticsearch-5.2.1.jar:5.2.1]
Feb 22 10:49:35 pc elasticsearch[10964]: #011at org.elasticsearch.common.util.concurrent.PrioritizedEsThreadPoolExecutor$TieBreakingPrioritizedRunnable.runAndClean(PrioritizedEsThreadPoolExecutor.java:238) [elasticsearch-5.2.1.jar:5.2.1]
Feb 22 10:49:35 pc elasticsearch[10964]: #011at org.elasticsearch.common.util.concurrent.PrioritizedEsThreadPoolExecutor$TieBreakingPrioritizedRunnable.run(PrioritizedEsThreadPoolExecutor.java:201) [elasticsearch-5.2.1.jar:5.2.1]
Feb 22 10:49:35 pc elasticsearch[10964]: #011at java.util.concurrent.ThreadPoolExecutor.runWorker(ThreadPoolExecutor.java:1142) [?:1.8.0_121]
Feb 22 10:49:35 pc elasticsearch[10964]: #011at java.util.concurrent.ThreadPoolExecutor$Worker.run(ThreadPoolExecutor.java:617) [?:1.8.0_121]
Feb 22 10:49:35 pc elasticsearch[10964]: #011at java.lang.Thread.run(Thread.java:745) [?:1.8.0_121]
Feb 22 10:49:35 pc elasticsearch[10964]: Caused by: io.netty.channel.AbstractChannel$AnnotatedConnectException: Connection refused: 10.0.0.2/10.0.0.2:9300
Feb 22 10:49:35 pc elasticsearch[10964]: #011at sun.nio.ch.SocketChannelImpl.checkConnect(Native Method) ~[?:?]
Feb 22 10:49:35 pc elasticsearch[10964]: #011at sun.nio.ch.SocketChannelImpl.finishConnect(SocketChannelImpl.java:717) ~[?:?]
Feb 22 10:49:35 pc elasticsearch[10964]: #011at io.netty.channel.socket.nio.NioSocketChannel.doFinishConnect(NioSocketChannel.java:346) ~[?:?]
Feb 22 10:49:35 pc elasticsearch[10964]: #011at io.netty.channel.nio.AbstractNioChannel$AbstractNioUnsafe.finishConnect(AbstractNioChannel.java:340) ~[?:?]
Feb 22 10:49:35 pc elasticsearch[10964]: #011at io.netty.channel.nio.NioEventLoop.processSelectedKey(NioEventLoop.java:630) ~[?:?]
Feb 22 10:49:35 pc elasticsearch[10964]: #011at io.netty.channel.nio.NioEventLoop.processSelectedKeysPlain(NioEventLoop.java:527) ~[?:?]
Feb 22 10:49:35 pc elasticsearch[10964]: #011at io.netty.channel.nio.NioEventLoop.processSelectedKeys(NioEventLoop.java:481) ~[?:?]
Feb 22 10:49:35 pc elasticsearch[10964]: #011at io.netty.channel.nio.NioEventLoop.run(NioEventLoop.java:441) ~[?:?]
Feb 22 10:49:35 pc elasticsearch[10964]: #011at io.netty.util.concurrent.SingleThreadEventExecutor$5.run(SingleThreadEventExecutor.java:858) ~[?:?]
Feb 22 10:49:35 pc elasticsearch[10964]: #011... 1 more
Feb 22 10:49:38 pc elasticsearch[10964]: [2017-02-22T10:49:38,149][INFO ][o.e.n.Node               ] [elasticsearch] initializing ...
Feb 22 10:49:38 pc elasticsearch[10964]: [2017-02-22T10:49:38,258][INFO ][o.e.e.NodeEnvironment    ] [elasticsearch] using [1] data paths, mounts [[/usr/share/elasticsearch/data (/dev/mapper/Disk1-root)]], net usable_space [2.4gb], net total_space [8.3gb], spins? [possibly], types [ext4]
Feb 22 10:49:38 pc elasticsearch[10964]: [2017-02-22T10:49:38,259][INFO ][o.e.e.NodeEnvironment    ] [elasticsearch] heap size [1.9gb], compressed ordinary object pointers [true]
Feb 22 10:49:38 pc elasticsearch[10964]: [2017-02-22T10:49:38,269][INFO ][o.e.n.Node               ] [elasticsearch] node name [elasticsearch], node ID [G2cl2gwLTQaQUY4Oca5bHg]
Feb 22 10:49:38 pc elasticsearch[10964]: [2017-02-22T10:49:38,271][INFO ][o.e.n.Node               ] [elasticsearch] version[5.2.1], pid[1], build[db0d481/2017-02-09T22:05:32.386Z], OS[Linux/4.4.0-21-generic/amd64], JVM[Oracle Corporation/OpenJDK 64-Bit Server VM/1.8.0_121/25.121-b13]
does it sound familiar to you?
@s1monw among other things, the first to complain was cerebro.
Thanks and sorry for rebumping
mostolog
on 22 Feb 2017
@mostolog I think that your node is GCing and that's leading to disconnects and timeouts:
Feb 22 10:49:31 pc elasticsearch[10964]: [2017-02-22T10:49:30,984][WARN ][o.e.m.j.JvmGcMonitorService] [elasticsearch] [gc][young][356][2] duration [2.7s], collections [1]/[3.1s], total [2.7s]/[2.9s], memory [568.9mb]->[298.8mb]/[1.9gb], all_pools {[young] [521.6mb]->[7.4mb]/[532.5mb]}{[survivor] [47.2mb]->[66.4mb]/[66.5mb]}{[old] [0b]->[228.3mb]/[1.3gb]}
Feb 22 10:49:31 pc elasticsearch[10964]: [2017-02-22T10:49:31,021][WARN ][o.e.m.j.JvmGcMonitorService] [elasticsearch] [gc][356] overhead, spent [2.7s] collecting in the last [3.1s]
@jasontedor Any way to avoid GC having such an effect on my node?
mostolog
on 23 Feb 2017
@mostolog please use the forum for questions like this. Your issue is unrelated to this.
s1monw
on 23 Feb 2017
Shouldn't this bug NOT have tag 5.1.1?
 astefan
on 10 Apr 2017
astefan
on 10 Apr 2017
Shouldn't this bug NOT have tag 5.1.1?
Why do you say that @astefan? If you're looking for the versions that the issue is fixed in, you have to look at the labels on the corresponding PR: #22317.
jasontedor
on 10 Apr 2017
I thought the labels on the GH issue show the fixed versions, not the affected ones?... I may be though remembering wrong :-).
astefan
on 10 Apr 2017
I thought the labels on the GH issue show the fixed versions, not the affected ones?... I may be though remembering wrong :-).
The version labels on corresponding PRs mean that.
jasontedor
on 10 Apr 2017
do you have the plan to fix this problem in version 2.4.5 @jasontedor @nik9000
we see this bug in our es cluster with version 2.4.5。


 hjxhjh
on 24 Nov 2017
hjxhjh
on 24 Nov 2017
@hjxhjh As I explained yesterday, this bug is not present in 2.x and the 2.x series is no longer under maintenance.
What you are seeing in your cluster has the same symptoms as the bug here, but I assure you that the cause is not the same, it's a different bug. In the same way that you can be vomiting (the symptom) because of the flu (a bug), or because of something you ate (another bug), seeing the same symptoms does not mean the cause is the same.
However, we will not be putting any time into investigating this bug, nor will be releasing a fix for this bug: the 2.x series is no longer under maintenance.
jasontedor
on 24 Nov 2017
got it. thank you @jasontedor .
hjxhjh
on 26 Nov 2017
See pretty the same stacktrace in ElasticSearch v6.1.2, could you look into it the same issue or not?
[2018-09-02T16:11:59,836][WARN ][o.e.t.n.Netty4Transport  ] [*******] exception caught on transport layer [org.elasticsearch.transport.netty4.NettyTcpChannel@1a394567], closing connection
java.lang.IllegalStateException: Message not fully read (response) for requestId [1096618678], handler [org.elasticsearch.transport.TransportService$ContextRestoreResponseHandler/org.elasticsearch.action.support.nodes.TransportNodesAction$AsyncAction$1@1d96eb45], error [false]; resetting
    at org.elasticsearch.transport.TcpTransport.messageReceived(TcpTransport.java:1405) ~[elasticsearch-6.1.2.jar:6.1.2]
    at org.elasticsearch.transport.netty4.Netty4MessageChannelHandler.channelRead(Netty4MessageChannelHandler.java:64) ~[transport-netty4-6.1.2.jar:6.1.2]
    at io.netty.channel.AbstractChannelHandlerContext.invokeChannelRead(AbstractChannelHandlerContext.java:362) [netty-transport-4.1.13.Final.jar:4.1.13.Final]
    at io.netty.channel.AbstractChannelHandlerContext.invokeChannelRead(AbstractChannelHandlerContext.java:348) [netty-transport-4.1.13.Final.jar:4.1.13.Final]
    at io.netty.channel.AbstractChannelHandlerContext.fireChannelRead(AbstractChannelHandlerContext.java:340) [netty-transport-4.1.13.Final.jar:4.1.13.Final]
    at io.netty.handler.codec.ByteToMessageDecoder.fireChannelRead(ByteToMessageDecoder.java:310) [netty-codec-4.1.13.Final.jar:4.1.13.Final]
    at io.netty.handler.codec.ByteToMessageDecoder.fireChannelRead(ByteToMessageDecoder.java:297) [netty-codec-4.1.13.Final.jar:4.1.13.Final]
    at io.netty.handler.codec.ByteToMessageDecoder.callDecode(ByteToMessageDecoder.java:413) [netty-codec-4.1.13.Final.jar:4.1.13.Final]
    at io.netty.handler.codec.ByteToMessageDecoder.channelRead(ByteToMessageDecoder.java:265) [netty-codec-4.1.13.Final.jar:4.1.13.Final]
    at io.netty.channel.AbstractChannelHandlerContext.invokeChannelRead(AbstractChannelHandlerContext.java:362) [netty-transport-4.1.13.Final.jar:4.1.13.Final]
    at io.netty.channel.AbstractChannelHandlerContext.invokeChannelRead(AbstractChannelHandlerContext.java:348) [netty-transport-4.1.13.Final.jar:4.1.13.Final]
    at io.netty.channel.AbstractChannelHandlerContext.fireChannelRead(AbstractChannelHandlerContext.java:340) [netty-transport-4.1.13.Final.jar:4.1.13.Final]
    at io.netty.handler.logging.LoggingHandler.channelRead(LoggingHandler.java:241) [netty-handler-4.1.13.Final.jar:4.1.13.Final]
    at io.netty.channel.AbstractChannelHandlerContext.invokeChannelRead(AbstractChannelHandlerContext.java:362) [netty-transport-4.1.13.Final.jar:4.1.13.Final]
    at io.netty.channel.AbstractChannelHandlerContext.invokeChannelRead(AbstractChannelHandlerContext.java:348) [netty-transport-4.1.13.Final.jar:4.1.13.Final]
    at io.netty.channel.AbstractChannelHandlerContext.fireChannelRead(AbstractChannelHandlerContext.java:340) [netty-transport-4.1.13.Final.jar:4.1.13.Final]
    at io.netty.channel.DefaultChannelPipeline$HeadContext.channelRead(DefaultChannelPipeline.java:1334) [netty-transport-4.1.13.Final.jar:4.1.13.Final]
    at io.netty.channel.AbstractChannelHandlerContext.invokeChannelRead(AbstractChannelHandlerContext.java:362) [netty-transport-4.1.13.Final.jar:4.1.13.Final]
    at io.netty.channel.AbstractChannelHandlerContext.invokeChannelRead(AbstractChannelHandlerContext.java:348) [netty-transport-4.1.13.Final.jar:4.1.13.Final]
    at io.netty.channel.DefaultChannelPipeline.fireChannelRead(DefaultChannelPipeline.java:926) [netty-transport-4.1.13.Final.jar:4.1.13.Final]
    at io.netty.channel.nio.AbstractNioByteChannel$NioByteUnsafe.read(AbstractNioByteChannel.java:134) [netty-transport-4.1.13.Final.jar:4.1.13.Final]
    at io.netty.channel.nio.NioEventLoop.processSelectedKey(NioEventLoop.java:644) [netty-transport-4.1.13.Final.jar:4.1.13.Final]
    at io.netty.channel.nio.NioEventLoop.processSelectedKeysPlain(NioEventLoop.java:544) [netty-transport-4.1.13.Final.jar:4.1.13.Final]
    at io.netty.channel.nio.NioEventLoop.processSelectedKeys(NioEventLoop.java:498) [netty-transport-4.1.13.Final.jar:4.1.13.Final]
    at io.netty.channel.nio.NioEventLoop.run(NioEventLoop.java:458) [netty-transport-4.1.13.Final.jar:4.1.13.Final]
    at io.netty.util.concurrent.SingleThreadEventExecutor$5.run(SingleThreadEventExecutor.java:858) [netty-common-4.1.13.Final.jar:4.1.13.Final]
    at java.lang.Thread.run(Thread.java:748) [?:1.8.0_161]
 msurta
on 6 Sep 2018
msurta
on 6 Sep 2018
Related issues
 makeyang
·
3Comments
clintongormley
·
3Comments
makeyang
·
3Comments
clintongormley
·
3Comments
 ttaranov
·
3Comments
ttaranov
·
3Comments
 DhairyashilBhosale
·
3Comments
DhairyashilBhosale
·
3Comments
 dadoonet
·
3Comments
dadoonet
·
3Comments
Most helpful comment
Upgrade to 5.1.2 or 5.2.0 which both have the fix.