Elasticsearch-net: Slower Elasticsearch on .Net Core
NEST/Elasticsearch.Net version:
5.4.0
Elasticsearch version:
5.2.2
Description of the problem including expected versus actual behavior:
We just updated to .Net core 1.1.1 in production. We run our servers in Debian 8.
Our ElasticClient is a singleton for our application. We notice an increase of +120% of the time it takes for the same queries we used to have on .NET Framework 4.5.
For our application, we build a raw elasticsearch string, and we query it like so :
public IEnumerable<T> RawQuery(string query, int limit, params string[] fields)
{
    var client = ElasticsearchConnectionPool.Current.GetClient(_clusterName);
    try
    {
        ISearchResponse<T> result;
        if (fields != null && fields.Any())
        {
            result = client.Search<T>(n => n
                .Index(_index)
                .Size(limit)
                .Source(s => s.Includes(f => f.Fields(fields)))
                .Query(q => q.Bool(f => f.Filter(t => t.Raw(query)))));
        }
        else
        {
            result = client.Search<T>(n => n
                .Index(_index)
                .Size(limit)
                .Query(q => q.Bool(f => f.Filter(t => t.Raw(query)))));
        }

        if (Logger.Current.IsDebugEnabled)
        {
            Log.Debug("ElasticsearchContext.Query", "Debug info", result.DebugInformation);
        }

        if (result.ApiCall.Success)
        {
            return result.Hits.Where(hit => hit.Source != null).Select(hit =>
            {
                hit.Source.Id = Extensions.Deserialize<TIndex>(hit.Id);
                return hit.Source;
            });
        }
        else
        {
            Log.Error("ElasticSearch", "Query failed when api was called", query, result.ApiCall.ToString());
            return Enumerable.Empty<T>();
        }
    }
    finally
    {
        ElasticsearchConnectionPool.Current.ReleaseClient(_clusterName, client);
    }
}
It seems that when our servers are running on windows, the performance is better.
If it helps, we noticed this stacktrace popping from time to time :
May 23 12:49:49:       ERROR [Elasticsearch.Net.ElasticsearchClientException: Maximum timeout reached while retrying request ---> System.Threading.Tasks.TaskCanceledException: A task was canceled.
May 23 12:49:49:    at System.Runtime.CompilerServices.TaskAwaiter.ThrowForNonSuccess(Task task)
May 23 12:49:49:    at System.Runtime.CompilerServices.TaskAwaiter.HandleNonSuccessAndDebuggerNotification(Task task)
May 23 12:49:49:    at System.Net.Http.HttpClient.<FinishSendAsync>d__58.MoveNext()
May 23 12:49:49: --- End of stack trace from previous location where exception was thrown ---
May 23 12:49:49:    at System.Runtime.ExceptionServices.ExceptionDispatchInfo.Throw()
May 23 12:49:49:    at System.Runtime.CompilerServices.TaskAwaiter.ThrowForNonSuccess(Task task)
May 23 12:49:49:    at System.Runtime.CompilerServices.TaskAwaiter.HandleNonSuccessAndDebuggerNotification(Task task)
May 23 12:49:49:    at Elasticsearch.Net.HttpConnection.Request[TReturn](RequestData requestData) in c:\Projects\elastic\net-5\src\Elasticsearch.Net\Connection\HttpConnection-CoreFx.cs:line 70
May 23 12:49:49:    --- End of inner exception stack trace ---
May 23 12:49:49:    at Elasticsearch.Net.RequestPipeline.BadResponse[TReturn](ElasticsearchResponse
1& response, RequestData data, List1 pipelineExceptions) in c:\Projects\elastic\net-5\src\Elasticsearch.Net\Transport\Pipeline\RequestPipeline.cs:line 501
May 23 12:49:49: at Elasticsearch.Net.Transport1.Request[TReturn](HttpMethod method, String path, PostData1 data, IRequestParameters requestParameters) in c:\Projects\elastic\net-5\src\Elasticsearch.Net\Transport\Transport.cs:line 104
May 23 12:49:49: at Nest.LowLevelDispatch.SearchDispatch[T](IRequest1 p, PostData1 body) in c:\Projects\elastic\net-5\src\Nest\_Generated\_LowLevelDispatch.generated.cs:line 2847
May 23 12:49:49: at Nest.ElasticClient.Nest.IHighLevelToLowLevelDispatcher.Dispatch[TRequest,TQueryString,TResponse](TRequest request, Func3 responseGenerator, Func3 dispatch) in c:\Projects\elastic\net-5\src\Nest\ElasticClient.cs:line 57
May 23 12:49:49: at AntVoice.Common.DataAccess.ElasticsearchClient.ElasticsearchContext2.RawQuery(String query, Int32 limit, String[] fields)`
Steps to reproduce:
- Run a server on linux
- See the increase of timings for the same queries
Provide ConnectionSettings (if relevant):
var pool = new StaticConnectionPool(new Uri("http://elastic01-prod:9200));
_client = new ElasticClient(new ConnectionSettings(pool).ThrowExceptions());
 testos944
All 15 comments
+1
on Windows 140% slower
var sd = new SearchDescriptor<object>().Type(Types.Parse("project")).Query(q => q.Bool(b => b.Filter(Query<object>.Ids(z => z.Values(new[] { "AVx9SuIapC_PV5uTcKSj" })))));
_client.Serializer.SerializeToBytes(sd)
<-- .NET Core - 270ms, .Net Framework 4.5 - 125ms
 almanzharoz
on 7 Jun 2017
almanzharoz
on 7 Jun 2017
Thanks for reporting this, we will dive in to investigate.
 Mpdreamz
on 12 Jun 2017
Mpdreamz
on 12 Jun 2017
apologies for the necrobump, did anything ever come of this? I believe we are experiencing the same, via docker on debian.
 neeasade
on 13 Nov 2017
neeasade
on 13 Nov 2017
@almanzharoz your issue could be explained by a difference between cold startup time between corefx and the desktop CLR. A deserialization should take nowhere near >1ms let alone 100+.
class Program
{
    static void Main(string[] args)
    {
        Console.WriteLine("Hello World!");
        var client = new ElasticClient();
        var sw = new Stopwatch();
        sw.Start();
        Deserialize(client);
        sw.Stop();
        Console.WriteLine($"Cold time: {sw.Elapsed}");
        sw.Reset();

        const int it = 100_000;
        sw.Start();
        for (var i = 0; i < it; i++)
        {
            Deserialize(client);
        }
        Console.WriteLine($"Total time: {sw.Elapsed}");
        var average = (long)Math.Round((double)sw.Elapsed.Ticks / it, MidpointRounding.AwayFromZero);
        Console.WriteLine($"Average time over {it} iterations: {TimeSpan.FromTicks(average):mm\\.ss\\.fffffff}");
    }

    private static void Deserialize(IElasticClient client)
    {
        var sd = new SearchDescriptor<object>().Type(Types.Parse("project"))
            .Query(q => q
                .Bool(b => b
                    .Filter(Query<object>.Ids(z => z.Values("AVx9SuIapC_PV5uTcKSj"))
                )
            )
        );
        var bytes = client.RequestResponseSerializer.SerializeToBytes(sd);
    }
}
.NET 4.5
Hello World!
Cold time: 00:00:00.4236862
Total time: 00:00:02.6523886
Average time over 100000 iterations: 00.00.0000265
.NET Core (netcoreapp2)
```
"C:\Program Files\dotnet\dotnet.exe" C:/Projects/elastic/net-master/src/ScratchPad/bin/Release/netcoreapp2.0/ScratchPad.dll
Hello World!
Cold time: 00:00:00.4155492
Total time: 00:00:02.7471412
Average time over 100000 iterations: 00.00.0000275
````
As can be seen startup/cold time is substantial as both NEST and JSON.NET do some reflection and caching, subsequent invocations should be a hell of a lot faster in the realm of <1ms.
Mpdreamz
on 11 Dec 2017
@testos944 @neeasade HTTP on core is definitely slower and I am still trying to get to the bottom of this.
I investigated TCP reuse and could reliably show that on .NET core the connections were not reused as they were on .NET 4.x and up. This relates to the CurlHandler which .NET core ends up using where it can not use the default WebRequestHandler. I opened an issue on the corefx repos some time ago that is still open: https://github.com/dotnet/corefx/issues/21227
We try to mitigate this by shipping with a lower concurrency if we see that the platform the client runs under uses the CurlHandler.
Another possible reason is that this CurlHandler does not use HTTP pipelining: https://github.com/dotnet/corefx/issues/14612#issuecomment-309466811.
A fully managed cross platform handler for HttpClient is in the works but nothing has shipped yet.
Another aspect is that on .NET 4.x we use a WebRequest powered IConnection, on .net core we use an HttpClient powered IConnection. While we hope to converge to a single HttpClient implementation in the future, we need to build evidence its on par with the netfx version.
Mpdreamz
on 11 Dec 2017
+1
 canertosuner
on 30 Jan 2018
canertosuner
on 30 Jan 2018
Have you seen the changes that they have made to HttpClient and the new IHttpClientFactory in .net core 2.1? Apparently they changes the handler to use the new managed sockets implementation and saw a massive performance increase.
 ejsmith
on 14 Mar 2018
ejsmith
on 14 Mar 2018
Yep that's the managed handler I was referring to earlier, once that ships were definitely creating an IConnection implementation for.it :)
Mpdreamz
on 14 Mar 2018
@Mpdreamz the new sockets implementation has now been released, is there anything we can do to get the ball rolling on the new IConnection implementation?
 ThomasSkyldahl
on 6 Dec 2018
ThomasSkyldahl
on 6 Dec 2018
@Mpdreamz Any update on this?
 cguedel
on 6 Nov 2019
cguedel
on 6 Nov 2019
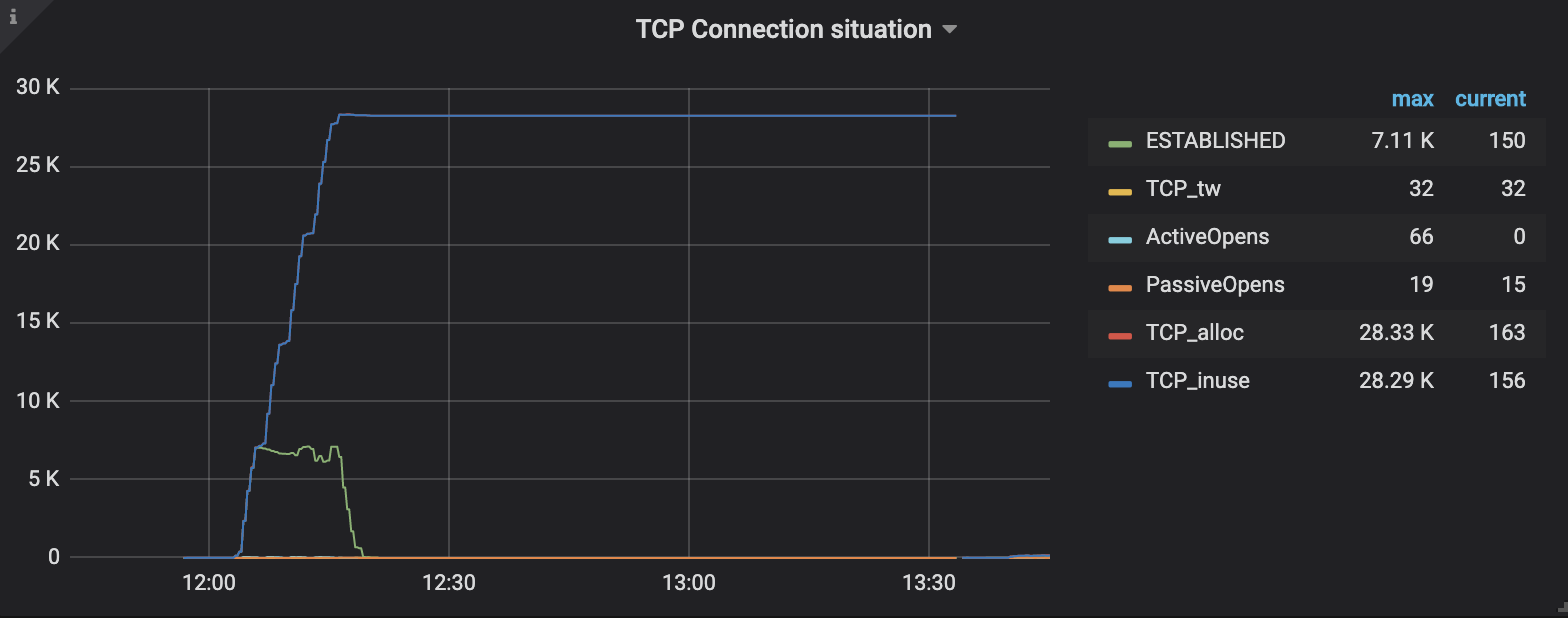
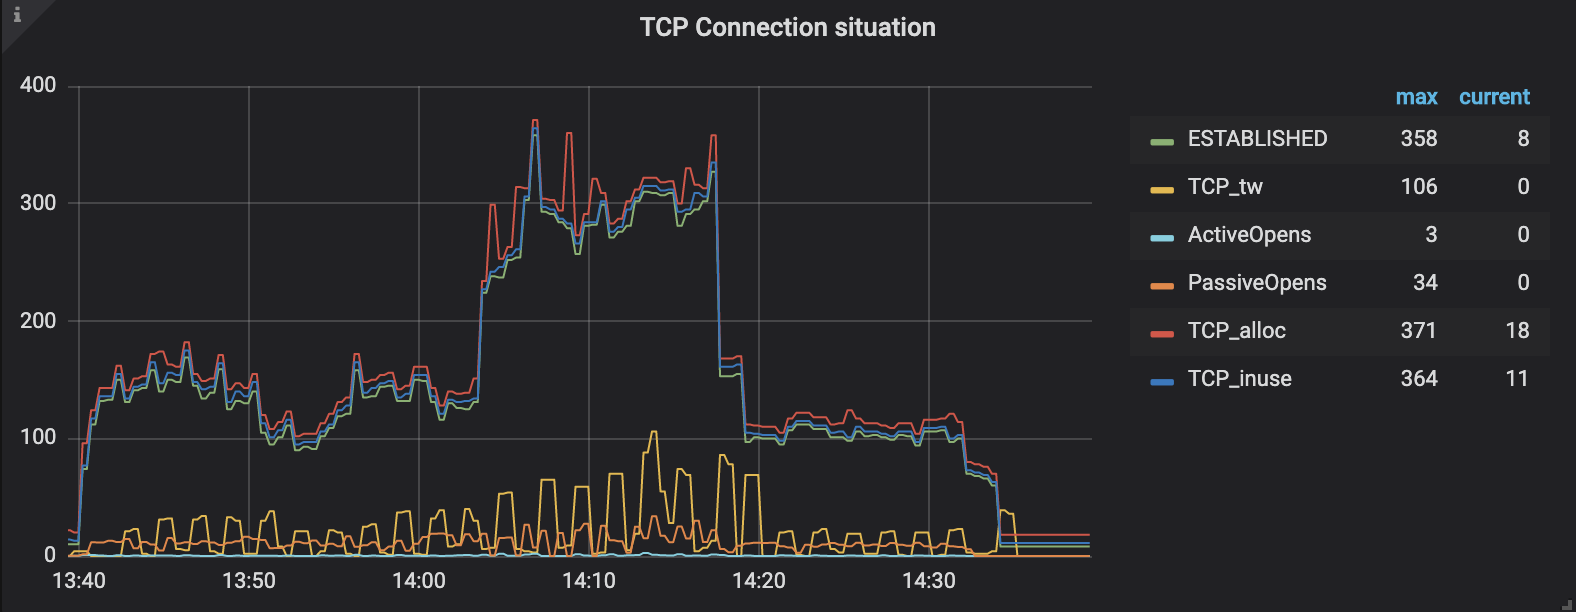
I tried to use NEST(7.1) on Linux and it opens too many TCP connections and doesn't close them. Then, I changed the code to using IHttpClientFactory and it works like charm. But this way, I should use my own NEST library that changed from me.
Here are the results:
Before using IHttpClientFactory
After using IHttpClientFactory
 turgayozgur
on 5 Dec 2019
turgayozgur
on 5 Dec 2019
HI @turgayozgur
Are you adhering the NEST lifetime requirements? https://www.elastic.co/guide/en/elasticsearch/client/net-api/current/lifetimes.html
Can you share more about which TFM and OS you are using?
We have integration tests for connection reuse and my main workstation is linux but I am not seeing the same behaviour if ConnectionSettings is reused.
On master calling:
$ ./build.sh integrate-one 7.5.0 connectionreuse
Will kick of just these tests
Doing a 100k searches yields the following opened and total opened TCP connections. This is on netcoreapp3.0.
Current Open: 13, Total Opened: 18, Iteration Max = 616, Iteration: 99, Total Searches 100000
And netstat -a seems to agree after running as well.
If I change the test to new an client before each search the tests quickly fails due to opening too many sockets
    .Select(r => new ElasticClient(new TestConnectionSettings().ApplyDomainSettings()))
    .Select(async c => await c.SearchAsync<Project>())
Expected value to be less or equal to 13 because CurrentOpen exceed our connection limit 12, but found 1190.
Can you share a bit more about your test setup? Test code, OS, .net sdk version, target .net core version that would be useful to investigate further.
Mpdreamz
on 6 Dec 2019
Hi @Mpdreamz,
I have tested on ubuntu 18.04. dotnet sdk version was 2.2.401 and the core version was 2.2.
The main issue about my scenario is using a new ElasticClient for every request. It is totally understandable. The nest library trying to cache the HttpClients but when I create the new instance for every request, it can't do it. The httpclientfactory is okay but singleton usage of ElasticClient is also okay. There is no reason to change anything in the NEST library. Thank you for this information.
turgayozgur
on 6 Dec 2019
Thanks for confirming @turgayozgur !
Mpdreamz
on 6 Dec 2019
Looks like this one can be closed. Performance will be a core focus area in the next major release, along with some additional transport changes/improvements.
 stevejgordon
on 26 Jan 2021
stevejgordon
on 26 Jan 2021
Related issues
 niemyjski
·
4Comments
niemyjski
·
4Comments
 jhellemann
·
4Comments
jhellemann
·
4Comments
 joostvz
·
3Comments
joostvz
·
3Comments
 alwag85
·
5Comments
ejsmith
·
3Comments
alwag85
·
5Comments
ejsmith
·
3Comments
Most helpful comment
@Mpdreamz the new sockets implementation has now been released, is there anything we can do to get the ball rolling on the new IConnection implementation?