Elastalert: Misaligned columns in aggregation summary table in Hipchat
Hello, I need help to align the aggregation summary table that i get in my elast alert manager. I tried asking solution to my issue on gitter group, but got no response. Hence i created this ticket here, as this is a little urgent for me.
Issue:
The columns in my aggregation summary table alert appear misaligned on HIPCHAT. It looks really messy and are not easily readable. Please help me with how can i change those settings.
Also why cant we add a customized line of text along with the aggregation summary table.
It would be of great help if you could help me provide solution for the same.
Thanks in advance.
 namratapanchal
All 8 comments
@Qmando Kindly help!
namratapanchal
on 29 May 2018
Can you please post what it looks like in HipChat?
Also, you should be able to add text, using alert_text.
 Qmando
on 29 May 2018
Qmando
on 29 May 2018
Here is the screenshot of how my hipchat alert looks. As you can see the column lines are misaligned and the data of one column gets split under two columns due to the column misalignment.
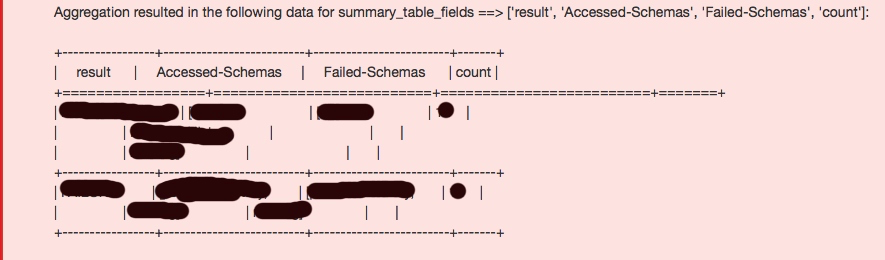
Also can you help me with an example of applying aggregation summary table and alert text together?
It would be really kind of you to do that.
Thank you in advance.
namratapanchal
on 30 May 2018
Ok, thats about what I expected. This really doesn't work well with non monospaced fonts
I'm going to try and add better support for adding some HTML tags around this to make it a legit table. I don't have Hipchat to test with, but it seems to take HTML so hopefully a normal table works 🤞
There's not really a good workaround right now, the best you can do is probably:
alert_text: "{} - {} - {} - {}"
alert_text_args: ["result", "accessed-schemas", "failed-schemas"]
alert_text_type: alert_text_only
It won't count things for you, but it will print everything out on it's own line, with some annoying filler text in between. Sorry :(
Qmando
on 30 May 2018
But, this solution will not serve my purpose, I wish to get the count of the result of my query, hence I need the aggregation result.
Also if I use the above solution mentioned by you, it will give me an alert for every time my query execution is true. So if within a minute if it occurs 20 times, I will get 20 alerts for the same, which is not what i want.
I want it to alert me the number of times my query execution is resulted in true within a specified duration.
@Qmando can you kindly help.
Thank you in advance.
namratapanchal
on 30 May 2018
hello! @namratapanchal i use aggregation summary table for my alert,but in my email ,the count is aways 1,just like next:
Aggregation resulted in the following data for summary_table_fields ==> ['geoip.ip', 'count']:
+----------------+-------+
| geoip.ip | count |
+================+=======+
| 1.1.1.1 | 1 |
+----------------+-------+
| 2.2.2.2 | 1 |
+----------------+-------+
could you share your rule with me,thanks!
 tm2018
on 30 May 2018
tm2018
on 30 May 2018
@tm2018 I hope it helps!
filter:
- query:
query_string:
query: " Your query"
num_events: 1
timeframe:
seconds: 60
alert_text_type: aggregation_summary_only
alert:
- "hipchat"
hipchat:
hipchat_auth_token: "abc"
hipchat_room_id: "Room Name"
hipchat_domain: "Domain name"
hipchat_message_format: "text"
aggregation:
minutes: 1
summary_table_fields:
- field 1
- field 2
realert:
minutes: 0
namratapanchal
on 30 May 2018
Is there no way to access aggregation_summary from the email template? If there were I could do something like:
email_format: html
alert_text_type: alert_text_only
alert_text: "<p>{0}</p><br /><pre>{1}</pre><a href='{2}' target='_blank'>Kibana</a>"
alert_text_args:
  - description
  - aggregation_summary
  - use_kibana4_dashboard
 jocooler
on 22 Oct 2018
jocooler
on 22 Oct 2018
Related issues
 Shashankft9
·
3Comments
Shashankft9
·
3Comments
 tkumark
·
3Comments
tkumark
·
3Comments
 MaximilianKaltner
·
3Comments
MaximilianKaltner
·
3Comments
 abhishekjiitr
·
3Comments
abhishekjiitr
·
3Comments
 chihhanyu
·
3Comments
chihhanyu
·
3Comments