Efcore: Benchmarks: reorganize PowerBI dashboard
The current basic unit of display at the moment is the class, which mixes together different methods on the same X/Y axis, although they're not comparable. This makes it very hard to read the results, and requires us to deselect the class and select a specific method every time.
~Ideally, methods would be nested under their classes, and a single dashboard would show only a single method with all its parameter permutations.~
Possibly promote the database setting (currently Sqlite only) to be a top-level selection, like hardware and operating system, freeing up a node in the "category" hierarchy.
~Probably requires a database cleanup as well at the same time, we can do this on my next visit to Redmond.~
/cc @sebastienros
 roji
roji
All 13 comments
Took another look at this, here's what I think.
Out current microbenchmarking dashboard has two boxes: Operations per Second, and Allocated (memory). All benchmark suites are plotted in these two boxes, which makes no sense (measuring different things) and is very hard to read.
In BenchmarkDotNet, the class is the unit displayed together - the different methods are "plotted" together and compared in the final outputs; I think we should have the same in our dashboard. In other words, we would ideally have a box per class (a box for Delete, a box for Update...); in each box (which corresponds to a class) we'd plot the different methods and parameter sets in that class.
The remaining problem is probably what to do with Operations Per Second vs. Memory. Plotting both inside the same box is probably going to be messy, so maybe a separate box for each? Or we could have a selection between the two, at the top (next to hardware, operating system)?
@ajcvickers and @dotnet/efcore thoughts? @sebastienros can you help us out with this? I'm hoping this is just a display thing and doesn't require any data changes?
roji
on 4 Apr 2020
@roji When you say, "ideally have a box per class" you mean per class of tests, not per C# class, right?
This is what I was imagining:
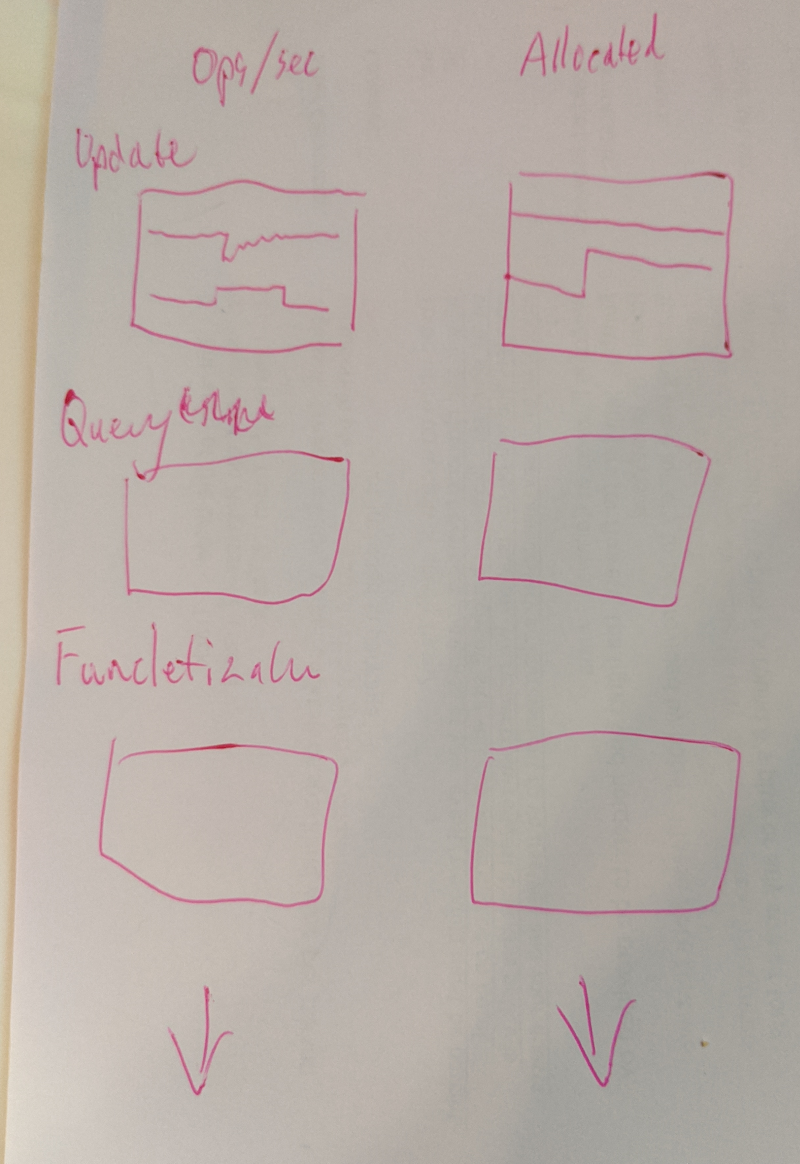
Is this the same as what you are suggesting?
 ajcvickers
on 6 Apr 2020
ajcvickers
on 6 Apr 2020
Nice drawing skills :laughing:
@roji When you say, "ideally have a box per class" you mean per class of tests, not per C# class, right?
Yeah, your drawing should be the same as what I'm suggesting - unless I'm mistaken, tests are already organized in this way according in C# classes - we have one C# class for SimpleQuery, one for Funcletization, one for Insert, one for Update... So simply having a box per C# class should get us exactly what we want, and incidentally also corresponds to the natural way of displaying BenchmarkDotNet results.
roji
on 6 Apr 2020
That what the checkbox tree lets you do, you can select what to display in the boxes. If you want to see what's related to a class, and only this class, then you click on the class node you want to see:
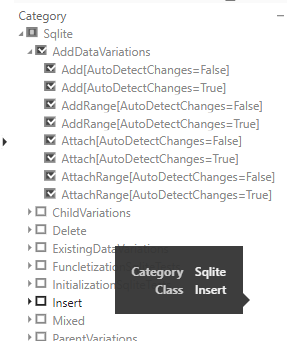
But it's kind of painful to change if you need to browse over all the classes. We can change the selection to mutually exclusve by default, so clicking one class would un-select the other ones, and you would still be able to display two classes' methods with CTRL+CLICK.
You should still keep the memory and ops in two different charts.
Now if you want to see all the classes in different boxes at the same time, it's also very easy. It just means that adding/removing classes would require a manual change to the PBI charts.
 sebastienros
on 6 Apr 2020
sebastienros
on 6 Apr 2020
What do you think @ajcvickers? I like the idea of the mutually exclusive selection by default, and it sounds good to avoid having to do manual changes when we add/remove classes. So I'd vote for that option.
You should still keep the memory and ops in two different charts.
Yeah, agree on that.
roji
on 6 Apr 2020
Also if you don't want to be able to select down to the methods, I can remove them from the list of checkboxes, ... but you might regret it. If that's the way you look at charts though, just let me know.
sebastienros
on 6 Apr 2020
I published an update.
sebastienros
on 6 Apr 2020
Seems like when I click multiple classes they still pile up (not mutually exclusive).
PS If we do want a box-per-class, what would the manual update consist of for adding a new thing? Would we be able to do it ourselves somehow? Because there's also value in being able to just see everything in one screen rather than having to click through classes one by one.
roji
on 6 Apr 2020
PS after discussing with @ajcvickers maybe it'd be better to just have all the boxes there. We very rarely add/remove benchmark classes (so far), so a manual update doesn't seem so bad (especially if we can do it ourselves somehow).
roji
on 6 Apr 2020
I did the requested changes, can you check I didn't miss anything?
https://msit.powerbi.com/groups/b5743765-ec44-4dfc-91df-e32401023530/reports/10265790-7e2e-41d3-9388-86ab72be3fe9/ReportSection86dad213000b67ae010e
sebastienros
on 10 Apr 2020
Looks great @sebastienros, exactly what we had in mind! Thanks!
If we do want to add/remove boxes, can we do that ourselves somewhere or do we need your manual help?
roji
on 10 Apr 2020
I don't have a doc for that, but I could teach someone. And then this person would make an internal document on how to do it. @BrennanConroy also knows in case I disapear.
sebastienros
on 10 Apr 2020
Could be good... If you feel like walking me through this I could do some docs on it.
roji
on 10 Apr 2020
Related issues
 leak
·
3Comments
leak
·
3Comments
 miguelhrocha
·
3Comments
miguelhrocha
·
3Comments
 januszj
·
3Comments
januszj
·
3Comments
 ericvb
·
3Comments
ericvb
·
3Comments
 ryanwinter
·
3Comments
ryanwinter
·
3Comments