Edex-ui: Latest Release (Windows) is Running Terribly
Tried this out today on two win10 machines. Had to force kill the process on both machines after it immediately redlined the CPU at a constant 100% with 60-75% of that being the exe. On one machine it chewed up over 3.8 GB of RAM before I closed it.
WMIC/wmiprvse runs wild.
I haven't dipped into the source to see what's going on, but i'd be surprised if this needed to be so excessive.
PC:
Win10
AMD FX-9590 (4.72 GHz)
32 GB
GTX 970
Tablet:
Win10
Intel Atom Z8700
4 GB
I can only venture a guess...maybe windows defender has the application in a choke hold or something. It seems odd, since I don't see any similar issues being brought up here.
I'd like to help figure this out. Reply with thoughts or suggestions I can try out.
Easy to repeat and provide more details if needed.
 cmdrflexo
All 19 comments
Yeah I've heard some reports that CPU/mem usage was absolutely nuts on windows for some people. Could you post of screenshot of the task manager with eDEX running?
 GitSquared
on 22 Nov 2018
GitSquared
on 22 Nov 2018
I had the same problem to the point where I had to force shut my computer down. Before shutting it down, I did manage to see at least tens of "WMI Commandline" processes running. It seemed like more of them were spawning but I'm not positive.
 MCluck90
on 22 Nov 2018
MCluck90
on 22 Nov 2018
@GitSquared
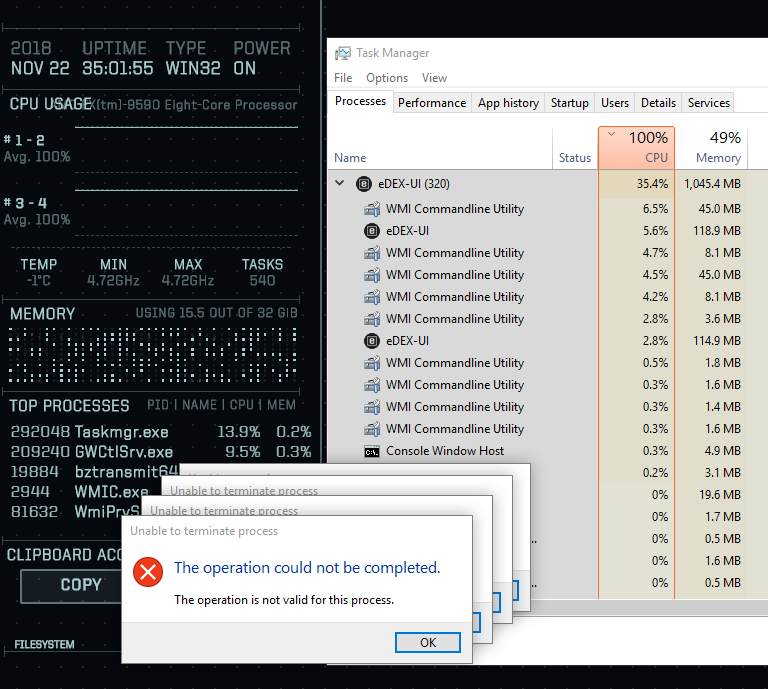
cmdrflexo
on 22 Nov 2018
Can confirm, I returned to my computer, only to see that it used 10GB+ ram and made my computer almost entirely unresponsive and task manager's font became bold suddenly. Tried to make a screenshot, but my computer was too laggy/unresponsive for it
 arunesh90
on 23 Nov 2018
arunesh90
on 23 Nov 2018
Can confirm, I returned to my computer, only to see that it used 10GB+ ram and made my computer almost entirely unresponsive and task manager's font became bold suddenly. Tried to make a screenshot, but my computer was too laggy/unresponsive for it
@arunesh90 yeah, i saw the taskmgr font change too...bizarre...i've never seen that happen before. This whole thing has me quite intrigued now 😝
cmdrflexo
on 23 Nov 2018
I think i got an idea for a "fix", but i don't believe i've found the root cause yet.
I'll need to rewrite a significant portion of the code, though, so don't expect it to land before at least this weekend.
GitSquared
on 23 Nov 2018
One more thing, when i was switching themes a lot, memory and cpu usage increased significantly. My OS is the same - win10x64
 oshnix
on 23 Nov 2018
oshnix
on 23 Nov 2018
@oshnix related to #221
GitSquared
on 23 Nov 2018
Update on this: I'm releasing a few more fixes in v1.1.2 tonight, then i'll start to rewrite the whole module system - expect huge performance improvement, + upgrade to electron 3.0
I'll keep this thread updated of course.
GitSquared
on 2 Dec 2018
Would anyone be willing to try out this test version (from the multithread-experiment branch)?
Performance should be quite heavily improved on this one, note that it doesn't support the Globe module yet 'cause i need to tweak this one a bit more.
I'll test it out myself on some machines but just wanted to give a heads up to anyone still interested.
GitSquared
on 12 Dec 2018
Much better than it was. Now it uses about 15% cpu on my machine when not doing anything other than the default graphics/top/etc. Uses ~550MB ram.
Machine: xeon E3-1505M 2.8GHz (4 core/8 thread), 32 GB memory
 presidentelect
on 12 Dec 2018
presidentelect
on 12 Dec 2018
Another user here confirming that this program spawns endless processes and can not run, i'll try the test version now.
 erixom
on 12 Dec 2018
erixom
on 12 Dec 2018
Performance in general much better on here, I could not test it with different themes because they wouldn't load due to an error with the globe not working. I have to say this sadly does not work that well in touch mode on my 2 in 1 but works great on my normal laptop.
erixom
on 12 Dec 2018
@presidentelect @erixom well this is encouraging feedback. I'll keep going in that direction then. Thank you guys!
GitSquared
on 12 Dec 2018
test version is much better, but still cost 90% CPU。hope you can fix it,this is a great UI
 a494413872
on 13 Dec 2018
a494413872
on 13 Dec 2018
Same problem here.
Is it possible to remove the file drive checks on Windows using a setting?
I think that also use a lot of resources (takes a while to check "available space" at start for example) and I do not use that at all on windows. Windows explorer is not the best tool on windows and have that opened all time is not useful.
In fact a setting removing the whole thing (not just visually) will help I suppose.
Also, the same with the keyboard. Now we can "hide it" but it is loading in the back. Can we disable the keyboard completely on settings?
Thanks!
 planetahuevo
on 15 Dec 2018
planetahuevo
on 15 Dec 2018
I think that also use a lot of resources (takes a while to check "available space" at start for example)
@planetahuevo That's because of Powershell not sending any output (and thus triggering the file system scan and other elements of the UI) before you type something.
The file system display has next to no performance impact in it's current implementation. If you want to hide it, look into making a custom theme - like tron-notype, I know you've seen the thread at #259.
GitSquared
on 15 Dec 2018
Update: I've finished the multithreaded work distribution script, re-enabled the globe and locked the 3D render's framerate to 30 FPS, which at least on my machine had a significant (40%) CPU impact.
Working on updating to Electron v4 which just came out yesterday, and then i'll do another round of testing.
GitSquared
on 22 Dec 2018
I did a bit of testing to see how the performance improvements coming in 2.0.0 are affecting this.
Here's a comparative table of performance across multiple key eDEX versions:
Version number | Average CPU usage | Average RAM usage | Average GPU usage | Additional remarks
-------------- | ----------------- | ----------------- | ----------------- | ------------------
1.0.0 | 35%* | 400 Mo* | 25-30% (spikes) | *If anything prevents the ping and net statistics subprocesses to run smoothly, eDEX quickly starts leaking memory (reached >5 Gb on my test) and CPU usage jumps to 90%
1.1.2 | 30% | 410 Mo | 25% | This version was already a bit less likely to spike when subprocesses failed, for some reason
2.0.0-pre | 15% | 510 Mo | 9% | CPU & GPU usage is much more stable (due to locking the framerate to 30FPS and upgrading Electron, among other things). A bit more RAM usage because of added features like sound effects. Could not reproduce the "leak" bug from v1
Testing was done on a - quite powerful - Lenovo Yoga machine with the following notable specs:
- Windows 10 Home x64
- Intel Core i5-8250U Quad-Core, 8 Threads 1.6 GHz (up to 3.4 GHz boost)
- Intel UHD Graphics 620 (Integrated graphics, clock: 1.150 MHz) with DirectX 12 support
- 8 Go of 2400 MHz SODIMM memory
For each version tested, eDEX was ran for about 15 minutes with a busy (looping tracert) cmd.exe as the underlying shell. Nothing else running in the background, except default Win10 services. Laptop was plugged in.
2.0.0 will be released before mid-january I think. Note that the performance improvements are even more important on *nix systems, because they didn't have multithreading at all.
GitSquared
on 24 Dec 2018
Related issues
 tandriamil
·
5Comments
tandriamil
·
5Comments
 probonopd
·
4Comments
probonopd
·
4Comments
 jakewilliami
·
4Comments
jakewilliami
·
4Comments
 Zireael07
·
5Comments
Zireael07
·
5Comments
 wolfen351
·
5Comments
wolfen351
·
5Comments
Most helpful comment
I did a bit of testing to see how the performance improvements coming in 2.0.0 are affecting this.
Here's a comparative table of performance across multiple key eDEX versions:
Version number | Average CPU usage | Average RAM usage | Average GPU usage | Additional remarks
-------------- | ----------------- | ----------------- | ----------------- | ------------------
1.0.0 | 35%* | 400 Mo* | 25-30% (spikes) | *If anything prevents the ping and net statistics subprocesses to run smoothly, eDEX quickly starts leaking memory (reached >5 Gb on my test) and CPU usage jumps to 90%
1.1.2 | 30% | 410 Mo | 25% | This version was already a bit less likely to spike when subprocesses failed, for some reason
2.0.0-pre | 15% | 510 Mo | 9% | CPU & GPU usage is much more stable (due to locking the framerate to 30FPS and upgrading Electron, among other things). A bit more RAM usage because of added features like sound effects. Could not reproduce the "leak" bug from v1
Testing was done on a - quite powerful - Lenovo Yoga machine with the following notable specs:
For each version tested, eDEX was ran for about 15 minutes with a busy (looping
tracert)cmd.exeas the underlying shell. Nothing else running in the background, except default Win10 services. Laptop was plugged in.2.0.0 will be released before mid-january I think. Note that the performance improvements are even more important on *nix systems, because they didn't have multithreading at all.