Dvc: plots show/diff: template anchors shown in plot [qa]
Bug Report
Using logs.csv from the example in https://dvc-landing-2020-05-31-evbiu1f.herokuapp.com/doc/command-reference/plots/modify#examples (see iterative/dvc.org/pull/1382):
dvc plots show
file://C:\Users\poj12\DVC-repos\tests\plots.html
Exact same resulting plot with
diff.
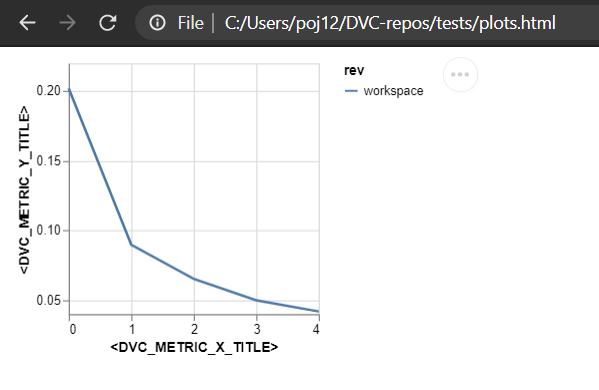
I don't think <DVC_METRIC_X_TITLE> should be shown. For X it's supposed to be index, and loss for Y in the case of this metric file.
Please provide information about your setup
Output of dvc version:
λ dvc version
DVC version: 1.0.0a9+3683c2
Python version: 3.8.2
Platform: Windows-10-10.0.18362-SP0
Binary: False
Package: None
Supported remotes: azure, gdrive, gs, hdfs, http, https, s3, ssh, oss
Cache: reflink - not supported, hardlink - supported, symlink - supported
Filesystem type (cache directory): ('NTFS', 'C:\\')
Repo: dvc, git
Filesystem type (workspace): ('NTFS', 'C:\\')
Additional Information (if any):
If applicable, please also provide a --verbose output of the command, eg: dvc add --verbose.
 jorgeorpinel
All 6 comments
Also, an effect of this is that all the --x-label and --y-label of all plot subcommands have no effect.
jorgeorpinel
on 8 Jun 2020
@jorgeorpinel Unable to reproduce. Shows index in the bottom for me.
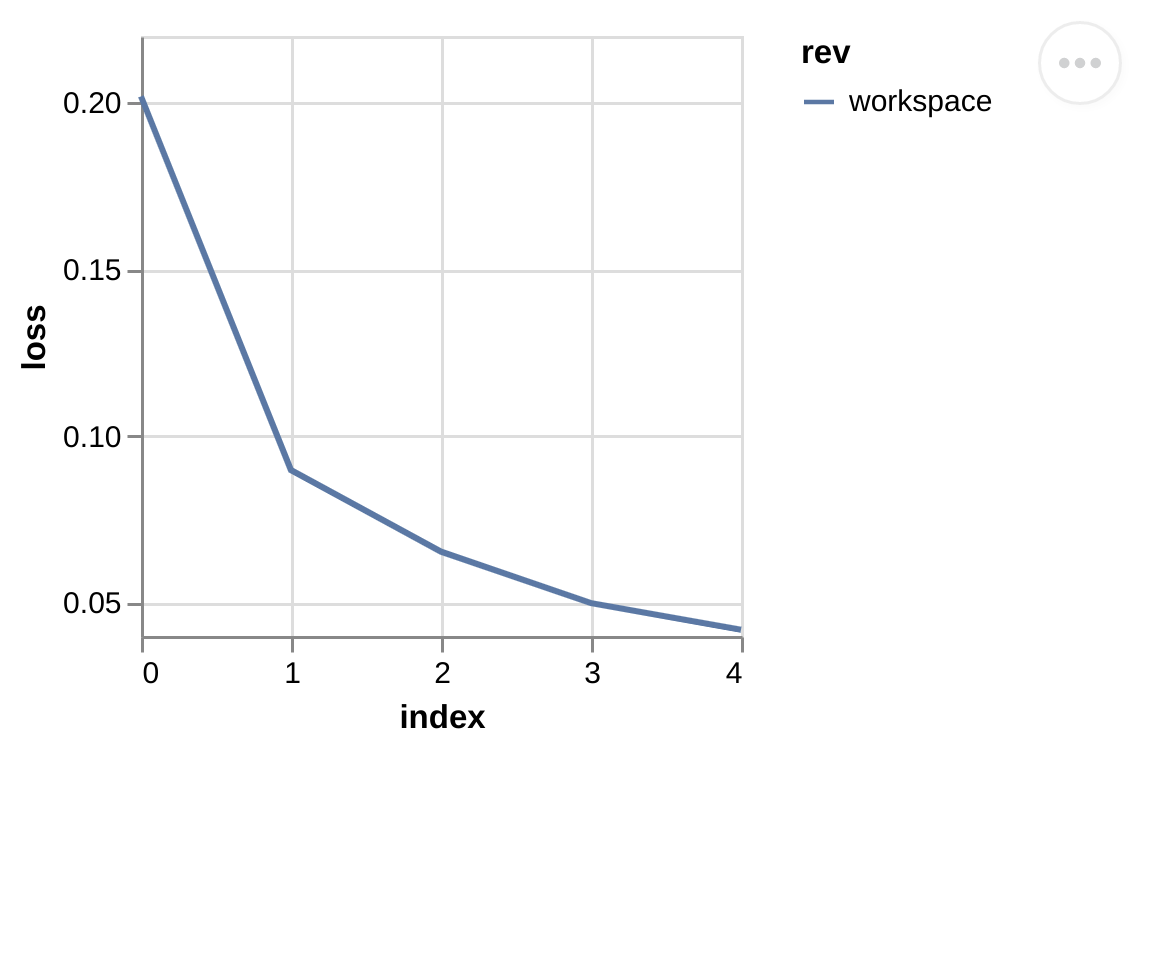
 efiop
on 8 Jun 2020
efiop
on 8 Jun 2020
Same with --x/y-label:
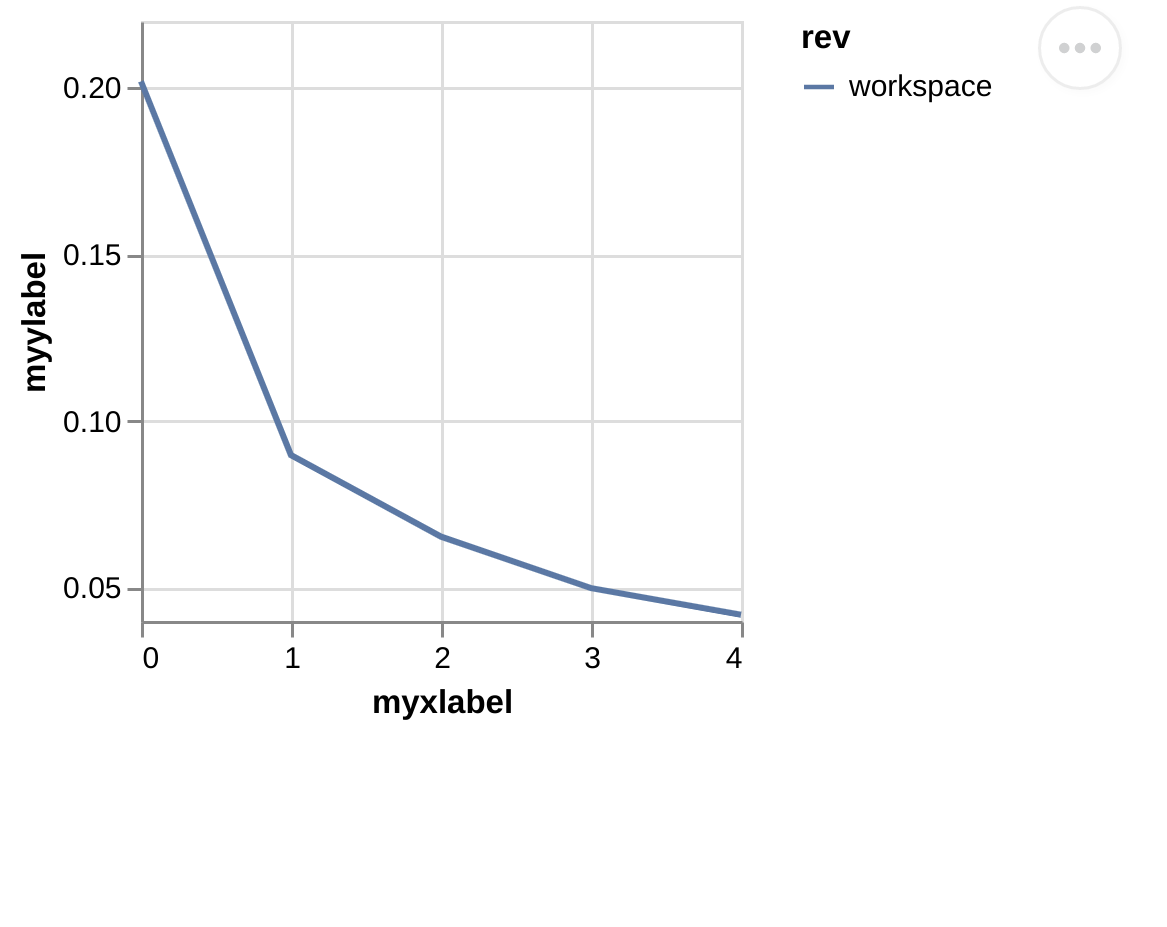
efiop
on 8 Jun 2020
Unless we have some windows-specific bug, of course. But it would be great to double-check @jorgeorpinel , maybe it was some accidental corruption or something.
efiop
on 8 Jun 2020
Hmmm OK let me try in a fresh DVC repo... ⏳
jorgeorpinel
on 8 Jun 2020
I pulled the latest master branch and installed the dev env again to 1.0.0a10+c1b0e9 and created a new project. It works now 🤷♂️
I guess it was corrupted after all! Phew!
jorgeorpinel
on 8 Jun 2020
Related issues
 ghost
·
3Comments
ghost
·
3Comments
 anotherbugmaster
·
3Comments
anotherbugmaster
·
3Comments
 shcheklein
·
3Comments
shcheklein
·
3Comments
 dmpetrov
·
3Comments
dmpetrov
·
3Comments
 robguinness
·
3Comments
robguinness
·
3Comments
Most helpful comment
I pulled the latest master branch and installed the dev env again to
1.0.0a10+c1b0e9and created a new project. It works now 🤷♂️I guess it was corrupted after all! Phew!