Prework
- [x] Read and abide by
drake's code of conduct. - [x] Search for duplicates among the existing issues, both open and closed.
Problem
- In the dependency graph visualizations, rendering times can get quite long, especially for
vis_drake_graph()andsankey_drake_graph(). - It is difficult to see node labels if the graph is too busy. The default behavior of
drake_ggraph()is just to give up and hide the text.
A retro idea
What if we just print the node names to the terminal in a nice graphical layout? As of #846, drake_graph_info()$nodes has x and y coordinates.
library(drake)
library(txtplot)

data <- function(...) {123}
munge <- function(...) {123}
plan <- drake_plan(
  x = data(),
  y = target(munge(x, i), transform = map(i = !!seq_len(100))),
  z = target(y, transform = combine(y))
)

make(plan, verbose = 0L)
config <- drake_config(plan)
nodes <- drake_graph_info(config)$nodes
txtplot(x = nodes$x, y = nodes$y, pch = nodes$id)
#>      +-+------------+-----------+-----------+-----------+--+
#>    1 +                                  y_4L                  +
#>      |                                  y_61L                  |
#>      |                                  y_55L                  |
#>  0.5 +                                  y_76L                  +
#>      | data                                y_100L                  |
#>      |                                  y_72L                  |
#>    0 +                  x               y_48L               z  +
#>      |                                  y_75L                  |
#> -0.5 + munge                                y_65L                  +
#>      |                                  y_5L                  |
#>      |                                  y_14L                  |
#>   -1 +                                  y_77L                  +
#>      +-+------------+-----------+-----------+-----------+--+
#>       -1          -0.5          0          0.5          1
Created on 2019-04-21 by the reprex package (v0.2.1)
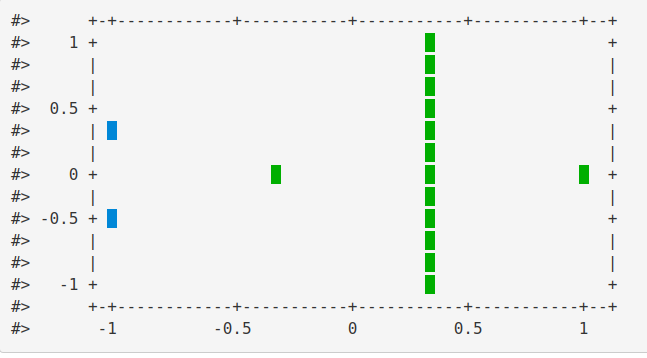
We can even add color to the points, although fansi-powered HTML reprexes do not seem to fully render on GitHub. Here is one without node text.
options(crayon.enabled = TRUE)
old.hooks <- fansi::set_knit_hooks(knitr::knit_hooks)
#> <STYLE type='text/css' scoped>
#> PRE.fansi SPAN {padding-top: .25em; padding-bottom: .25em};
#> </STYLE>

library(crayon)
library(drake)
library(txtplot)

data <- function(...) {123}
munge <- function(...) {123}
plan <- drake_plan(
  x = data(),
  y = target(munge(x, i), transform = map(i = !!seq_len(100))),
  z = target(y, transform = combine(y))
)

make(plan, verbose = 0L)
config <- drake_config(plan)
nodes <- drake_graph_info(config)$nodes
nodes$id <- paste0(nodes$id)
nodes$pch <- purrr::map2_chr(
  .x = nodes$id,
  .y = nodes$color,
  function(id, color) {
    id <- substr(x = id, start = 0, stop = 1)
    crayon::make_style(color, bg = TRUE)(" ")
  }
)

txtplot(x = nodes$x, y = nodes$y, pch = nodes$pch)
Snag
txtplot() seems to struggle when pch is more than one character. If we do need to manually replicate txtplot() to work around this limitation, I hope we can keep the code base reasonably small.
cc'ing the most active contributors to cowsay: @sckott, @aedobbyn, @ateucher.
 wlandau
All 10 comments
Admittedly, cowsay itself is only vaguely related, but maybe I can learn a thing or two about text-based terminal graphics.
wlandau
on 22 Apr 2019
@aedobbyn is the color guru - so she'll know best on that front. Anything in particular cowsay learnings can help here? If you're including any special characters that could cause an issue across platforms, but if all straight up ascii should be fine across platforms
 sckott
on 23 Apr 2019
sckott
on 23 Apr 2019
Very cool idea!
I see what you mean about txtplot() struggling when pch is more than one character. Things get out of alignment when they're preceded by text in the same row. May not be too hard to fix by digging into txtplot? Not sure though.
Same example as above, replacing your " " after crayon::make_style with "foo":
options(crayon.enabled = TRUE)
old.hooks <- fansi::set_knit_hooks(knitr::knit_hooks)
#> <STYLE type='text/css' scoped>
#> PRE.fansi SPAN {padding-top: .25em; padding-bottom: .25em};
#> </STYLE>

library(crayon)
library(drake)
library(txtplot)

data <- function(...) {123}
munge <- function(...) {123}
plan <- drake_plan(
  x = data(),
  y = target(munge(x, i), transform = map(i = !!seq_len(100))),
  z = target(y, transform = combine(y))
)

make(plan, verbose = 0L)
config <- drake_config(plan)
nodes <- drake_graph_info(config)$nodes
nodes$id <- paste0(nodes$id)
nodes$pch <- purrr::map2_chr(
  .x = nodes$id,
  .y = nodes$color,
  function(id, color) {
    id <- substr(x = id, start = 0, stop = 1)
    crayon::make_style(color, bg = TRUE)("foo")
  }
)

txtplot(x = nodes$x, y = nodes$y, pch = nodes$pch)
#>      +-+------------+-----------+-----------+-----------+--+

>    1 +                                  foo                  +

>      |                                  foo                  |

>      |                                  foo                  |

>  0.5 +                                  foo                  +

>      | foo                                foo                  |

>      |                                  foo                  |

>    0 +                  foo               foo               foo  +

>      |                                  foo                  |

> -0.5 + foo                                foo                  +

>      |                                  foo                  |

>      |                                  foo                  |

>   -1 +                                  foo                  +

>      +-+------------+-----------+-----------+-----------+--+

>       -1          -0.5          0          0.5          1
Created on 2019-04-23 by the reprex package (v0.2.1)
 aedobbyn
on 23 Apr 2019
aedobbyn
on 23 Apr 2019
Thanks for chiming in. I think alignment is the main issue, and I am resistant to hacking too far into txtplot because I would prefer not to replicate it. The functionality in txtplot itself seems limited.
@aedobbyn, your reprex is the direction I am shooting for. I modified it to pre-pad target names with \b characters (so yes, @sckott, I think we need special characters to get the most out of this) but alignment is still off, and the HTML output from reprex itself does not seem to respect the backspaces. Is there a better way to do this? Something that respects alignment, crayon styles, and reprexes?
options(crayon.enabled = TRUE)
old.hooks <- fansi::set_knit_hooks(knitr::knit_hooks)
library(crayon)
library(drake)
library(txtplot)
data <- function(...) {123}
munge <- function(...) {123}
plan <- drake_plan(
x = data(),
y = target(munge(x, i), transform = map(i = !!seq_len(100))),
z = target(y, transform = combine(y))
)
make(plan, verbose = 0L)
config <- drake_config(plan)
nodes <- drake_graph_info(config)$nodes
nodes$id <- paste0(nodes$id)
nodes$pch <- purrr::map2_chr(
.x = nodes$id,
.y = nodes$color,
function(id, color) {
pad <- rep("\b", nchar(id) - 1)
chars <- c(pad, id)
label <- paste(chars, collapse = "")
crayon::make_style(color, bg = TRUE)(label)
}
)
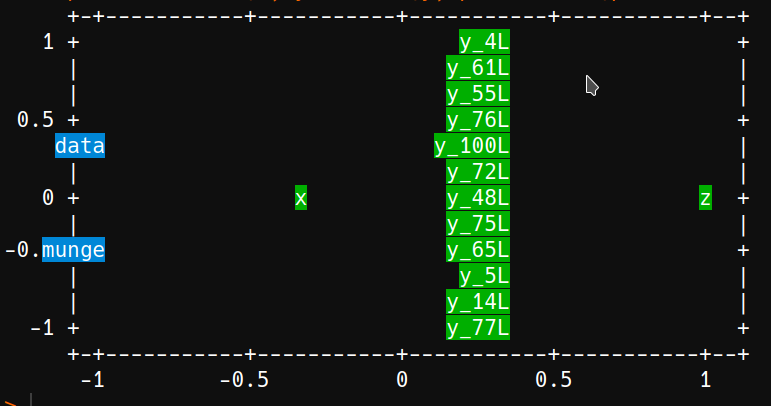
txtplot(x = nodes$x, y = nodes$y, pch = nodes$pch)
wlandau
on 24 Apr 2019
If alignment within a given "column" or y value in the txtplot is the main issue you could find the label with the longest number of characters for that column and prepend spaces to all other labels in that column so that they all line up.
So for instance y_100L is the longest in the main green column at 6 characters so prepend two spaces before y_4L, 1 space before y_61L, etc.
Is that sort of what you're going for?
aedobbyn
on 24 Apr 2019
Yeah, trailing spaces do get us closer to the correct alignment. I find the backspaces trickier, though. I think we need some way to eat up the extra space so upstream columns do not cause jitter or drift in downstream ones. Is it possible to use special characters to delete stuff after the labels rather than before them? Otherwise, maybe capture.output() + post-hoc grep magic would be better. I was hoping it would not come to that, but it is doable.
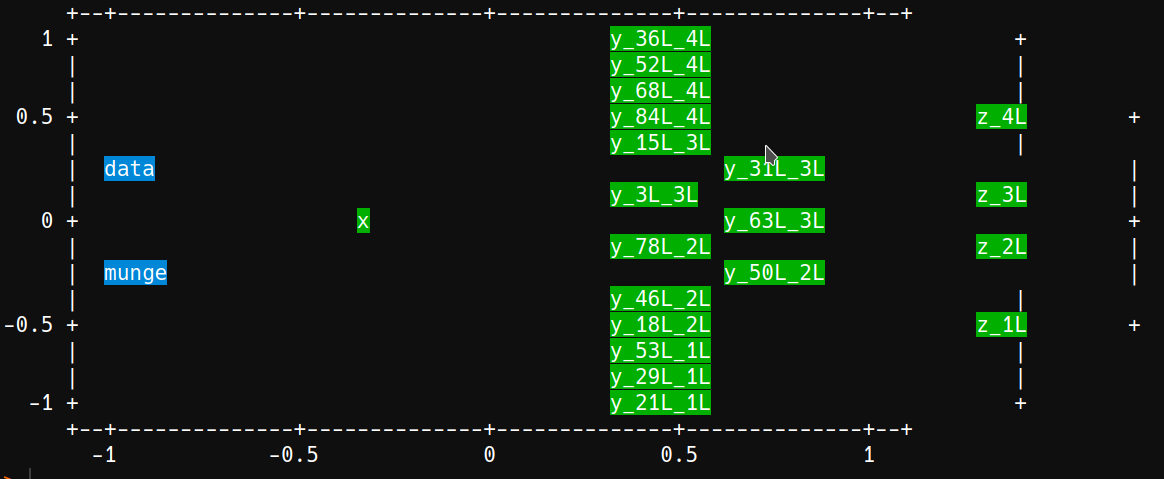
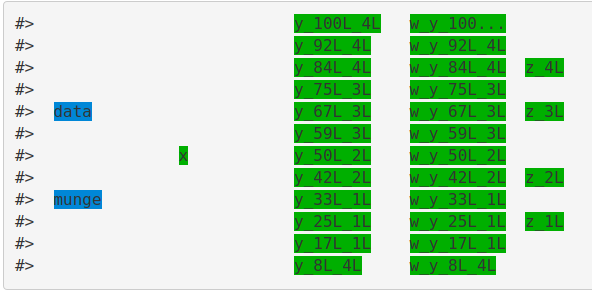
A more complicated graph without leading backspaces, where trailing spaces improve alignment like you said:
library(crayon)
library(drake)
library(txtplot)

data <- function(...) {123}
munge <- function(...) {123}
plan <- drake_plan(
  x = data(),
  y = target(
    munge(x, i, j),
    transform = map(
      i = !!seq_len(100),
      j = !!rep(seq_len(4), length.out = 100)
    )
  ),
  z = target(y, transform = combine(y, .by = j))
)

make(plan, verbose = 0L)
config <- drake_config(plan)
nodes <- drake_graph_info(config)$nodes
width <- 10L
nodes$pch <- purrr::map2_chr(
  .x = nodes$id,
  .y = nodes$color,
  function(id, color) {
    id <- drake:::crop_text(id, width)
    n <- nchar(id)
    id <- crayon::make_style(color, bg = TRUE)(id)
    paste(c(id, rep(" ", width - n)), collapse = "")
  }
)
txtplot(x = nodes$x, y = nodes$y, pch = nodes$pch)
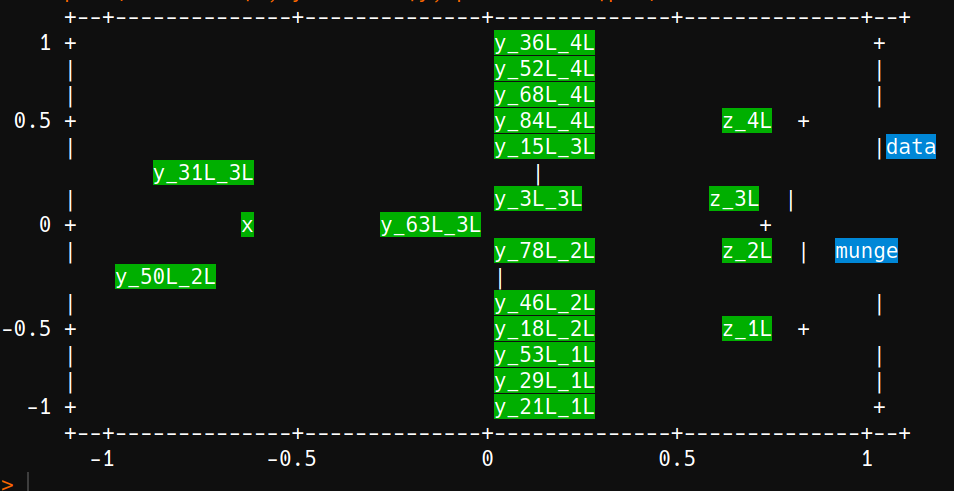
And with leading backspaces:
# ...
nodes$pch <- purrr::map2_chr(
  .x = nodes$id,
  .y = nodes$color,
  function(id, color) {
    id <- drake:::crop_text(id, width)
    n <- nchar(id)
    id <- crayon::make_style(color, bg = TRUE)(id)
    paste(c(id, rep(" ", width - n)), collapse = "")
    paste(c(rep("\b", width - 1L), id), collapse = "") # Backspaces prepended.
  }
)
# ...
wlandau
on 25 Apr 2019
Yup, the grep post-processing is not too hard, it just seems inelegant and more prone to edge cases.
options(crayon.enabled = TRUE)
old.hooks <- fansi::set_knit_hooks(knitr::knit_hooks)
#> <STYLE type='text/css' scoped>
#> PRE.fansi SPAN {padding-top: .25em; padding-bottom: .25em};
#> </STYLE>

library(crayon)
library(drake)
library(tidyverse)
library(txtplot)

data <- function(...) {123}
munge <- function(...) {123}
plan <- drake_plan(
  x = data(),
  y = target(
    munge(x, i, j),
    transform = map(
      i = !!seq_len(100),
      j = !!rep(seq_len(4), length.out = 100)
    )
  ),
  w = target(y, transform = map(y)),
  z = target(w, transform = combine(w, .by = j))
)

make(plan, verbose = 0L)
config <- drake_config(plan)
nodes <- drake_graph_info(config)$nodes
width = 10L
nodes$pch <- purrr::map2_chr(
  .x = nodes$id,
  .y = nodes$color,
  function(id, color) {
    id <- drake:::crop_text(id, width)
    n <- nchar(id)
    id <- crayon::make_style(color, bg = TRUE)(id)
    paste(c(id, rep(" ", width - n), "="), collapse = "")
  }
)
txt <- capture.output(txtplot(x = nodes$x, y = nodes$y, pch = nodes$pch))
txt <- txt[-c(1, length(txt) - 1, length(txt))]
txt <- gsub("(\\+|\\|)$", "", txt)
txt <- gsub("^.*(\\+|\\|)", "", txt)
space_pattern <- paste(c("=", rep(" ", width - 1)), collapse = "")
txt <- gsub(space_pattern, "", txt)
txt <- gsub(space_pattern, "", txt)
txt <- gsub("=", "", txt)
cat(txt, sep = "\n")
Created on 2019-04-24 by the reprex package (v0.2.1)
wlandau
on 25 Apr 2019
Changing my mind. I no longer think graphical displays are the best place to scale down or reduce crowding. Yes, we could show nicer pictures that way, but if we have thousands of targets, it would still take a lot of computation time even get there. Plus, to figure out the best nodes to drop, we would have to backsolve for the original graph topology induced by the DSL, which gets complicated super fast.
What if we thin out plans instead? We could limit the number of levels in each grouping variable in the DSL. New issue forthcoming.
wlandau
on 25 Apr 2019
Super stoked for #853.
...wait, there is also still a major legitimate use case for text_drake_graph()! Many of us shell into HPC clusters, and the lack of X Window support prevents us from visualizing stuff interactively. I think we should use the second graph from https://github.com/ropensci/drake/issues/851#issue-435505551 (with colors) and use the first letter of each target name as the plotting symbol. Still holding out for a clean solution to the backspace problem, plus better ways than txtplot to construct the graphs to begin with. I will accept PRs, but I am unlikely to dig any further myself.
wlandau
on 25 Apr 2019
Implemented. We now have text_drake_graph().
wlandau
on 26 Apr 2019
Related issues
 wlandau-lilly
·
7Comments
wlandau-lilly
·
7Comments
 rsangole
·
7Comments
rsangole
·
7Comments
 billdenney
·
9Comments
billdenney
·
9Comments
 matthiasgomolka
·
8Comments
matthiasgomolka
·
8Comments
 bart1
·
7Comments
bart1
·
7Comments
Most helpful comment
Implemented. We now have
text_drake_graph().