Distributed: Timeseries Resource Usage Tracking
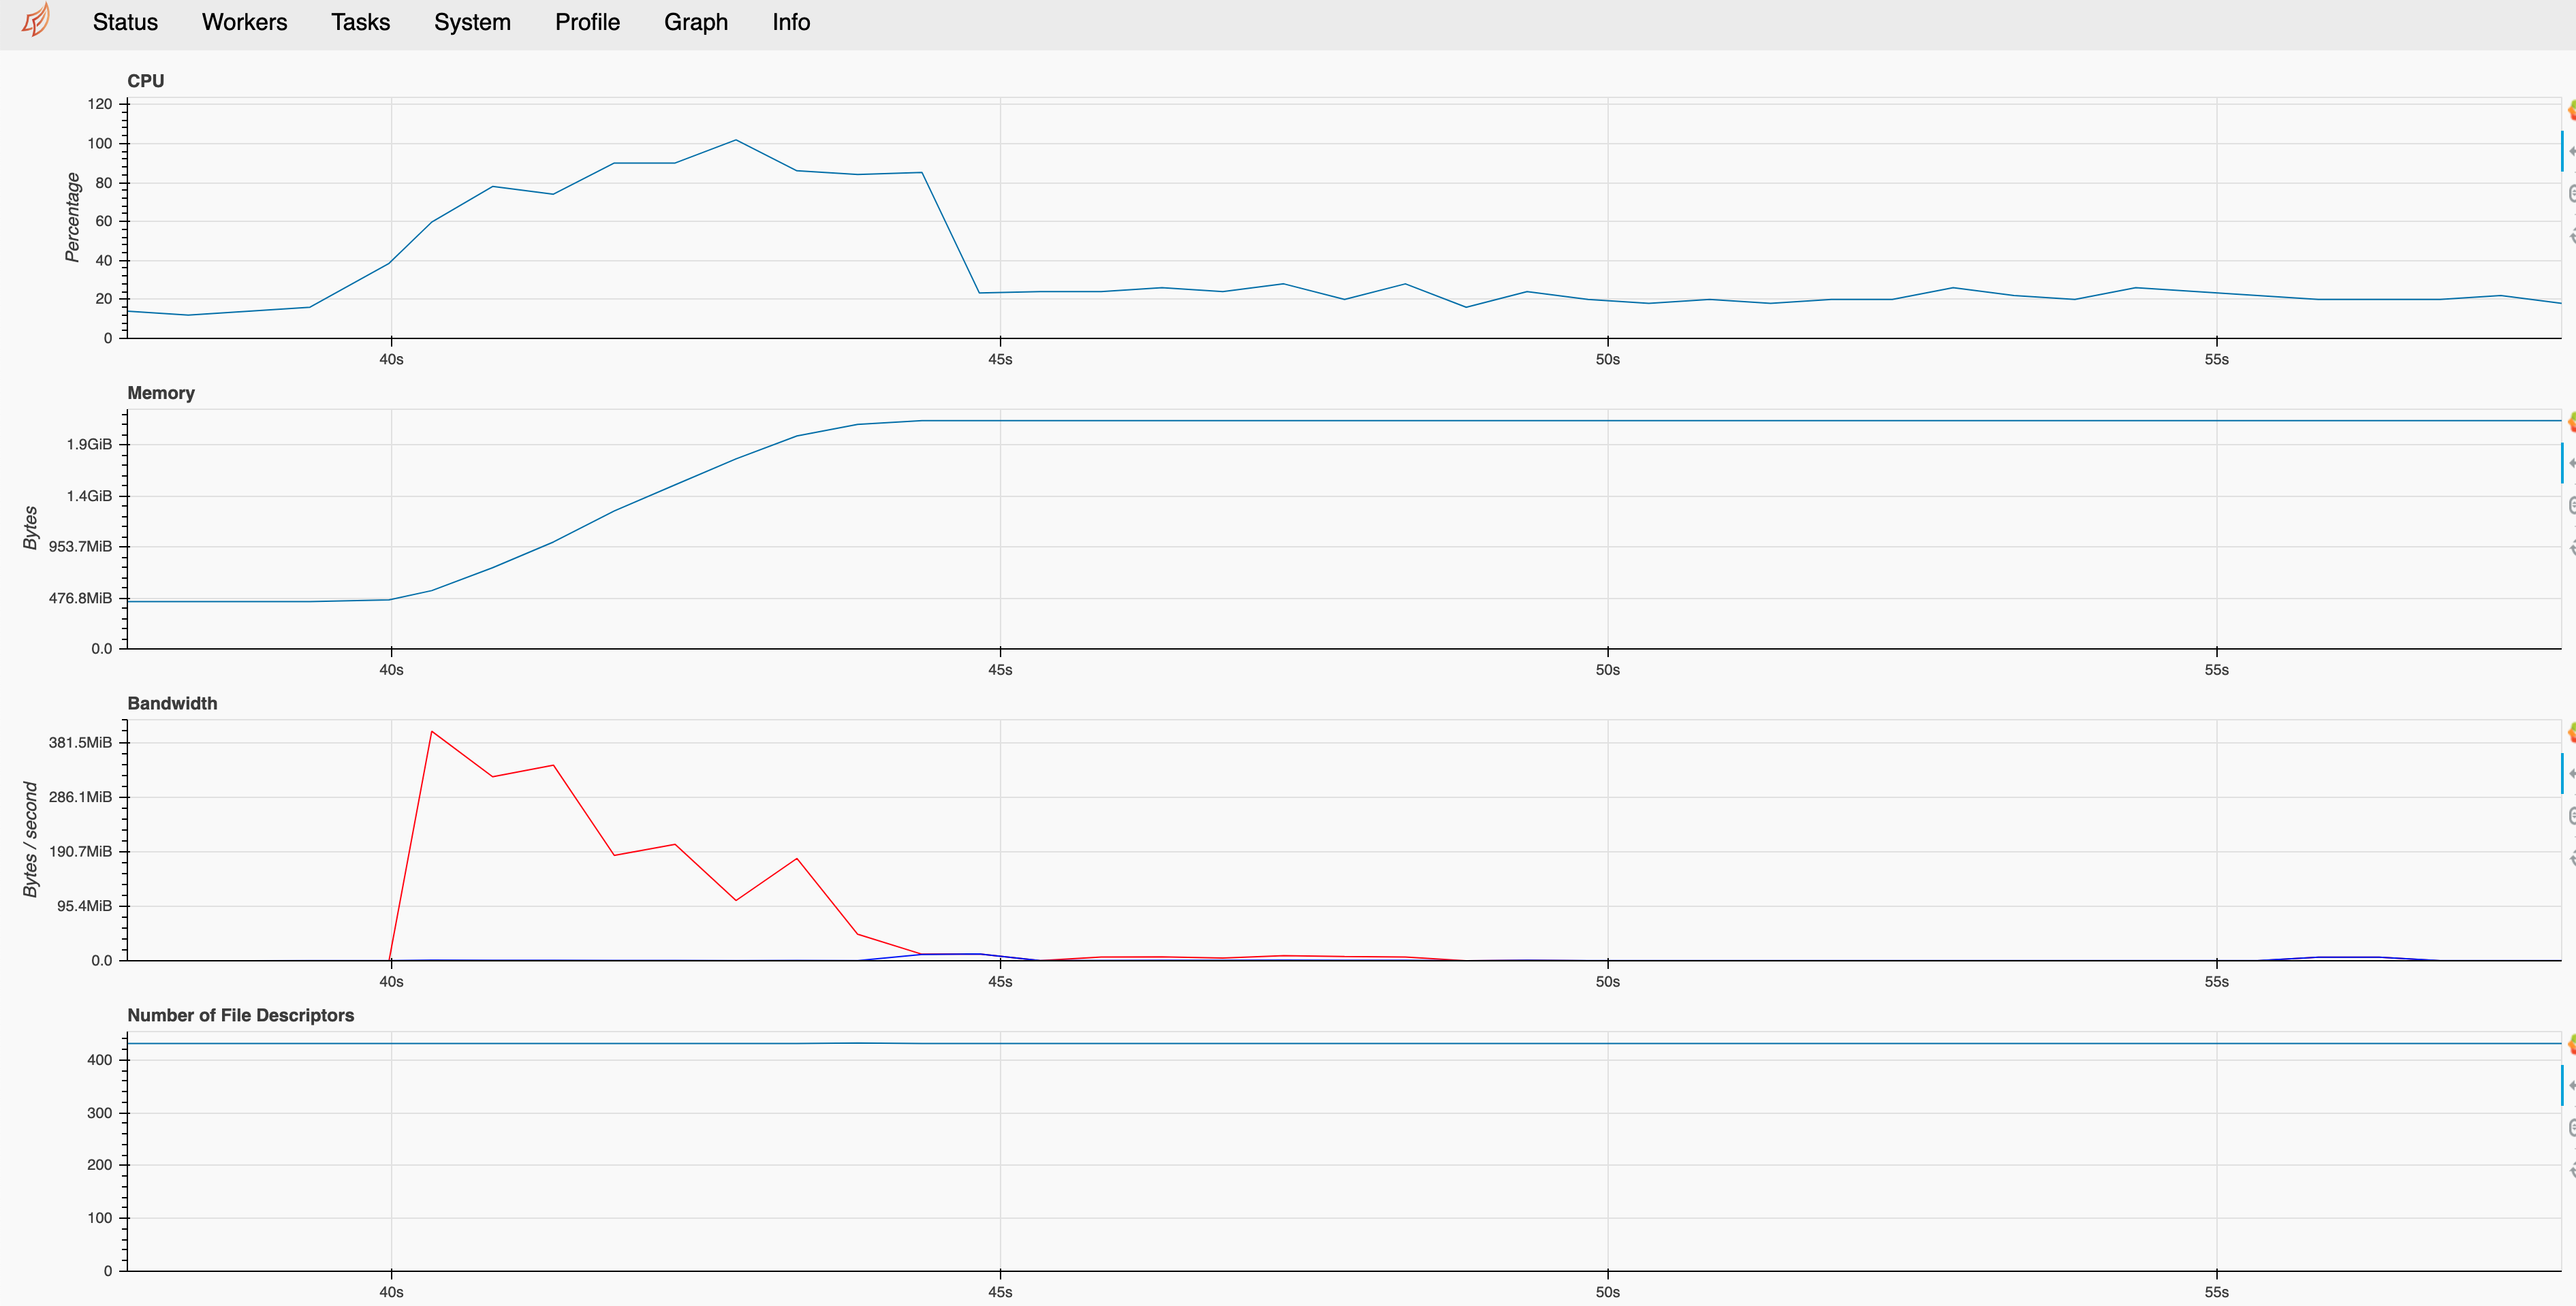
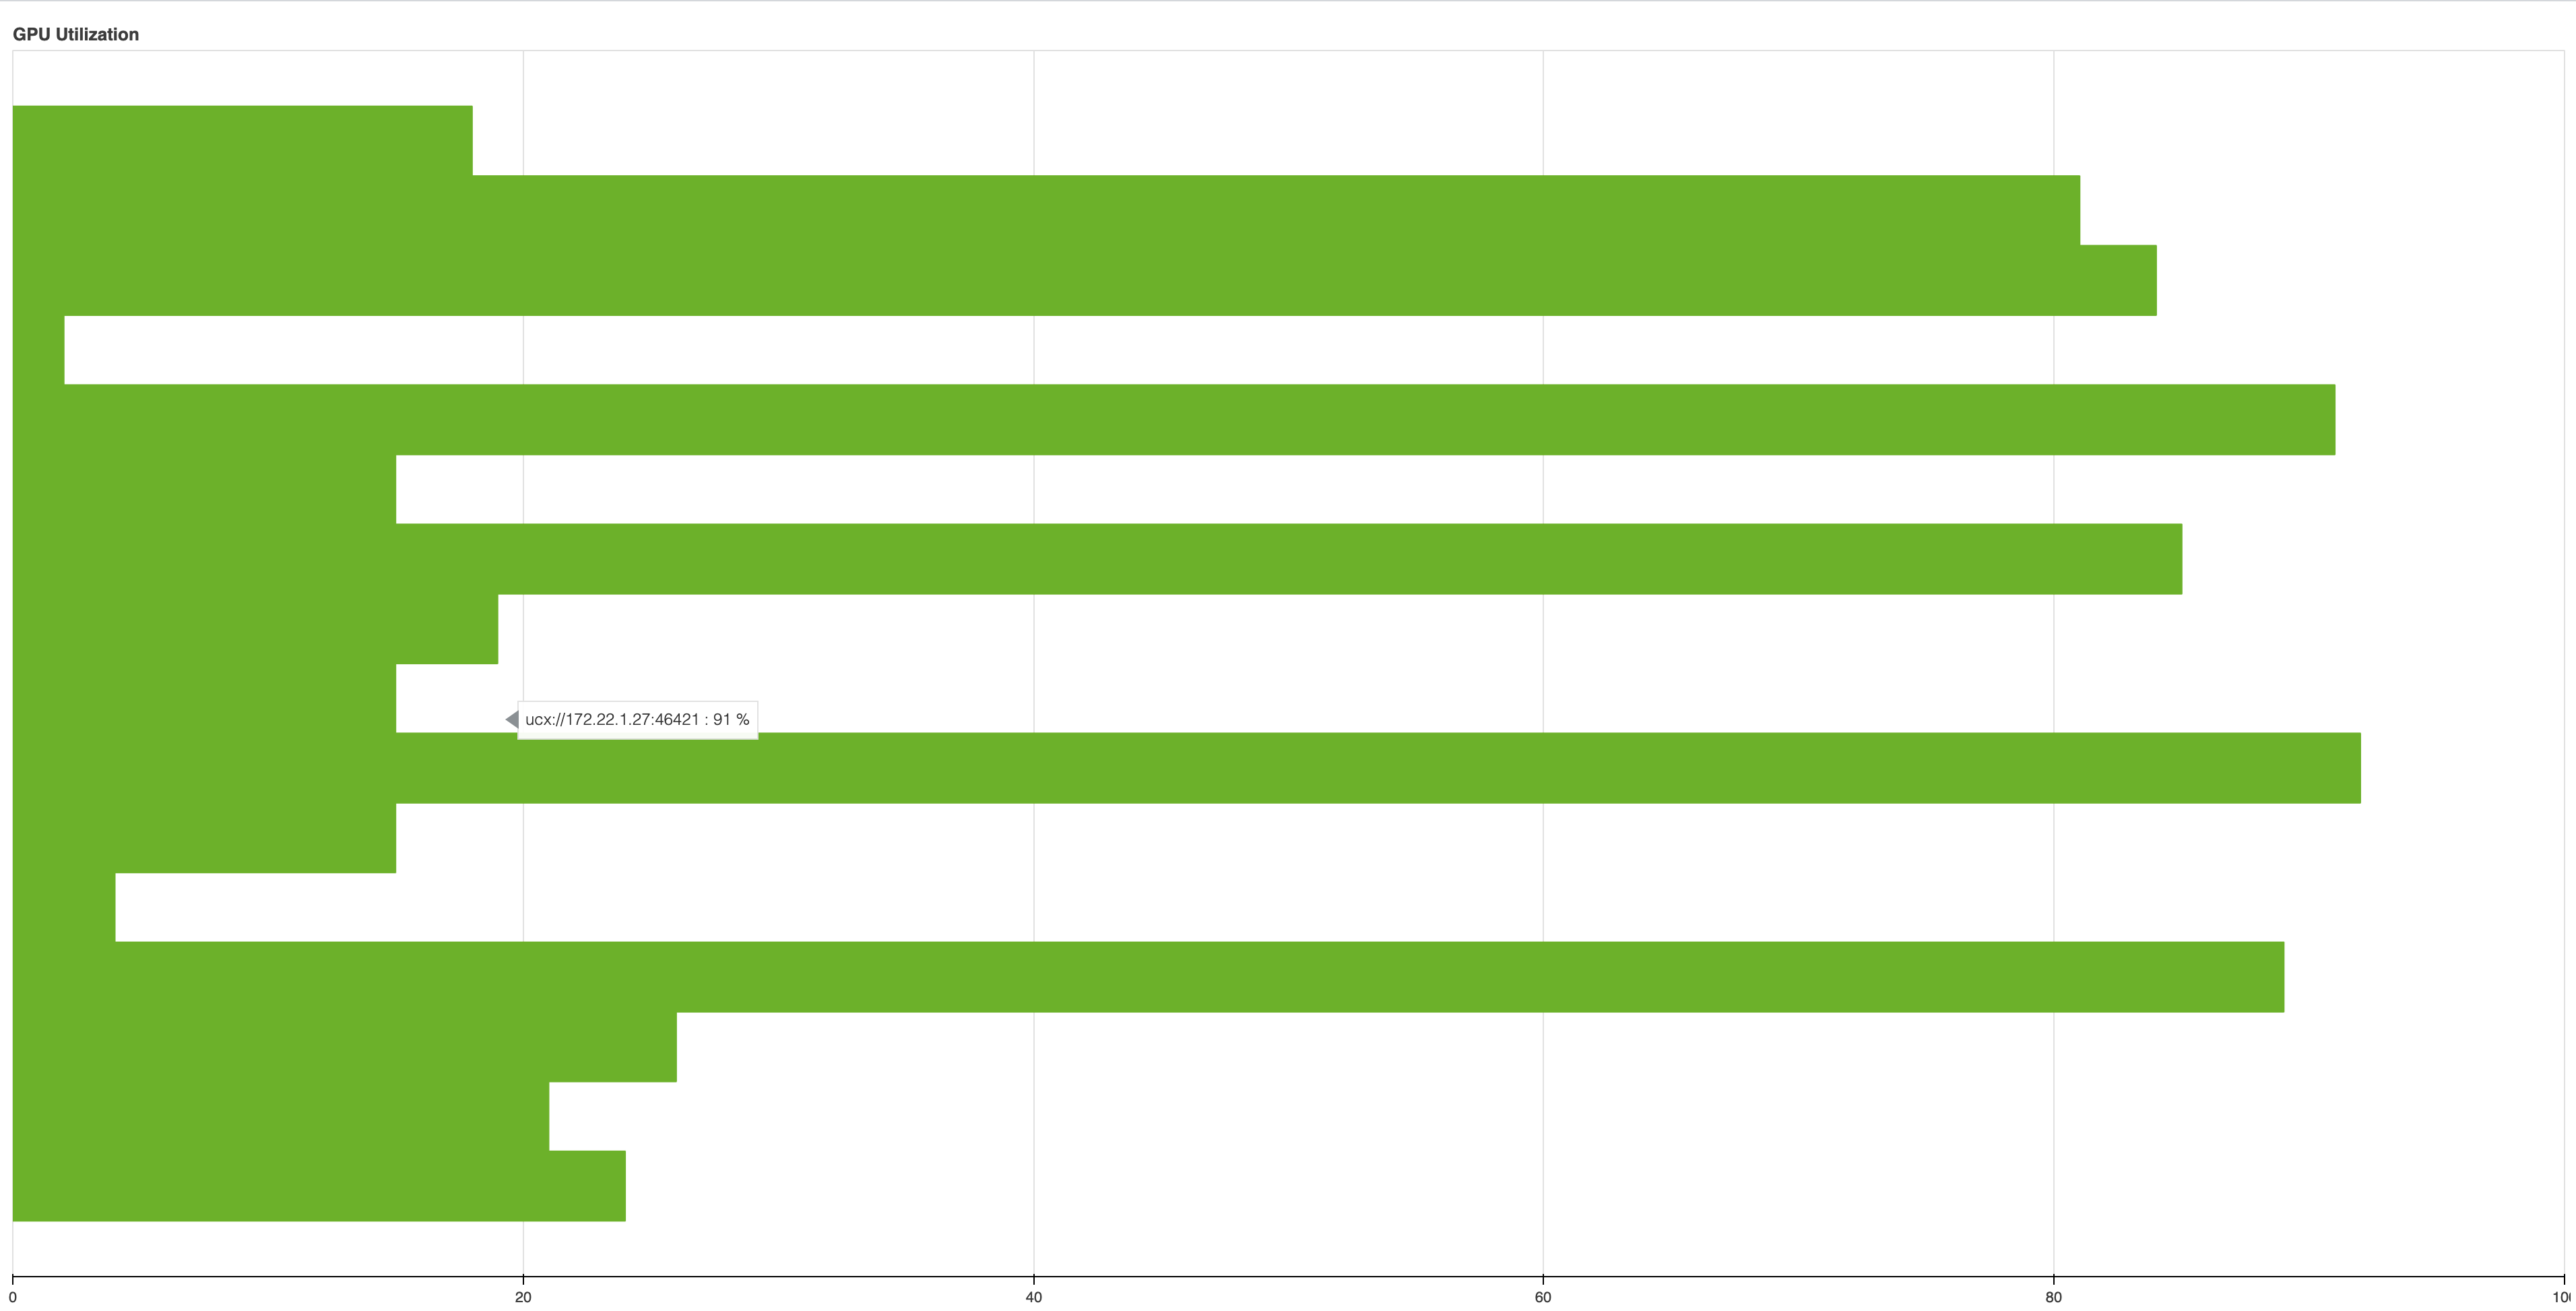
In Dask's dashboards we have good live tracking of many system resources including: CPU Utilization, Memory, Bandwidth, Num FDs, GPU Utilization, and GPU Memory:
Examples of Resource Tracking
Some times however, we want to ask questions of a workflow like what was the peak memory usage ? What was the CPU/GPU utilization like over the course of a query ? In trying to answer these and other questions, I think it would beneficial for this information to be include in performance reports. Not sure how best to build this. Perhaps starting with a generic timeseries tracking plot which sampled a resource. My first thought about attacking this problem was using a scheduler plugin for timeseries tracking which created a periodic callback to sample a particular resource.
We could also use TaskState Metadata for storing resource usage information
Here is a list of endpoints the scheduler is aware of:
https://github.com/dask/distributed/blob/7d2a22f94332974825e599dd779b4d98f44dbca2/distributed/dashboard/scheduler.py#L82-L92
 quasiben
All 7 comments
Would adding a new tab to the performance report which contains the "System" plot from the dashboard be a good start?
My first thought about attacking this problem was using a scheduler plugin for timeseries tracking which created a periodic callback to sample a particular resource
We might try hooking into the existing SystemMonitor periodic callback which runs on the scheduler and workers
 jrbourbeau
on 10 Feb 2021
jrbourbeau
on 10 Feb 2021
Would adding a new tab to the performance report which contains the "System" plot from the dashboard be a good start?
Made a quick attempt at this:
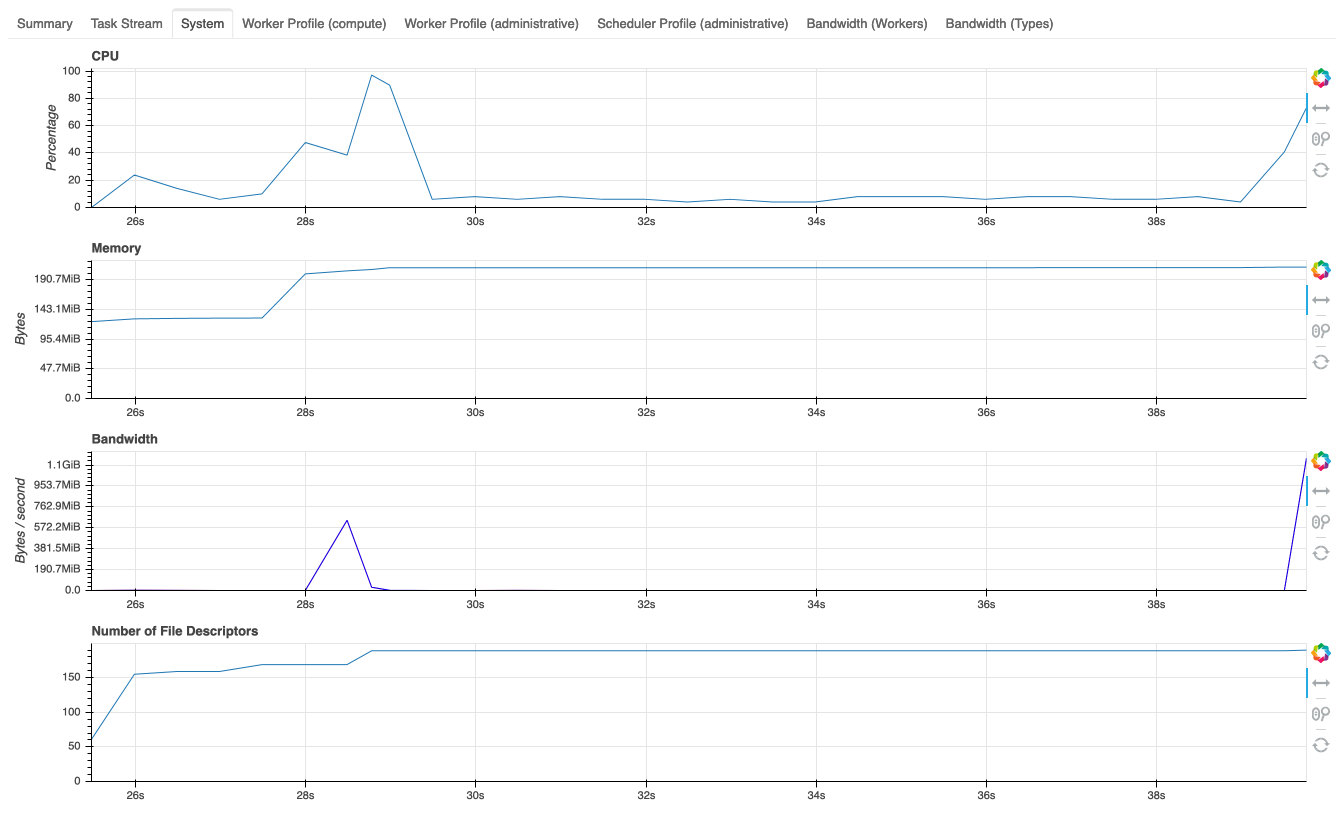
Pretty new to working with the dashboard so not really sure how to set the start time to when the performance report was called.
I think a time series could also be a useful means of live tracking for GPU memory/utilization, but for cases where a large amount of workers makes a plot like this unreadable or where we are only interested in aggregated stats like mean or max usage, would something like the dashboard's "Workers" tab make sense? It could contain a sortable view of these aggregations and, if possible, some info about the operations associated with them (e.g. what operation was a worker running when it was at peak memory usage).
 charlesbluca
on 4 Mar 2021
charlesbluca
on 4 Mar 2021
Opened up a PR #4561 for this.
charlesbluca
on 4 Mar 2021
While #4561 is being reviewed, I've been working on adding aggregated stats to the worker tab in their own table:
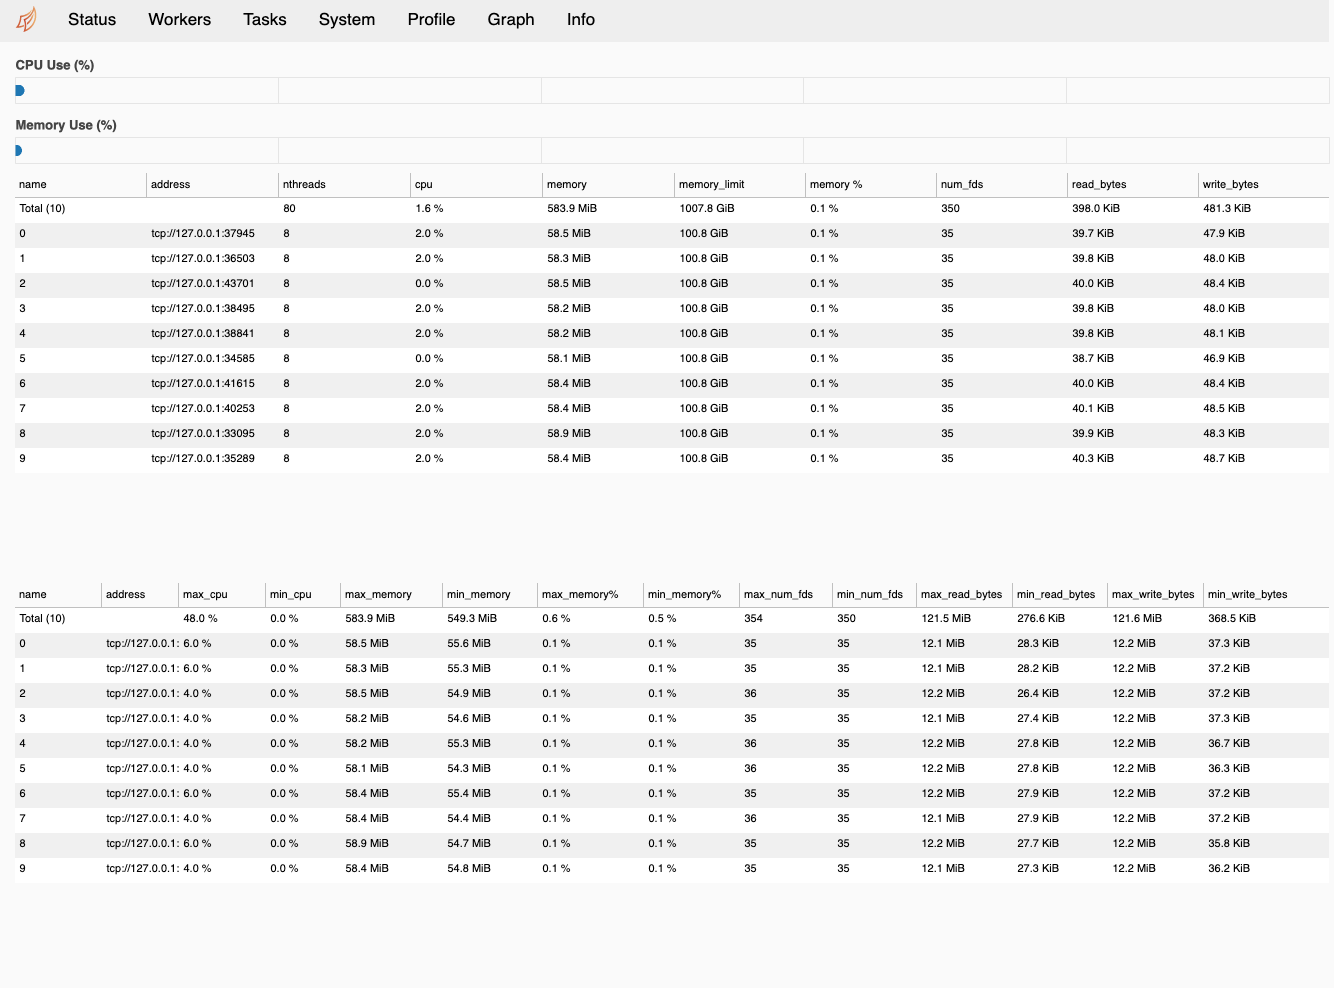
Though it works fine, I'm not sure if this is the best way to showcase these stats; the table being separate from the "live" metrics makes it harder to parse, and it's pretty crowded with only 2 of the 3 relevant stats we were considering.
Regardless, this info would probably be useful within the context of a performance report, so I'll open up a PR for that.
charlesbluca
on 19 Mar 2021
Opened up a PR for this #4614
charlesbluca
on 19 Mar 2021
Currently working on what I initially suggested, a time series view of the GPU memory/utilization:
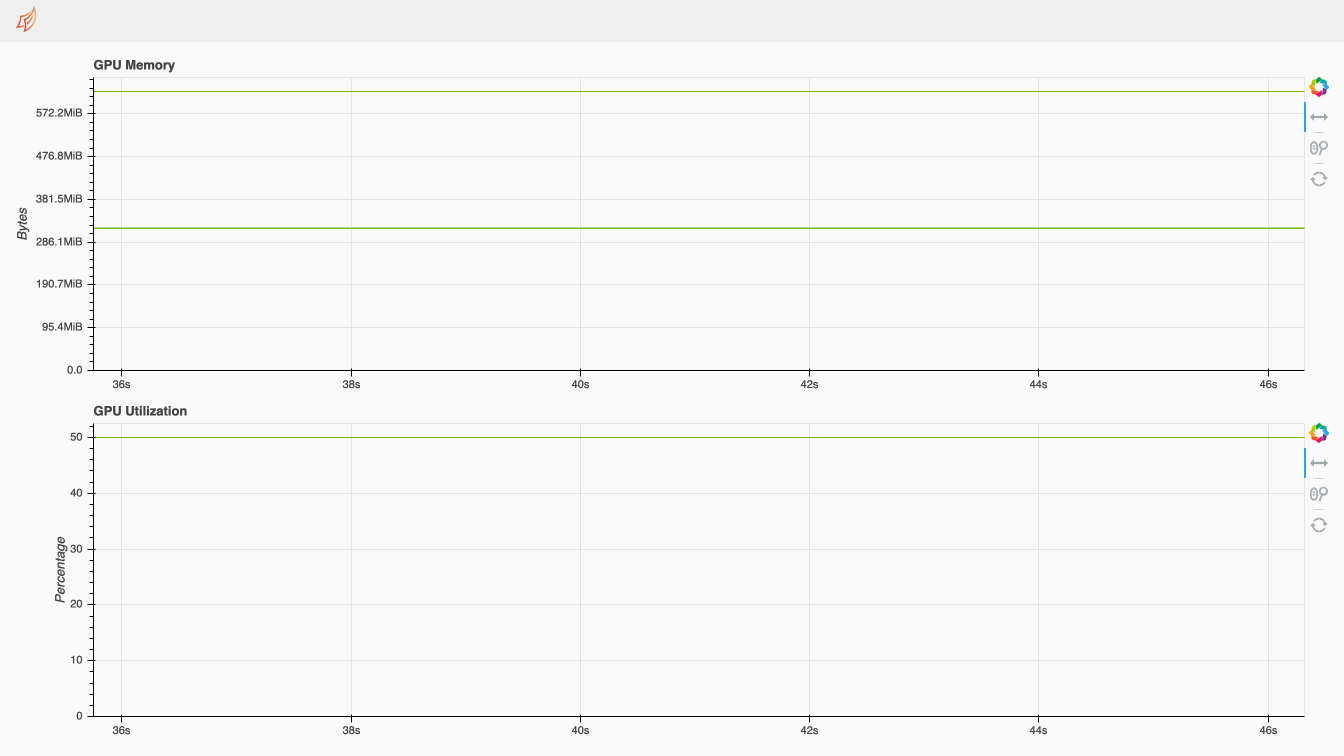
While this works fine in the dashboard, it's limited because data points must be collected within the component themselves (the workers only contain metrics for one fixed point in time); this means that whenever this page is reloaded, the plot resets. It also means that putting something like this in the perf report would only be possible if the associated dashboard component is loaded when the perf report is started; otherwise, data collection would only start after the profiled operation is completed.
I think per-worker monitors (similar to the scheduler's SystemMonitor) keeping a backlog of worker metrics could be a good solution for this.
EDIT:
The workers do actually have this monitoring happening, though it is only accessible through the worker object itself - is there any way we could expose these monitors to the scheduler so they could be used for dashboard components?
charlesbluca
on 23 Mar 2021
I opened up an issue relating to my question on the worker monitors - #4630.
I think that if we had the worker system monitors readily accessible from the scheduler object, along with some additions to the system monitor itself to track GPU resources if they're available, we could pretty easily put together something like the System plot for the workers (with optional plots of GPU memory/utilization).
Then, the issue could be simplified to how we want to show aggregated stats - as something integrated in the plots (like a label or hover tool), or a standalone table.
charlesbluca
on 24 Mar 2021
Related issues
 macks22
·
7Comments
macks22
·
7Comments
 mrocklin
·
6Comments
mrocklin
·
6Comments
 muammar
·
6Comments
muammar
·
6Comments
 DPeterK
·
3Comments
DPeterK
·
3Comments
 Iroy30
·
7Comments
Iroy30
·
7Comments
Most helpful comment
Opened up a PR #4561 for this.