Distributed: Profiling Scheduler Performance
When running Dask with TLS security turned on, the scheduler can easily become bottlenecked by SSL communication. See the performance report below, in particular the "Scheduler Profile" tab.
I ran this on my laptop with the following code
import dask
from dask.distributed import Client, performance_report, wait

client = Client(security=True)

dask.config.set({"optimization.fuse.active": False})

df = dask.datasets.timeseries(start="2020-01-01", end="2020-01-31", partition_freq="1h", freq="60s").persist()

with performance_report("report.html"):
    df2 = df.set_index("x").persist()
    wait(df2)
When this is run on a larger cluster with many workers this problem becomes significantly worse. What are some ways that we can reduce the cost of secure communication?
 mrocklin
All 82 comments
Hrm, here is another performance report for when security is turned off. Tornado is still a significant cost.
mrocklin
on 19 Jan 2021
OK, I think that this is just down to python's socket.send costs.
I put a timer around the socket.send calls in tornado/iostream.py and came away with
3.37 s / 10764 = 313.11 us
We're spending 300-500us per call and making lots of calls. I can try to batch things a little bit on the worker side but that will only give us a factor increase. I'm curious how we can take communication overhead off of the main thread.
For reference, I got these numbers by instrumenting Tornado in the following way
diff --git a/tornado/iostream.py b/tornado/iostream.py
index 768b404b..f3d000bc 100644
--- a/tornado/iostream.py
+++ b/tornado/iostream.py
@@ -81,6 +81,38 @@ if sys.platform == "darwin":
 _WINDOWS = sys.platform.startswith("win")


+
+import contextlib
+from collections import defaultdict
+from time import time
+from dask.utils import format_time
+
+total_time_data = defaultdict(float)
+counts_data = defaultdict(int)
+
+
[email protected]
+def duration(name: str) -> None:
+    start = time()
+
+    yield
+
+    stop = time()
+
+    total_time_data[name] += stop - start
+    counts_data[name] += 1
+
+
+import atexit
+
[email protected]
+def _():
+    for name in total_time_data:
+        duration = total_time_data[name]
+        count = counts_data[name]
+        print(name, format_time(duration), "/", count, "=", format_time(duration / count))
+
+
 class StreamClosedError(IOError):
     """Exception raised by `IOStream` methods when the stream is closed.

@@ -1144,7 +1176,8 @@ class IOStream(BaseIOStream):

     def write_to_fd(self, data: memoryview) -> int:
         try:
-            return self.socket.send(data)  # type: ignore
+            with duration("send"):
+                return self.socket.send(data)  # type: ignore
         finally:
             # Avoid keeping to data, which can be a memoryview.
             # See https://github.com/tornadoweb/tornado/pull/2008
@@ -1564,7 +1597,8 @@ class SSLIOStream(IOStream):

     def write_to_fd(self, data: memoryview) -> int:
         try:
-            return self.socket.send(data)  # type: ignore
+            with duration("send"):
+                return self.socket.send(data)  # type: ignore
         except ssl.SSLError as e:
             if e.args[0] == ssl.SSL_ERROR_WANT_WRITE:
                 # In Python 3.5+, SSLSocket.send raises a WANT_WRITE error if
@pitrou do you have thoughts here on if it is possible to avoid this 300us cost ?
mrocklin
on 20 Jan 2021
Do you witness different numbers when TLS is turned off?
 pitrou
on 20 Jan 2021
pitrou
on 20 Jan 2021
Also, to get a better idea of what's happening, can you print all deciles rather than simply the average? The actual distribution should be insightful.
pitrou
on 20 Jan 2021
Oh, and account IOStream and SSLIOStream durations separately!
pitrou
on 20 Jan 2021
These numbers are actually with SSL turned off. I realize now that the title of the issue is confusing. I realized when diving into this that this is slow with normal TCP without security, so I've focused on that for now.
And yes, I'll get deciles shortly.
mrocklin
on 20 Jan 2021
If SSL is turned off and this is a non-blocking socket (as it should be, since we're using Tornado), then the only reasonable explanation is GIL-induced measurement bias. The quantiles should probably help validate this hypothesis.
pitrou
on 20 Jan 2021
send : 10562 events
0.01 %:  0.95 us
25.0 %:  20.98 us
50.0 %:  35.52 us
75.0 %:  47.21 us
99.9 %:  18.56 ms
This is surprising though. I would expect the 50% value to be around 300us. I'm double-checking the instrumentation.
mrocklin
on 20 Jan 2021
I'm not surprised. Most calls are quite fast (it's just a non-blocking system call). A small fraction of the calls have to wait for the GIL before returning, and therefore take more than 10 ms.
pitrou
on 20 Jan 2021
In other words, you're just seeing the effects of the GIL on performance of a single thread in a multi-thread Python program. System calls like socket.send release the GIL so tend to attract GIL switches on them, which is why they can look so costly :-)
pitrou
on 20 Jan 2021
This tooling might be useful to better detect such situations:
https://www.maartenbreddels.com/perf/jupyter/python/tracing/gil/2021/01/14/Tracing-the-Python-GIL.html
cc @maartenbreddels
pitrou
on 20 Jan 2021
Yeah, you've mentioned that calls like socket.send are likely masking some other call before. I think that this is the first time that I fully understand what is going on. Seeing the quantiles helped me. Thank you for directing me to that.
I'm still left with the question of "what is taking time and making things slow?" I don't have much experience profiling code at this level when the GIL is involved. @maartenbreddels, any suggestions?
mrocklin
on 21 Jan 2021
I tried to reproduce it locally, but I get a wildly different report, dump of what I've done:
$ pip install distributed==2021.01.0
$ pip install dask==2020.12.0
$ dask-scheduler --host 0.0.0.0
$ dask-worker localhost:8786 --nthreads=3 --nprocs=4 --memory-limit=10G
import dask
from dask.distributed import Client, performance_report, wait


def main(args=None):
    client = Client('127.0.0.1:8786')

    dask.config.set({"optimization.fuse.active": False})

    df = dask.datasets.timeseries(start="2020-01-01", end="2020-01-31", partition_freq="1h", freq="60s").persist()
    with performance_report("report.html"):
        df2 = df.set_index("x").persist()
        wait(df2)

if __name__ == "__main__":
    main()


md5-239c3393efd14ca35eedb0618148c2c8


$ /usr/bin/time -v python use_case/dask-scheduler.py         dev
        Command being timed: "python use_case/dask-scheduler.py"
        User time (seconds): 2.02
        System time (seconds): 3.61
        Percent of CPU this job got: 21%
        Elapsed (wall clock) time (h:mm:ss or m:ss): 0:26.09
        Average shared text size (kbytes): 0
        Average unshared data size (kbytes): 0
        Average stack size (kbytes): 0
        Average total size (kbytes): 0
        Maximum resident set size (kbytes): 133176
        Average resident set size (kbytes): 0
        Major (requiring I/O) page faults: 0
        Minor (reclaiming a frame) page faults: 41883
        Voluntary context switches: 3903
        Involuntary context switches: 123225
        Swaps: 0
        File system inputs: 0
        File system outputs: 20776
        Socket messages sent: 0
        Socket messages received: 0
        Signals delivered: 0
        Page size (bytes): 4096
        Exit status: 0
Reults in:

Which shows >10x more tasks.
Am I doing something wrong here?
 maartenbreddels
on 21 Jan 2021
maartenbreddels
on 21 Jan 2021
A small fraction of the calls have to wait for the GIL before returning, and therefore take more than 10 ms.
@pitrou Just curious why you think 10ms, I'd guess 5ms from the default of sys.getswitchinterval
System calls like
socket.sendrelease the GIL so tend to attract GIL switches on them, which is why they can look so costly :-)
I've been thinking a bit what the best way is to describe why it is/looks so costly. Would you agree that it's not perse the GIL switch that is costly (e.g the thread context switch is relatively cheap), but that often releasing the GIL in a thread within 5ms, while other threads don't do that (like running pure Python code) will lead that thread too often having to wait for the GIL.
"what is taking time and making things slow?"
I think it is the attempt to return from the (Python) send function, which tries to obtain the GIL. The (Python) send function released the GIL, does the send syscall, which returns in 1us, but wanting to return to Python land, it first needs to acquire the GIL. If other threads are not as eager to release the GIL (such as pure Python code, which will do that only after 5ms, or a long running c-function that does not release the GIL), send will effectively take 5ms.
This is how I understand the situation described in https://bugs.python.org/issue7946 which I've went over a bit in https://github.com/maartenbreddels/fastblog/issues/3#issuecomment-760891430 (comment section of https://www.maartenbreddels.com/perf/jupyter/python/tracing/gil/2021/01/14/Tracing-the-Python-GIL.html )
I think giltracer might tell you if the picture painted here is correct, if that is the case, there are no good solutions I think. Workarounds/bandaids I can think of:
- call a GIL releasing function from the other threads (e.g
time.sleep(0)) to - call/change sys.setswitchinterval
Possibly you may be able to identify a c-function that does not release the GIL (unlikely), or you can make a strong case for doing a c-extension to work around this. This is actually the primary reason I build this tool and wrote the article, I want to make sure before building a C version of a ThreadPoolExector that it's worth it (and still not sure about it).
maartenbreddels
on 21 Jan 2021
@pitrou Just curious why you think 10ms, I'd guess 5ms from the default of sys.getswitchinterval
Hmm, yes, you're right. I was thinking about the typical OS timeslice.
Would you agree that it's not perse the GIL switch that is costly (e.g the thread context switch is relatively cheap), but that often releasing the GIL in a thread within 5ms, while other threads don't do that (like running pure Python code) will lead that thread too often having to wait for the GIL.
I don't know if it's "too often". It depends what other threads are doing too. The distribution of durations can tell us how "often" that happens.
there are no good solutions I think
Before finding solutions, one would have to ask the question "does this need solving?". Even if you find ways to balance scheduling between the two Python threads (the one that does IO and the one that runs pure Python code), you'll still be executing the same workload in the same process execution time, just ordered differently.
So the question is: would it improve your overall performance (for example by providing data earlier to other nodes) if you managed to prioritize IO calls before pure Python code in the scheduler process?
pitrou
on 21 Jan 2021
I tried to reproduce it locally, but I get a wildly different report, dump of what I've done:
Yes, when I produced the original performance reports I forgot to call wait(df2) inside of the performance_report context manager. I fixed this so that when others ran the example they would get correct results, but I didn't update my wrong results in the links. Your results are more correct.
With regards to thread switching I'm not sure I understand what is happening. My understanding from what I read above is that if you have two threads trading off the GIL there is a multi-millisecond delay in handing off the GIL. This would surprise me. I generally expect lock-style objects to engage in 10us or so in Python. Why would the GIL be so much slower?
Before finding solutions, one would have to ask the question "does this need solving?". Even if you find ways to balance scheduling between the two Python threads (the one that does IO and the one that runs pure Python code), you'll still be executing the same workload in the same process execution time, just ordered differently.
Even if this doesn't improve performance I'm very curious about what would improve performance. I care as much about visibility here as anything else. People today are very curious about how to make the scheduler run faster. They're happy to pour engineering resources into it. Currently they're targetting various aspects of the scheduler, but I'm not confident that we're working in the right place. I am searching for more visibility into what is taking up time.
Another thing we could do here, if it would help, is try to keep the scheduler single-threaded. Currently we intentionally offload compression/decompression to a separate thread. To me this seems like a good idea, but that's because I assumed that engaging multiple threads didn't cause significant GIL issues. The 5-10ms number above has me confused (it's way higher than I would have expected). Would keeping things single-threaded improve performance and/or visibility?
mrocklin
on 21 Jan 2021
My understanding from what I read above is that if you have two threads trading off the GIL there is a multi-millisecond delay in handing off the GIL.
Releasing the GIL is fast. Acquiring the GIL can lead to waits if the GIL is already held by someone else, which is what is being witnessed here :-)
What socket.send does is:
- release the GIL (fast)
- call the system call
send()to put data on the TCP buffer (medium-fast? a system call is not costless, and depending on the data size the copy may be slightly expensive as well) - acquire the GIL (slow if need to wait for some other thread to release it!)
Even if this doesn't improve performance I'm very curious about what would improve performance.
My opinion is that it would need one or both of these things:
- try to vectorize the scheduling algorithm (as discussed on another issue)
- rewrite the scheduler in another language such as Rust
Both things obviously non-trivial...
By the way, given the amount of time that's regularly been consumed in investigating scheduler performance issues (or perceived as such), perhaps the "write in another language" possibility should be explored seriously.
The 5-10ms number above has me confused (it's way higher than I would have expected). Would keeping things single-threaded improve performance and/or visibility?
It would certainly make things easier to understand, but also would give worse performance. Offloading compression probably benefits overall performance, but also makes it slightly less predictable.
pitrou
on 21 Jan 2021
try to vectorize the scheduling algorithm (as discussed on another issue)
Yeah, I don't think this is feasible given Dask's execution model.
rewrite the scheduler in another language such as Rust
We're currently using Cython (you might find this work interesting, see recent PRs from @jakirkham). If we need to go to C++ we're open to that, and the state machine logic is being isolated with this option in mind.
However I'm also not convinced that that logic is the slow part of the system. I am comfortable rewriting in C++ if necessary, but I want to avoid the situation where we do that, and then find that it's not significantly faster. John has been able to increase the performance of the tricky scheduling logic considerably (the stuff that I would expect to be slow in Python) but this hasn't resulted in significant performance improvements overall, which has me concerned.
I'm open to moving to a lower level language, but I first want to understand the scope of code that we need to move over to have a good effect.
mrocklin
on 21 Jan 2021
However I'm also not convinced that that logic is the slow part of the system.
I didn't mean that. There's probably no obvious hot spot (which is why an entire rewrite may be the solution, rather than some select optimizations in Cython).
pitrou
on 21 Jan 2021
There are two options for the scheduler, I think:
- Rewrite everything in C++
- Keep the networking and event management in Python, and rewrite only the scheduling logic in C++
Option 2 would be nice, if it makes sense.
mrocklin
on 21 Jan 2021
My intuition is that the "death of a thousand cuts" that's the main performance limiter applies as much to the networking and event management as to the core scheduling logic.
But don't take my word for it, I haven't tried to profile the dask scheduler in years.
pitrou
on 21 Jan 2021
Adding @jcrist , who might find this conversation interesting. I think that he was looking at efficient Python networking recently.
mrocklin
on 21 Jan 2021
Well one observation I've shared with Ben and maybe you as well is within the Scheduler there are a bunch of sends in transitions themselves. PR ( https://github.com/dask/distributed/pull/4365 ) fixes that by moving the sends out of the transitions and grouping them together. IDK if it would help the issues identified here, but I do think grouping communication a bit more closely together may generally be helpful regardless of what we do next.
Another thing to consider is that when we send a serialized message currently we do a few sends. First to tell how many buffers need to be sent. Next how big those buffers are (with UCX we also include whether they are on the CPU or GPU). Finally the buffers themselves. We may want to figure out how we can aggregate all of these into one message. Admittedly it's not entirely clear how one would do this with TCP. I believe (but could be wrong about this) there is a way to do this with UCX.
 jakirkham
on 21 Jan 2021
jakirkham
on 21 Jan 2021
I do think grouping communication a bit more closely together may generally be helpful regardless of what we do next.
Agreed.
Another thing to consider is that when we send a serialized message currently we do a few sends.
Does IOStream buffer writes internally? I don't remember.
pitrou
on 21 Jan 2021
Sorry responded too quickly. I think we are doing the buffering with BatchedSend. Not sure if Tornado does some buffering as well. Though I must admit that part of the code I don't understand that well 😅
Forgot to add that Scheduler messages themselves usually have a simpler form and so don't necessarily need to be serialized as if they were something more complex (like a DataFrame or Array). Maybe we can exploit this when sending? Some thoughts on that in issue ( https://github.com/dask/distributed/issues/4376 ).
jakirkham
on 21 Jan 2021
Results from running with you ref_trans2 branch . No strong difference or information here, but I did start adding some more detail in the higher quantiles.
send : 15056 events
total 4.61 s
average 305.99 us

0.01 %:  0.95 us
25.0 %:  26.70 us
50.0 %:  37.19 us
75.0 %:  50.07 us
90.0 %:  196.58 us
99.0 %:  6.74 ms
99.9 %:  19.10 ms
Right, so it might make sense to start looking into protecting calling socket.send a ton. However what I'm really learning from this exercise is that socket.send isn't the problem, but rather that there is something else happening on another thread that we need to identify. I can get my laptop to spend 50% of its time on socket.send. I _think_ that this means that some other activity that we don't understand is taking up 50% of our schedulign time.
I've turned off offloading to a separate thread for this. Something else is still going on.
mrocklin
on 21 Jan 2021
Did that include Cythonizing it or merely run it as Python?
jakirkham
on 21 Jan 2021
Just Python for now
mrocklin
on 21 Jan 2021
I am comfortable rewriting in C++ if necessary, but I want to avoid the situation where we do that, and then find that it's not significantly faster.
That was the main motivation for the per4m/giltracer experiment, to make more educated decisions on what in Vaex to move to C++ .
I ran the scheduler under giltracer, and my first impression is that the GIL doesn't seem to be a large issue for the scheduler:
PID        total(us)    no gil%✅    has gil%❗    gil wait%❌
-------  -----------  -----------  ------------  -------------
317188*   37572004.8         61.5          37.9            0.7
317278    37514923.8         90.3           0.6            9.1
317813    32484556.5         99.9           0.0            0.1
317814    32483914.5         99.8           0.0            0.1
1 thread needs to wait for the GIL a bit it seems, but I doubt it's a massive issue.
viztracer shows a lot of waiting:
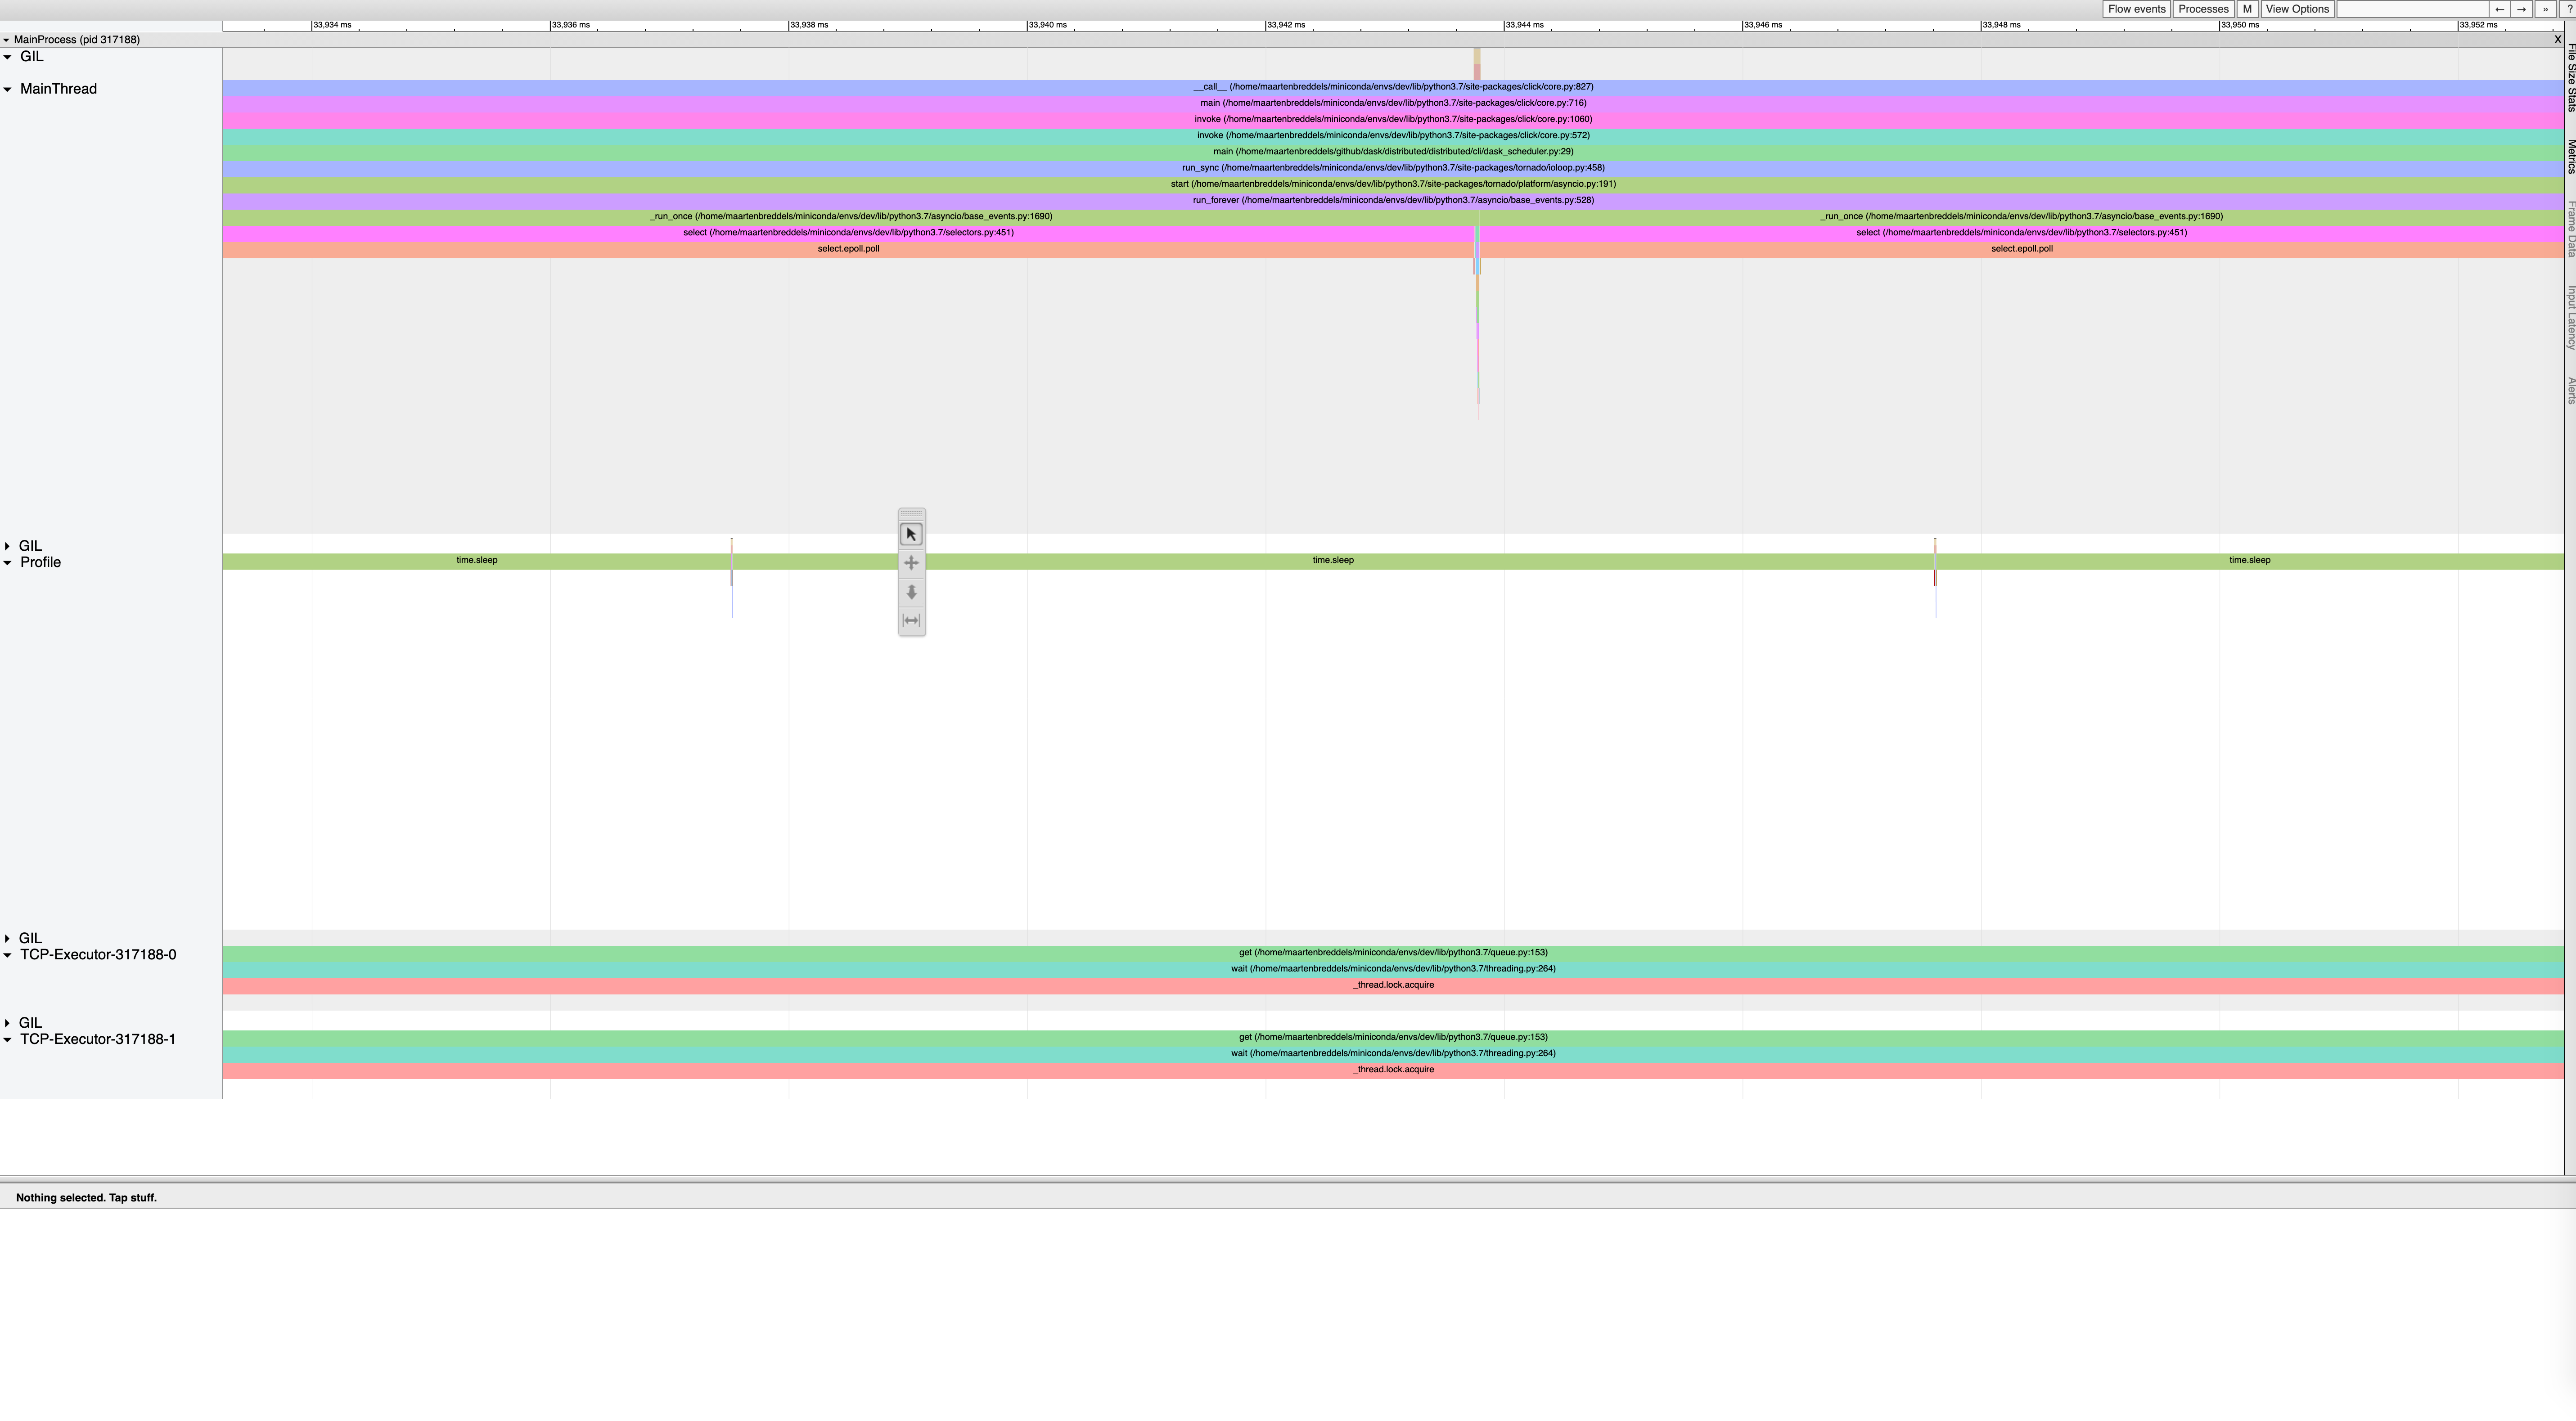
with more zoom-in where the main thread waits for the GIL:

and another zoom-in (where a thread waits):
I also only count 400 send calls in the scheduler.
From what I see (just a quick look), I doubt the scheduler is the bottleneck here. Also, I see recognize https://github.com/tornadoweb/tornado/pull/2955 in the output:

maartenbreddels
on 21 Jan 2021
Hrm, I'll have to admit that I don't fully understand the output of these charts.
@maartenbreddels it sounds like you might have some profiling/optimization expertise here. If you have any interest in a high bandwidth conversation on this topic I would welcome that.
mrocklin
on 21 Jan 2021
Thus far those profiles confirm my suspicion that we are spending too long transforming status messages on the Scheduler, which could be avoided by an approach like the one discussed in issue ( https://github.com/dask/distributed/issues/4376 ).
jakirkham
on 21 Jan 2021
Happy to talk, but ignoring giltracer (since I doubt the GIL is an issue), viztracer itself is quite low barrier and intuitive:
$ pip install viztracer
$ viztracer -m distributed.cli.dask_scheduler
ctrl-c it when done, and open the HTML (or generate a JSON with -o sched.json and load the JSON in chrome://tracing )
Otherwise feel free to reach out to [email protected]
maartenbreddels
on 21 Jan 2021
Checking it out now. Thanks.
mrocklin
on 21 Jan 2021
Note that viztracer uses a circular buffer, and it warned me some messages got lost (the first ones), so if the problem is only present at the beginning of the program, I was mostly blind to that. When using a tracer (unlike a profiler), you'd like to keep your execution time low.
maartenbreddels
on 21 Jan 2021
Is the size of that buffer configurable?
jakirkham
on 21 Jan 2021
It's fine, the latter part of the computation is what we care about, and it's pretty uniform.
mrocklin
on 21 Jan 2021
Yes, it will warn and tell you:
Circular buffer is full, you lost some early data, but you still have the most recent data.
    If you need more buffer, use "viztracer --tracer_entries <entry_number>(current: 1000000)"
    Or, you can try the filter options to filter out some data you don't need
    use --quiet to shut me up
Some interesting things that might be useful
--ignore_frozenwill avoid a lot of noise https://github.com/gaogaotiantian/viztracer/issues/81- viztracer uses this clock: https://github.com/gaogaotiantian/viztracer/blob/3321ba4024afe5623f938a601d7f7db3b08f534d/src/viztracer/modules/snaptrace.c#L91 (CLOCK_MONOTONIC ) you can easily generate an extra JSON with this format https://docs.google.com/document/d/1CvAClvFfyA5R-PhYUmn5OOQtYMH4h6I0nSsKchNAySU/preview to annotate the output with high level information (like I do with the GIL information)
- combine outputs using
viztracer --combine one.json two.json -o result.html - if combining outputs from multiple machines (different clocks), there should be a way to sync the clocks (mentioned in the above document).
maartenbreddels
on 21 Jan 2021
I'm really liking viztracer. Thank you for pointing it out to me. This is great.
mrocklin
on 21 Jan 2021
Some summary statistics that @jakirkham may find interesting
socket.send is still top there, and I still don't know why. There is no other thread that is active here. Maybe other system calls that are slowing things down?
mrocklin
on 21 Jan 2021
So, going back to socket.send for a moment, I'm not seeing anything overlapping with these calls
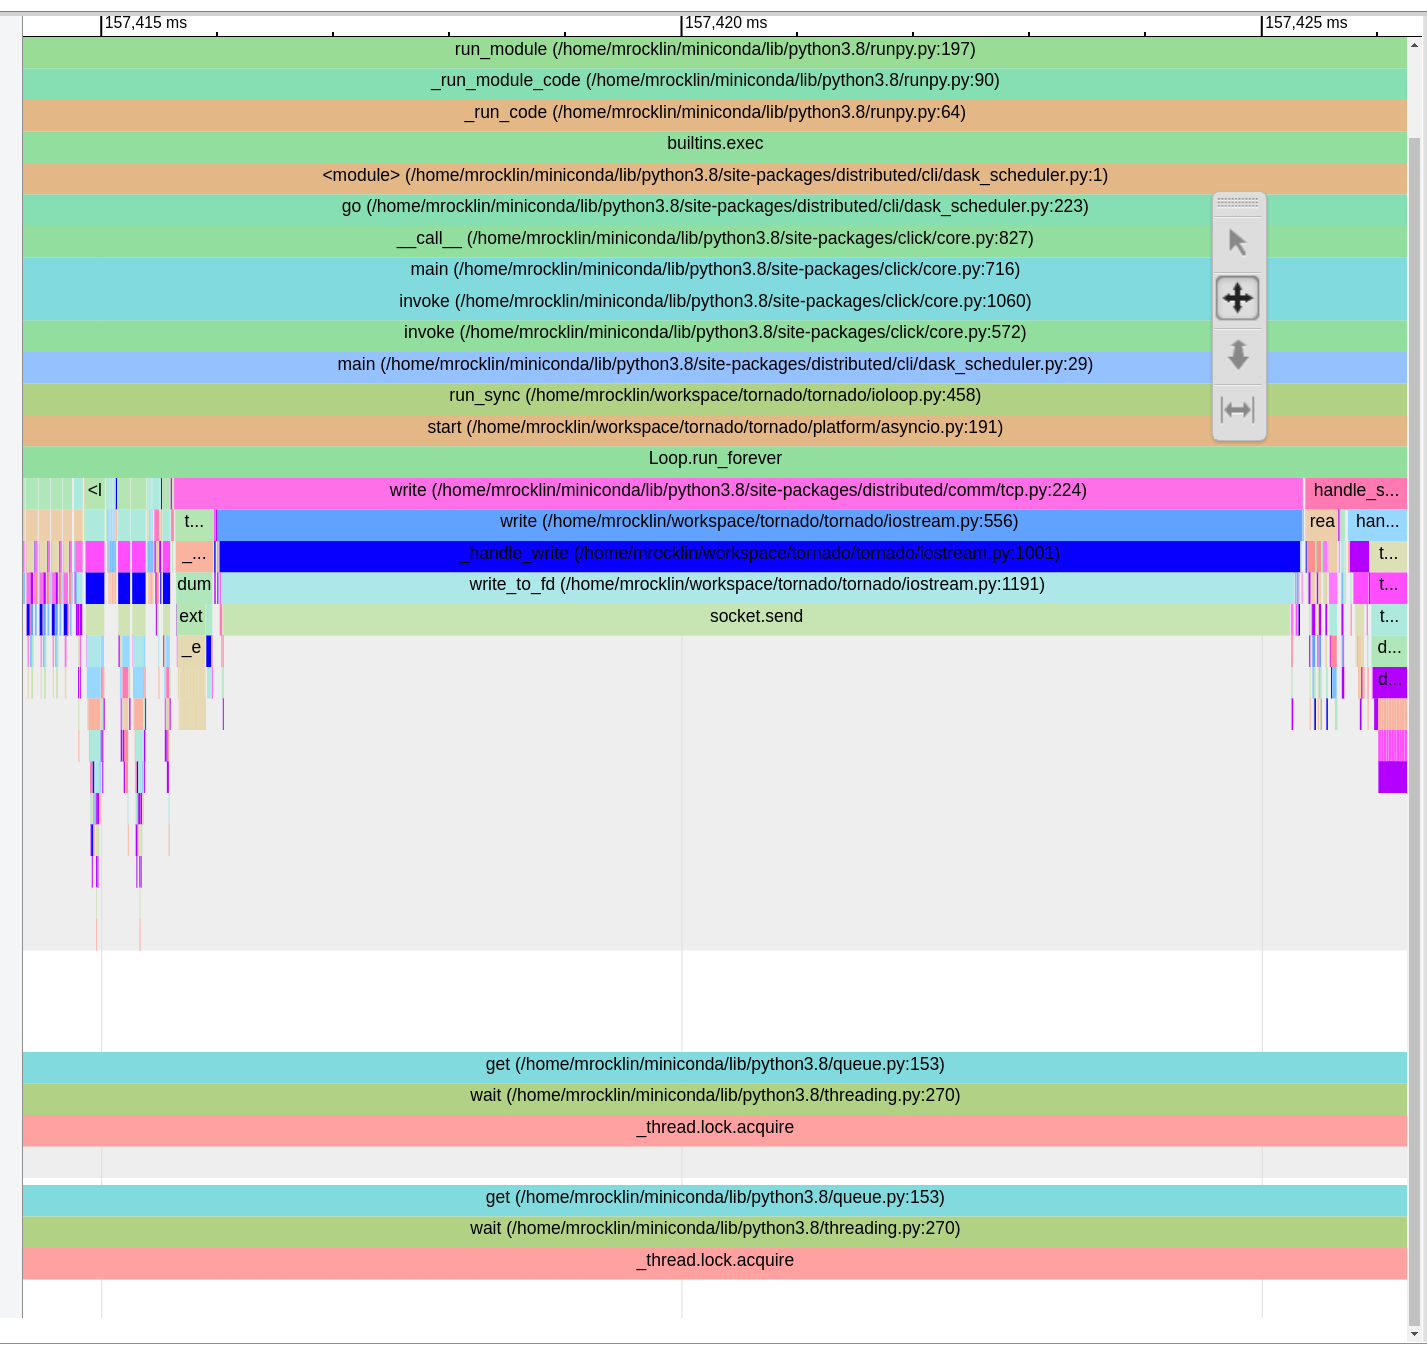
This is a 9ms call where nothing else is going on in any other Python thread. Does anyone have thoughts on what might cause something like this?
mrocklin
on 21 Jan 2021
Somewhat unrelated to this issue, but here are some observations from viztracer:
- calling
is_coroutine_functionis surprisingly costly. We do this in our mainhandle_streamloop. We can avoid this by requiring that every handler is async - The worker_send calls in transition take up a decent chunk of time there. We might consider batching them together within the broader
transitionscall - As @jakirkham has mentioned elsewhere,
extract_serializecan be expensive and, at least in the case of the scheduler, is probably entirely unnecessary. - Checking for
comm.closedat the start ofBatchedSend.sendcomes up a lot. We might want to either batch our BatchedSend calls (ironic, I know) (see point 2 above) or we might want to find some way to avoid the comm.closed check many times per event loop cycle. Perhaps registering acomm.on_closedcallback to assign a value on the BatchedComm would be appropriate here.
But the socket.send question is at least as important as all of those combined.
mrocklin
on 21 Jan 2021
Adding @jcrist , who might find this conversation interesting. I think that he was looking at efficient Python networking recently.
Unfortunately I don't have that much to suggest here. Earlier this year I was looking at performant networking using asyncio, below are some assorted thoughts:
The OpenSSL api requires copying of data (at least 1 more copy than may be required, although encryption will inherently require some data duplication post-cypher), so efforts spent to make zero-copy sends are less effective with TLS enabled. It's not just big writes though, smaller writes also incur additional latency as the whole SSL state machine is invoked for each call. Performance will dip compared to running without SSL, there's not much way around that (regardless of language).
You might find this comment in the uvloop repo informative. The sslproto there was rewritten, and a benchmark written up comparing it to other python implementations (as well as golang and raw SSL). That benchmark is a best-case-scenario for python - it's an echoserver, so the handlers have a very quick turnaround. As soon as you start doing things with the data performance will drop further.
In ery I was playing around with specing out an efficient RPC protocol as performantly as I could in Python (I'm still interested in this, just time crunched). Written as a Protocol, both the reader and writer are truly zero-copy when run without TLS. It also supports "multi-plexing", where multiple in progress streams can all share the same connection. The benchmarks below are from some in progress local work, but may provide some numbers for what you can expect. Note that the request handlers don't do anything here (and return a 2 byte response), all bandwidth calculations are based on the data sent from the clients -> server (server-> client is minimal).
# 3 client processes, each writing 1 MB requests
$ python benchmarks/bench.py --uvloop -c1 -p3 --bytes 1000000
processes=3, concurrency=1, bytes=1000000.0, time=5, uvloop=True, unix-sockets=False, ssl=False
4201.2 RPS
238.02723031514805 us per request
4201.2 MB/s
# 3 client processes, each writing 1 MB requests, TLS enabled
$ python benchmarks/bench.py --uvloop -c1 -p3 --bytes 1000000  --ssl
processes=3, concurrency=1, bytes=1000000.0, time=5, uvloop=True, unix-sockets=False, ssl=True
1254.8 RPS
796.9397513547976 us per request
1254.8 MB/s

# 3 client processes, each writing 10 KB requests
$ python benchmarks/bench.py --uvloop -c1 -p3 --bytes 10000
processes=3, concurrency=1, bytes=10000.0, time=5, uvloop=True, unix-sockets=False, ssl=False
22180.4 RPS
45.08484968711114 us per request
221.804 MB/s
# 3 client processes, each writing 10 KB requests, TLS enabled
$ python benchmarks/bench.py --uvloop -c1 -p3 --bytes 10000  --ssl
processes=3, concurrency=1, bytes=10000.0, time=5, uvloop=True, unix-sockets=False, ssl=True
13696.6 RPS
73.01082020355418 us per request
136.966 MB/s

# 3 client processes, each writing 10 KB requests, with 16 multiplexed streams
$ python benchmarks/bench.py --uvloop -c16 -p3 --bytes 10000
processes=3, concurrency=16, bytes=10000.0, time=5, uvloop=True, unix-sockets=False, ssl=False
71264.4 RPS
14.032251727370188 us per request
712.644 MB/s
# 3 client processes, each writing 10 KB requests, with 16 multiplexed streams, TLS enabled
$ python benchmarks/bench.py --uvloop -c16 -p3 --bytes 10000 --ssl  # 10 KB, multiplexed, SSL
processes=3, concurrency=16, bytes=10000.0, time=5, uvloop=True, unix-sockets=False, ssl=True
SSL connection is closed
36048.6 RPS
27.74032833452617 us per request
360.486 MB/s
The key takeaway is that even with an efficient protocol (written as a c-extension) and using uvloop, adding TLS still results in a 2-4x performance drop. Larger messages pay a higher cost here, as there's more data-copying going on. However, even with TLS you still may saturate the bandwidth of a cloud instance, which normally don't get above ~1.5 GiB/s.
 jcrist
on 21 Jan 2021
jcrist
on 21 Jan 2021
This issue has evolved a bit beyond the issue title of "SSL Performance". I'm going to change it now.
mrocklin
on 21 Jan 2021
Somewhat unrelated to this issue, but here are some observations from viztracer:
- calling
is_coroutine_functionis surprisingly costly. We do this in our mainhandle_streamloop. We can avoid this by requiring that every handler is async
Yeah I've seen this show up in profiles as well. It does take more than I would expect, but not a lot of time. Agree if there is a way to get away from this it would be helpful, but I don't expect it makes a big change.
- The worker_send calls in transition take up a decent chunk of time there. We might consider batching them together within the broader
transitionscall
Yep have seen this also. This is one of things we are doing in PR ( https://github.com/dask/distributed/pull/4365 ).
Wonder if we might go further and simply queue messages in transitions and send them periodically. Though that can be saved for a future PR.
- As @jakirkham has mentioned elsewhere,
extract_serializecan be expensive and, at least in the case of the scheduler, is probably entirely unnecessary.
This is certainly part of the story and we did go through and annotate this function so it could be Cythonized. More generally we seem to be calling to_frames and from_frames where they may not be needed. It would be interesting to see if we can get this down to MsgPack + send/recv.
- Checking for
comm.closedat the start ofBatchedSend.sendcomes up a lot. We might want to either batch our BatchedSend calls (ironic, I know) (see point 2 above) or we might want to find some way to avoid the comm.closed check many times per event loop cycle. Perhaps registering acomm.on_closedcallback to assign a value on the BatchedComm would be appropriate here.
Agreed. I'm actually wondering if we can simplify or eliminate this class and just handle batch send/recv in one place. Maybe with two functions? Though admit I don't understand that class well. So maybe there are reasons this wouldn't work that others have discovered before.
But the
socket.sendquestion is at least as important as all of those combined.
I don't have any deep thoughts here or suggestions beyond what others have said. Though if we are able to batch more messages as noted in a few case above, we would call this fewer times or at least in a part of the code where we know we will experience this slowdown. Ben has raised a few times that it would be nice to send larger messages (particularly with UCX) as we see slowdowns in communication bandwidth otherwise. Not sure if TCP experiences similar issues. If it does, then that might be another reason to batch larger messages and send them less fequently.
Suppose if one digs into different ways to send messages, there may be other improvements to be had like using domain sockets ( https://github.com/dask/distributed/issues/3630 ), shared memory, or generally exploring efficient intranode communication ( https://github.com/dask/distributed/issues/2046 ). This may not solve the problem generally, but may solve specific variants of it.
jakirkham
on 22 Jan 2021
This is done by removing all periodic checks (system monitor, profiling), using uvloop, and @jakirkham 's Cython builds with the SchedulerState changes.
Some observations
socket.sendis still the largest leaf node in this computation. I'm curious what could be causing this if there are no other significant threads running. Maybe garbage collection?extract_serializetakes up a total of around 40% of time. We should be able to omit this in our comms if the only serializer ismsgpack, which we should be able to mostly guarantee in the scheduler case. This is probably the lowest hanging fruit for speedups.transitionsis still a significant cost, at around 50% (total time). There are a bunch of smaller costs within this to optimize out. In particular this still includes a lot of the BatchedComm.send work as well as normal state transition logic
mrocklin
on 22 Jan 2021
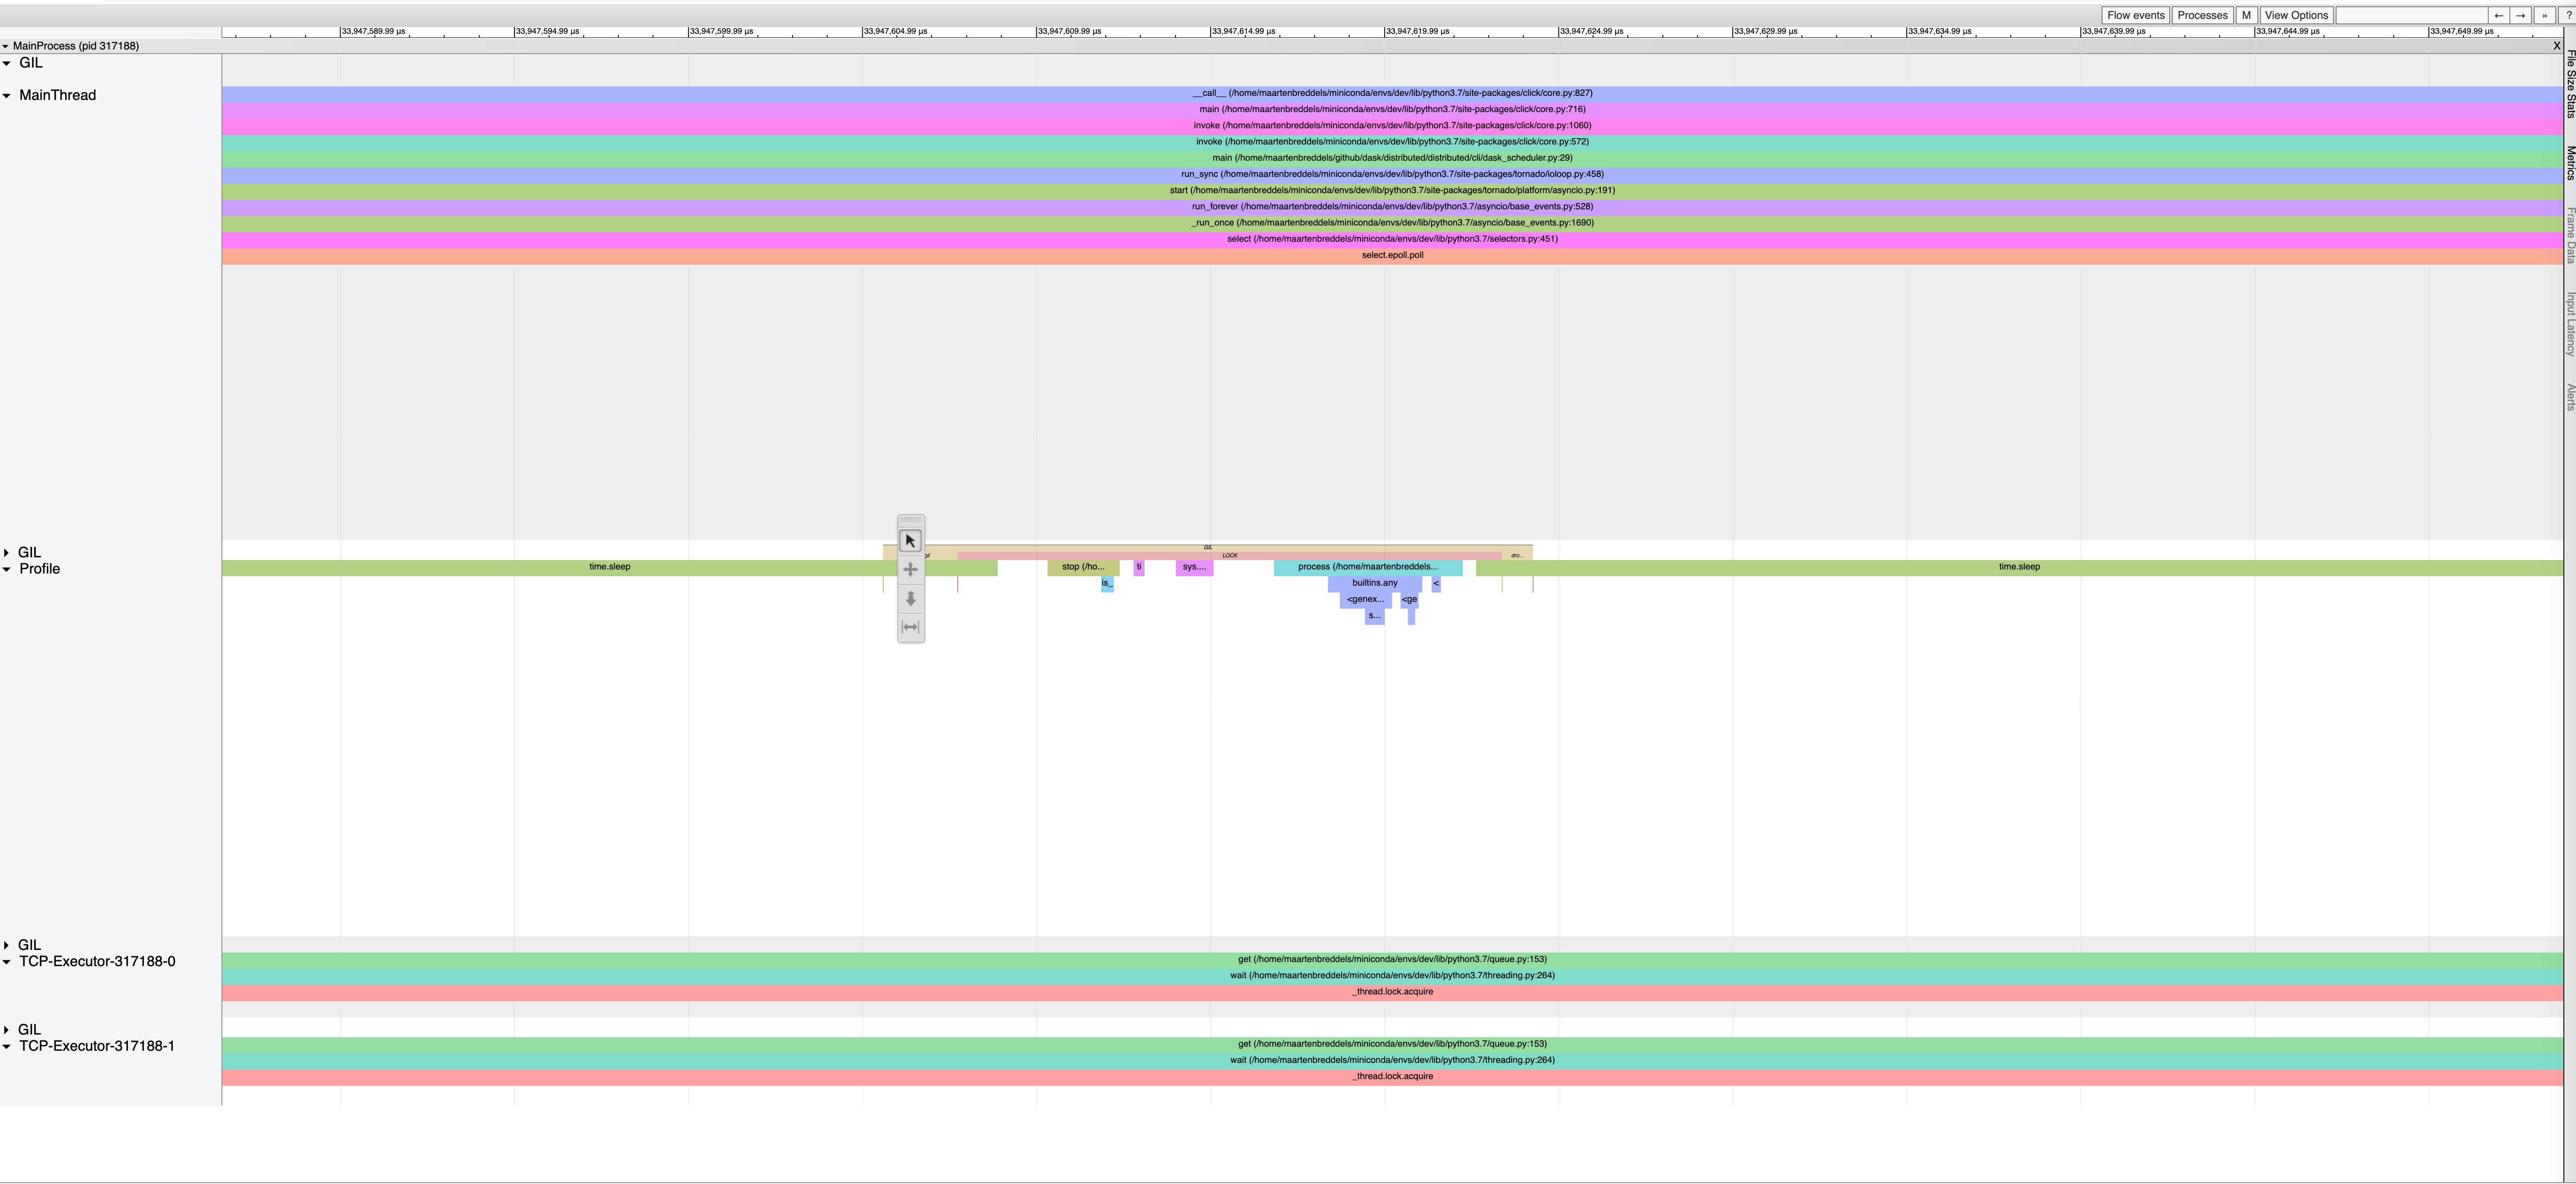
This is a 9ms call where nothing else is going on in any other Python thread. Does anyone have thoughts on what might cause something like this?
I am not seeing a call that long (tornado 6.1, distributed 2021.1.0+6.ge98d57dc, python 3.7.8)
The only thing I can think of is that the process is sleeping (giltracer --state-detect --no-gil-detect -m distributed.cli.dask_scheduler) should show that, but AFAIK that only happens for blocking sockets, or when the GIL is acquired, but already taken (which does not seem to be the case).
I've only seen a few socket.send calls that are sleeping due to the GIL, it looks like this (red S(GIL) indicates the thread is in the sleeping state due to the GIL):
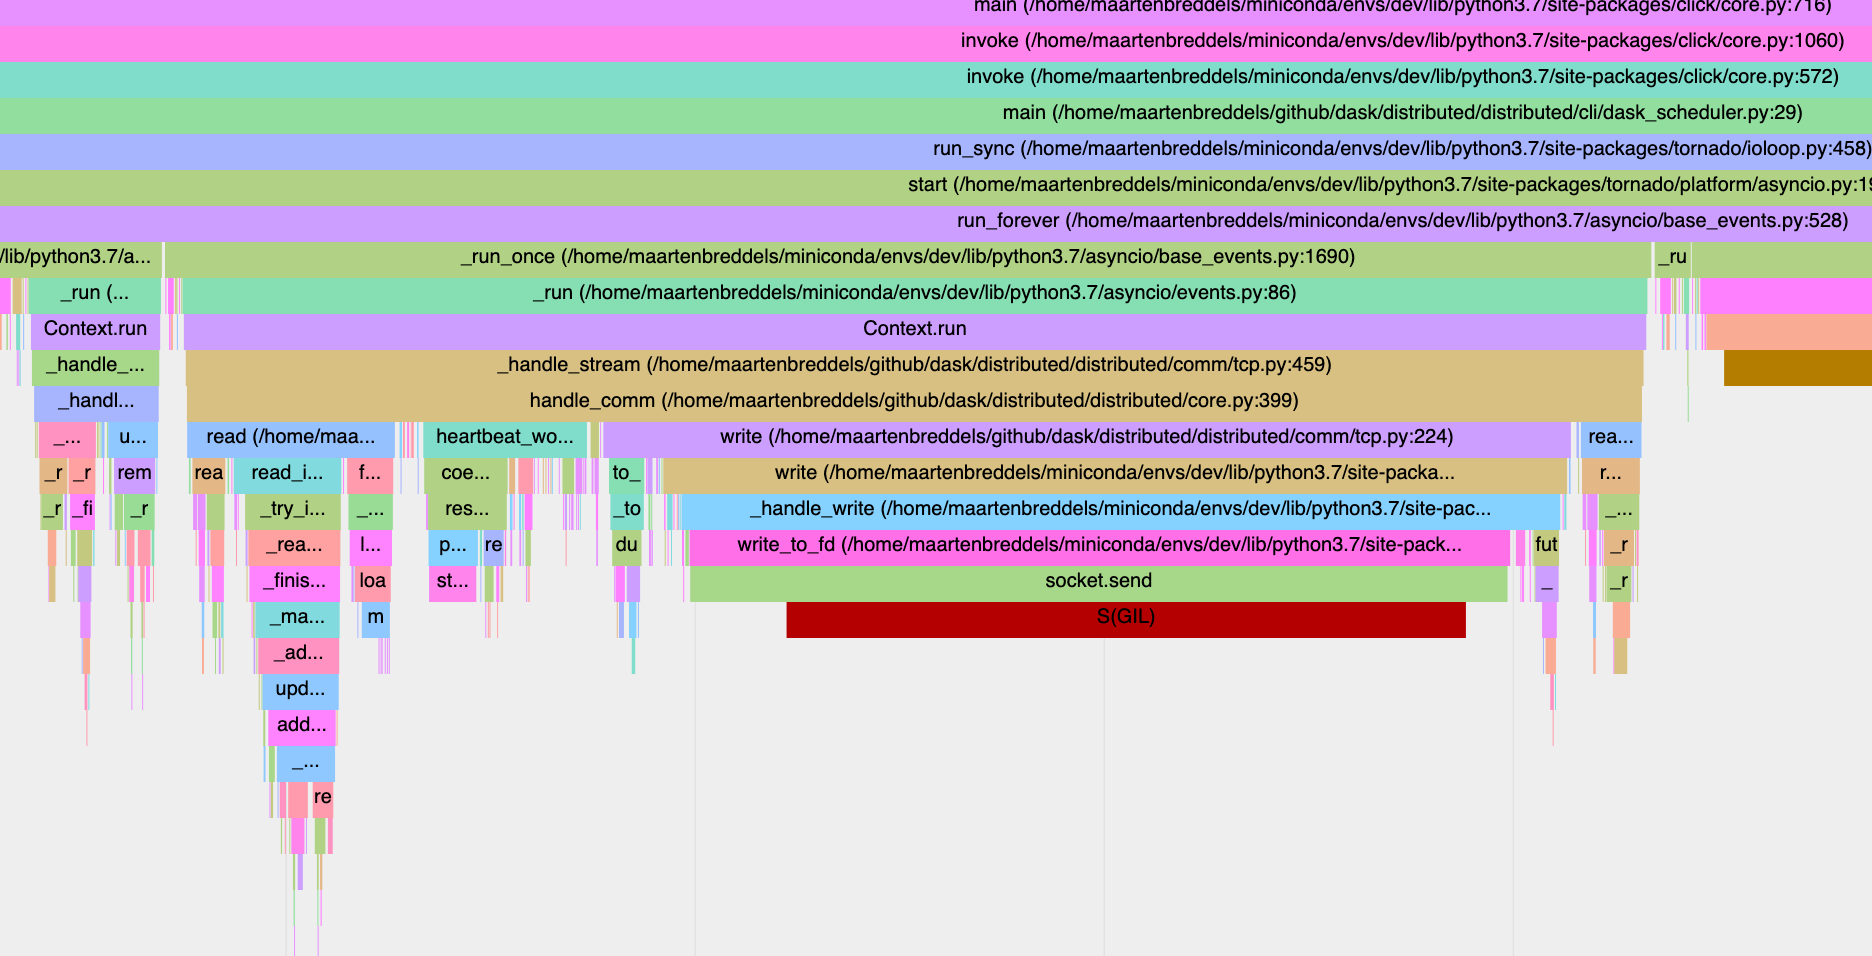
At the same moment, another threads was executing Python code:

And as you can see, the sleeping state before and after is not due to the GIL, but due to time.sleep.
maartenbreddels
on 22 Jan 2021
Also, for reference, here is how I'm currently running things
Config
This uses uvloop and removes profiling and system monitoring
distributed:
  version: 2
  worker:
    profile:
      interval: 10s        # Time between statistical profiling queries
      cycle: 1000s         # Time between starting new profile
      low-level: False      # Whether or not to include low-level functions
  admin:
    event-loop: uvloop
    system-monitor:
      interval: 1h
Install
I'm using jakirkham/ref_trans2 with master merged in
Then I pip install with Cython
python -m pip install -vv --no-deps --install-option="--with-cython=profile"
I also install viztracer with
pip install viztracer
Commands
In separate terminals
viztracer -m distributed.cli.dask_scheduler

dask-worker localhost:8786 --nprocs 20 --nthreads 1
from dask.distributed import Client, performance_report, wait

client = Client("localhost:8786")
import dask
import dask.dataframe as dd
dask.config.set({"optimization.fuse.active": False})
df = dask.datasets.timeseries(start="2020-01-01", end="2020-01-31", partition_freq="1h", freq="60s").persist()
df2 = df.set_index("x").persist()
wait(df2)
You then have to wait for the python code to finish (about a minute) and then quickly stop the viztracer process (Ctrl-C). We currently only capture the last few seconds of events before exiting.
Inspecting results
You can then open the resuling result.html file in a web browser. It is a large file and so takes a minute to load. You can move around with wasd or by using the pan (2) or zoom (3) tools. If you select (1) a region you will get summary statistics on the bottom. Be careful, this takes a minute to aggregate results, and again takes a minute on re-sorting.
mrocklin
on 22 Jan 2021
FWIW I added PR ( https://github.com/dask/distributed/pull/4449 ) to allow one to also Cythonize extract_serialize. Though I should note I have sometimes encountered issues when Cythonizing both the Scheduler and serialization. So it may not work. Should add the better approach may simply be to avoid extract_serialize on the Scheduler ( https://github.com/dask/distributed/issues/4376 ). Anyways figured it might be an easy thing to try for comparison sake.
jakirkham
on 22 Jan 2021
@maartenbreddels and I had a nice chat this afternoon. This resulted in two things to try:
- We can get GC output in viztracer with https://viztracer.readthedocs.io/en/stable/extra_log.html#log-garbage-collector (I'll try this now)
- We can combine
perfoutput withviztracerin order to let us know when the thread is sleeping. This is done in this blogpost. This might help us to understand thesocket.sendissue
mrocklin
on 22 Jan 2021
Garbage collection does cause random unexpected delays, but they're not particularly focused around socket.send calls. This doesn't appear to be our problem.
The next thing to check for socket.send, I think, is if the process itself is sleeping waiting for some other process to finish (I'm over-saturating my machine here).
mrocklin
on 22 Jan 2021
Hmm, if you're saturating your machine, then profiles measured in wall-clock time won't be very reliable, will they?
pitrou
on 22 Jan 2021
Just another idea for statictics on those send calls: use separate buckets based on data size, to see if there's a linearity between data size and send duration.
pitrou
on 22 Jan 2021
After looking into uvloop a bit, how Tornado handles communication, and revisiting Antoine's PR ( https://github.com/tornadoweb/tornado/pull/2193 ), am wondering if using some newer asyncio features like sock_recv_into, which uvloop also supports, would cutdown on some of the overhead we see in communication in Tornado. Raised issue ( https://github.com/tornadoweb/tornado/issues/2985 ) to see if that is more approachable now.
Edit: sock_sendall may also be worth consideration upstream at the same time
jakirkham
on 29 Jan 2021
One other thing worth considering here is that Dask uses multiple send and recv calls to transmit several buffers. However there are C functions recvmmsg and sendmmsg, which should be able to transmit multiple buffers as one message. There would still likely need to be an initial send/recv call to get information about the size of data being transmitted (as one needs to preallocate memory to fit the message), but presumably all other frames could be handled in one sendmmsg/recvmmsg call. Am not seeing these exposed in Python, but maybe there is a 3rd party library that people here know about these does this for Python?
jakirkham
on 12 Feb 2021
See socket.sendmsg and socket.recvmsg_into.
pitrou
on 12 Feb 2021
Yeah I saw those 2, but they are missing the extra m. Are they doing some dispatching under-the-hood to handle both the single and multi-message cases? A cursory look through the CPython codebase didn't reveal this, but I'd be happy to learn I'm just overlooking something
jakirkham
on 12 Feb 2021
What do you mean with "dispatching under the hood"?
pitrou
on 12 Feb 2021
Sorry I think I misunderstood sendmsg. That's probably sufficient.
Do you know if this would work on Windows or is it limited to Unix (or just Linux)?
jakirkham
on 12 Feb 2021
For performance at scale I'd personally be happy with favoring Linux :)
On Fri, Feb 12, 2021 at 3:45 PM jakirkham notifications@github.com wrote:
Sorry I think I misunderstood sendmsg. That's probably sufficient.
Do you know if this would work on Windows or is it limited to Unix (or
just Linux)?—
You are receiving this because you authored the thread.
Reply to this email directly, view it on GitHub
https://github.com/dask/distributed/issues/4443#issuecomment-778471846,
or unsubscribe
https://github.com/notifications/unsubscribe-auth/AACKZTHRX4CW6FYNKYEPUQ3S6WOP5ANCNFSM4WJNIRZQ
.
mrocklin
on 12 Feb 2021
Agreed. Just trying to get a sense of how much special casing might be needed here
jakirkham
on 12 Feb 2021
It's probably not supported on Windows, but you may check the CPython
source code.
Le 12/02/2021 à 22:53, Matthew Rocklin a écrit :
For performance at scale I'd personally be happy with favoring Linux :)
On Fri, Feb 12, 2021 at 3:45 PM jakirkham notifications@github.com wrote:
Sorry I think I misunderstood sendmsg. That's probably sufficient.
Do you know if this would work on Windows or is it limited to Unix (or
just Linux)?—
You are receiving this because you authored the thread.
Reply to this email directly, view it on GitHub
https://github.com/dask/distributed/issues/4443#issuecomment-778471846,
or unsubscribehttps://github.com/notifications/unsubscribe-auth/AACKZTHRX4CW6FYNKYEPUQ3S6WOP5ANCNFSM4WJNIRZQ
.—
You are receiving this because you were mentioned.
Reply to this email directly, view it on GitHub
https://github.com/dask/distributed/issues/4443#issuecomment-778475596, or
unsubscribe
https://github.com/notifications/unsubscribe-auth/AANELXFFLIE5WSAC4MBPYRDS6WPPFANCNFSM4WJNIRZQ.
pitrou
on 12 Feb 2021
My understanding is that we only do multiple sends when the frames are
large. This is likely somewhat rare and it may not be worth spending a ton
of time optimizing around it. Thoughts?
On Fri, Feb 12, 2021 at 4:04 PM Antoine Pitrou notifications@github.com
wrote:
>
It's probably not supported on Windows, but you may check the CPython
source code.Le 12/02/2021 à 22:53, Matthew Rocklin a écrit :
For performance at scale I'd personally be happy with favoring Linux :)
On Fri, Feb 12, 2021 at 3:45 PM jakirkham notifications@github.com
wrote:Sorry I think I misunderstood sendmsg. That's probably sufficient.
Do you know if this would work on Windows or is it limited to Unix (or
just Linux)?—
You are receiving this because you authored the thread.
Reply to this email directly, view it on GitHub
<https://github.com/dask/distributed/issues/4443#issuecomment-778471846
,
or unsubscribe<
https://github.com/notifications/unsubscribe-auth/AACKZTHRX4CW6FYNKYEPUQ3S6WOP5ANCNFSM4WJNIRZQ.
—
You are receiving this because you were mentioned.
Reply to this email directly, view it on GitHub
https://github.com/dask/distributed/issues/4443#issuecomment-778475596,
or
unsubscribe
<
https://github.com/notifications/unsubscribe-auth/AANELXFFLIE5WSAC4MBPYRDS6WPPFANCNFSM4WJNIRZQ
.—
You are receiving this because you authored the thread.
Reply to this email directly, view it on GitHub
https://github.com/dask/distributed/issues/4443#issuecomment-778480019,
or unsubscribe
https://github.com/notifications/unsubscribe-auth/AACKZTGZ6X5EDIWVFFAWNGDS6WQW5ANCNFSM4WJNIRZQ
.
mrocklin
on 12 Feb 2021
Wouldn't this happen basically anytime we are sending Dataframes or Arrays?
jakirkham
on 12 Feb 2021
It's also worth noting that we would no longer need to transmit the length of the frames since that is part of this message format. What I'm still trying to understand is if we might be able to get rid of transmitting the number of frames, at which point we really just have one send/recv occurring.
jakirkham
on 12 Feb 2021
Perhaps, but that's relatively rare with respect to the small metadata
messages that the scheduler itself handles. The dataframe or array
communications are much more likely to be worker-to-worker.
On Fri, Feb 12, 2021 at 4:20 PM jakirkham notifications@github.com wrote:
Wouldn't this happen basically anytime we are sending Dataframes or Arrays?
—
You are receiving this because you authored the thread.
Reply to this email directly, view it on GitHub
https://github.com/dask/distributed/issues/4443#issuecomment-778485928,
or unsubscribe
https://github.com/notifications/unsubscribe-auth/AACKZTBHSIMI6SCEFX2WSELS6WSRTANCNFSM4WJNIRZQ
.
mrocklin
on 12 Feb 2021
It's also worth noting that we would no longer need to transmit the length of the frames since that is part of this message format.
Why do you say that? You definitely need to know the lengths of the frames in order to presize the buffers you give to recvmsg_into.
pitrou
on 12 Feb 2021
What if we use recvmsg?
Edit: Would add that the example in the docs of recvmsg_into, seems to suggest that we don't need to line up the same sized buffers on both sides. IOW we could allocate one big buffer and cut it up after
jakirkham
on 12 Feb 2021
It looks like someone started to implement this for Tornado ( https://github.com/tornadoweb/tornado/pull/2734 )
jakirkham
on 13 Feb 2021
One other thing worth considering here is that Dask uses multiple
sendandrecvcalls to transmit several buffers.
At least for changes in Distributed, PR ( https://github.com/dask/distributed/pull/4506 ) gets this down to one IOStream write call for sending and two read calls for receiving (one for the message size and another for the message itself).
Under-the-hood the writes may still translate to multiple sends, but I don't think we can do too much there without PR ( https://github.com/tornadoweb/tornado/pull/2734 ) or similar. However the reads should translate pretty closely to an equivalent number of recv calls (with a small delta based on what may already be buffered).
jakirkham
on 17 Feb 2021
An updated run. I left Dask profiling on, which excacerbated the socket.send issue.

mrocklin
on 18 Feb 2021
Some observations
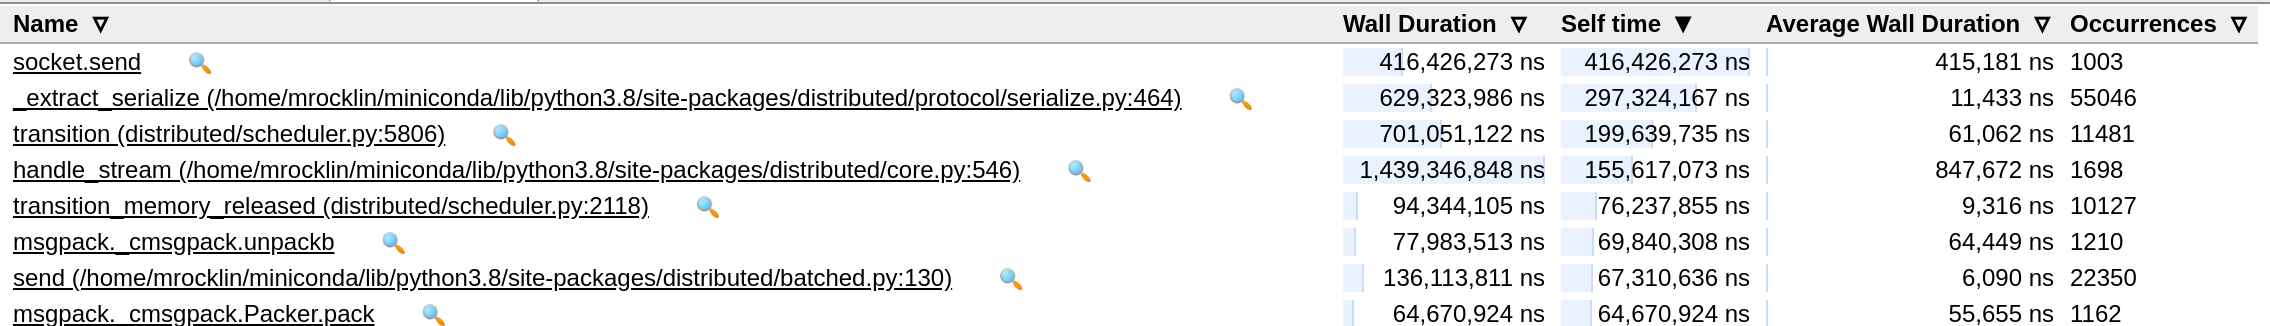
- extract_serialize and transition remain our largest single issues to resolve.
- I'm curious about the time spent in handle_stream that isn't spent as part of another call
- the msgpack/loads/socket.recv_into/... networking stack probably comes next. This is spread around into many functions, but together they add up to something. I think that we should consider things here top-down before micro-optimizing individual parts
- However, please recall that the socket.send issue is larger in this run than typical, both because I left Dask profiling on, and because I'm over-saturating my machine (I suspect that process switching is coming up here). Some of the networking stack probably comes up hotter here than is appropriate. It would be good to run this on a proper cluster and without profiling.
mrocklin
on 18 Feb 2021
Here is another run, this time without Dask profiling turned on (also, this run covered less time, so numbers are less. Check the grey bars overlaying the numbers to get a sense of scope)

mrocklin
on 18 Feb 2021
This is still using a sampling window where only a small part of the run is kept, right?
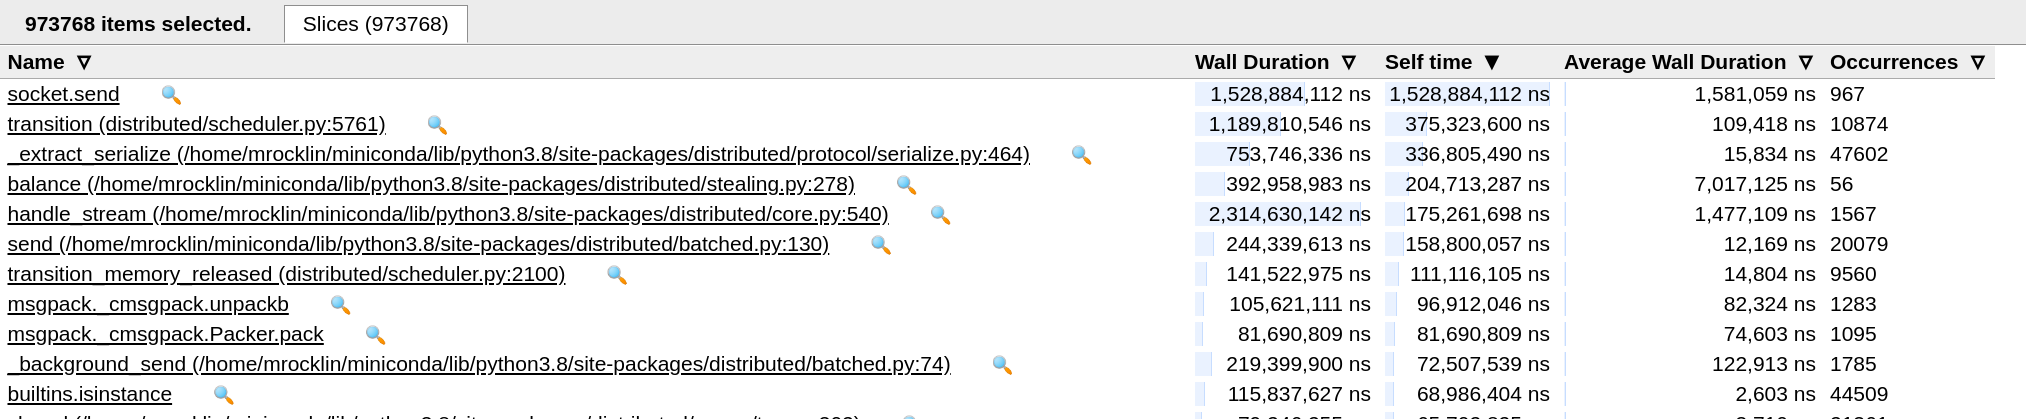
To contrast this a bit, would take a look at this info from the Scheduler performance report ( https://github.com/quasiben/dask-scheduler-performance/issues/109#issuecomment-781015358 )
jakirkham
on 18 Feb 2021
Spotted transition_memory_released in that list. Found a few easy fixes there.
Also saw a pattern in transition_memory_released where a method, TaskState.get_nbytes(), was getting called repeatedly in a loop. Previously we had run into issues with get_nbytes and so optimized it to pretty efficient C code. However it still shouldn't be called in a loop when we can call it once beforehand. Fixed this occurrence. Also found several others like it and fixed them as well. Should cutdown some overhead (even in the pure Python case).
These are all in PR ( https://github.com/dask/distributed/pull/4516 )
jakirkham
on 19 Feb 2021
Running a rechunk operation
I find that I'm not able to saturate my local machine's scheduler, but the profile is still interesting. It's somewhat different (also, this is with the PR that removes extract_serialize

mrocklin
on 23 Feb 2021
This is starting to look like the task completion thrashing that @quasiben mentioned on Friday we might run into
jakirkham
on 23 Feb 2021
I think that @quasiben mentioned that because the workers have been given very very short tasks that they might overwhelm the scheduler. Is this what you are referring to?
if so, then that is intentional. We want the workers to pester the scheduler as much as they can so that we're able to simulate the traffic on a larger cluster while testing on a very small machine.
Or in summary, all of this is about thrashing. Thrashing is the goal of these benchmarks :)
mrocklin
on 23 Feb 2021
What I mean is there is a bunch of work happening due to task completion. At least when we came into this work , the problem was the Scheduler was taking a long time dispatching the initial chunk of work. It doesn't seem we are seeing that any more (at least not for this use case).
jakirkham
on 23 Feb 2021
My method of profiling is only catching the tail end of the computation, so unfortunately I'm blind to the update_graph section. This is again a case where different methods are bad in different ways :/
mrocklin
on 23 Feb 2021
Yep no worries.
FWIW if you are looking to try more things, PR ( https://github.com/dask/distributed/pull/4526 ) batches more communications through things like task completion (amongst other things), which weren't handled before.
jakirkham
on 23 Feb 2021
Under-the-hood the writes may still translate to multiple
sends, but I don't think we can do too much there without PR ( https://github.com/tornadoweb/tornado/pull/2734 ) or similar. However thereads should translate pretty closely to an equivalent number ofrecvcalls (with a small delta based on what may already be buffered).
FWIW asyncio has a writelines API, which could be used for sending multiple buffers. It does not appear to use sendmsg currently though ( https://bugs.python.org/issue40007 ). There doesn't seem to be a place in the asyncio API for recvmsg to be used with Transport & Protocols (though please correct me if I'm missing something).
Under-the-hood libuv has the ability to use sendmsg and recvmsg, but uvloop doesn't seem to make use of these currently. Raised issue ( https://github.com/MagicStack/uvloop/issues/404 ) on handling multiple buffers in uvloop
jakirkham
on 15 Mar 2021
Related issues
 wmlba
·
4Comments
wmlba
·
4Comments
 mberglundmx
·
7Comments
mberglundmx
·
7Comments
 tom-andersson
·
3Comments
tom-andersson
·
3Comments
 m-albert
·
6Comments
m-albert
·
6Comments
 anweshknayak
·
6Comments
anweshknayak
·
6Comments
Most helpful comment
For performance at scale I'd personally be happy with favoring Linux :)
On Fri, Feb 12, 2021 at 3:45 PM jakirkham notifications@github.com wrote: