Distributed: Rotate text of Bandwidth type chart
We should probably slightly rotate the labels on the x axis so that they pack a bit more nicely.
This requires understanding a bit of Bokeh (or looking at their docs) and modifying the BandwidthTypes class here
 mrocklin
All 8 comments
We do this for other plots too, so there are probably examples of rotating text in that same file
mrocklin
on 28 Jul 2020
fig.xaxis.major_label_orientation = -math.pi / 12 is what we've typically done
 quasiben
on 28 Jul 2020
quasiben
on 28 Jul 2020
I'll happily take a stab at this, probably next week some time!
 hugobowne
on 29 Jul 2020
hugobowne
on 29 Jul 2020
@hugobowne Did you start working on this issue ? Otherwise, I would be glad to work on it.
 mathdugre
on 9 Aug 2020
mathdugre
on 9 Aug 2020
Go for it Mathieu
On Sat, Aug 8, 2020, 4:20 PM Mathieu Dugré notifications@github.com wrote:
@hugobowne https://github.com/hugobowne Did you start working on this
issue ? Otherwise, I would be glad to work on it.—
You are receiving this because you authored the thread.
Reply to this email directly, view it on GitHub
https://github.com/dask/distributed/issues/3992#issuecomment-670984185,
or unsubscribe
https://github.com/notifications/unsubscribe-auth/AACKZTAATZQYLFE75LHCJE3R7XMT3ANCNFSM4PJRXKGQ
.
mrocklin
on 9 Aug 2020
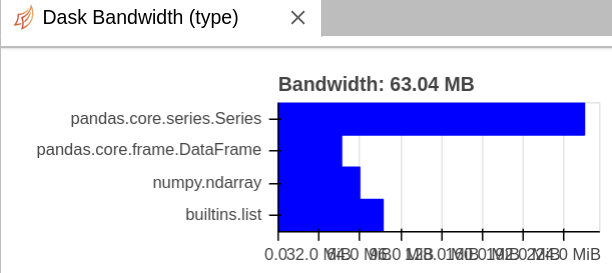
Following @quasiben suggestion I set the fig.xaxis.major_label_orientation to rotate the x-axis labels. After trying different values, I found that a rotation of -0.5 looked pretty good.
Those are the plots generated with a value of -0.5:
Dask Bandwidth [Type]
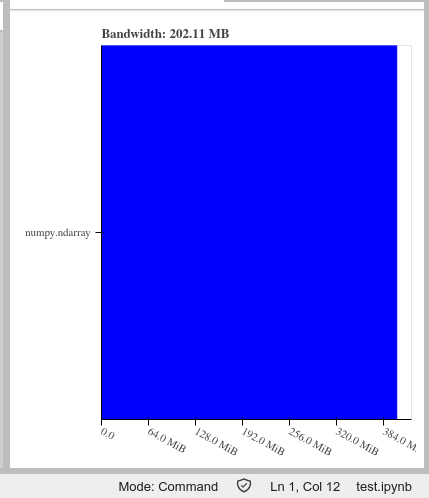
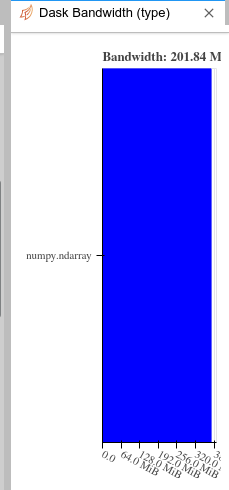
Dask Bandwidth [Type] (smaller window)
If this seems good, I'll open a PR.
mathdugre
on 9 Aug 2020
It seems like an improvement to me :)
On Sat, Aug 8, 2020 at 9:41 PM Mathieu Dugré notifications@github.com
wrote:
Following @quasiben https://github.com/quasiben suggestion I set the
fig.xaxis.major_label_orientation to rotate the x-axis labels. After
trying different values, I found that a rotation of -0.5 looked pretty
good.
Those are the plots generated with a value of -0.5:
Dask Bandwidth [Type][image: image]
https://user-images.githubusercontent.com/16450132/89724992-c8f7f980-d9f9-11ea-9655-584b094bcb03.png
Dask Bandwidth [Type] (smaller window)[image: image]
https://user-images.githubusercontent.com/16450132/89724994-d0b79e00-d9f9-11ea-9f9c-ce774dd944a2.pngIf this seems good, I'll open a PR.
—
You are receiving this because you authored the thread.
Reply to this email directly, view it on GitHub
https://github.com/dask/distributed/issues/3992#issuecomment-671005574,
or unsubscribe
https://github.com/notifications/unsubscribe-auth/AACKZTC3IKPNIEC5H7CZRODR7YSIHANCNFSM4PJRXKGQ
.
mrocklin
on 9 Aug 2020
This looks cool. Apologies for dropping the ball slightly here.
hugobowne
on 10 Aug 2020
Related issues
 lionfish0
·
4Comments
lionfish0
·
4Comments
 madsbk
·
4Comments
madsbk
·
4Comments
 muammar
·
6Comments
mrocklin
·
3Comments
muammar
·
6Comments
mrocklin
·
3Comments
 anweshknayak
·
6Comments
anweshknayak
·
6Comments
Most helpful comment
I'll happily take a stab at this, probably next week some time!