Diagnostics: dotnet-trace does not parse custom properties names in FilterAndPayloadSpecs
Description
The DiagnosticsSourceEventSource documentation states that it should be possible to give a new name for the extracted property. It does not seem to work with dotnet-trace. However, it works in Perfview.
Example
The command: dotnet-trace collect --providers "Microsoft-Diagnostics-DiagnosticSource:::FilterAndPayloadSpecs=SqlClientDiagnosticListener/Microsoft.Data.SqlClient.WriteCommandBefore:-CommandText=Command.CommandText" -p 11320 does not filter anything. And in Perfview I see the following meta event:
Microsoft-Diagnostics-DiagnosticSource/Message | 0,205 | Process(11320) (11320) | HasStack="True" ThreadID="7 788" ProcessorNumber="0" Message="DiagnosticSource: Enabling '*/*'"
No filtering applied. When I try the same payload in Perfview: *Microsoft-Diagnostics-DiagnosticSource:::FilterAndPayloadSpecs=SqlClientDiagnosticListener/Microsoft.Data.SqlClient.WriteCommandBefore:-CommandText=Command.CommandText:
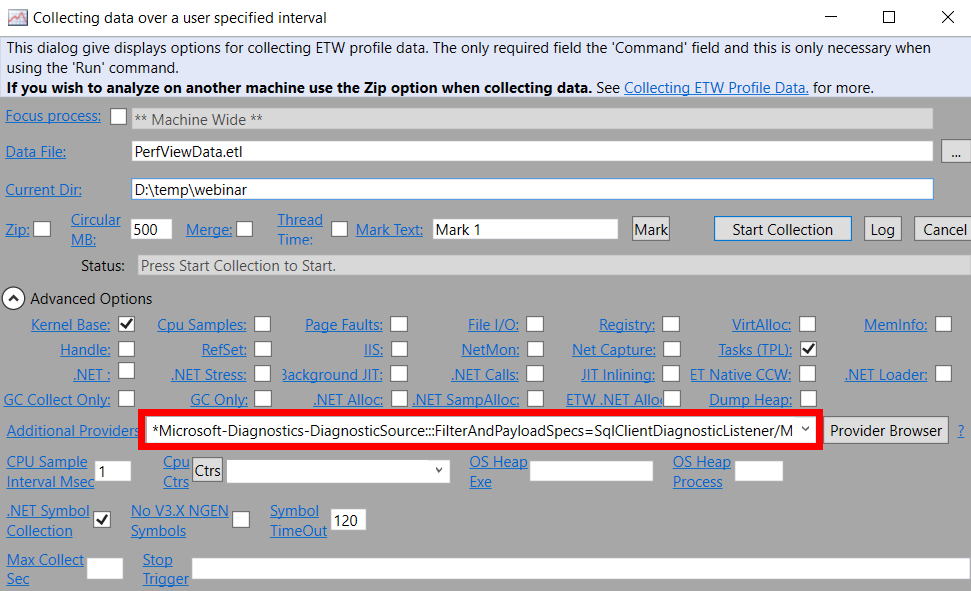
I get the expected filtering:
Microsoft-Diagnostics-DiagnosticSource/Message | 373,344 | test (11320) | ThreadID="6 632" ProcessorNumber="0" Message="DiagnosticSource: Enabling 'SqlClientDiagnosticListener/Microsoft.Data.SqlClient.WriteCommandBefore'"
Microsoft-Diagnostics-DiagnosticSource/Message | 373,350 | test (11320) | ThreadID="6 632" ProcessorNumber="0" Message="DiagnosticSource: suppressing implicit transforms."
Microsoft-Diagnostics-DiagnosticSource/Message | 373,352 | test (11320) | ThreadID="6 632" ProcessorNumber="0" Message="DiagnosticSource: Parsing Explicit Transform 'CommandText=Command.CommandText'"
Configuration
PS > dotnet-trace --version
5.0.152202+4d281c71a14e6226ab0bf0c98687db4a5c4217e3
Tested on 64-bit Windows 10: 20H2 (OS Build 19042.630)
 lowleveldesign
All 2 comments
For dotnet-trace you need to quote the values for key-value pairs that contain control characters like ;, :, =, etc. since they can get picked up by shells or in the parsing pipeline.
You can sometimes run into snags with various shells and how they escape characters. If you quote _just_ your filter string, does it work?
dotnet-trace collect --providers Microsoft-Diagnostics-DiagnosticSource:::FilterAndPayloadSpecs="SqlClientDiagnosticListener/Microsoft.Data.SqlClient.WriteCommandBefore:-CommandText=Command.CommandText" -p 11320
You can also try to quote both:
dotnet-trace collect --providers "Microsoft-Diagnostics-DiagnosticSource:::FilterAndPayloadSpecs=\"SqlClientDiagnosticListener/Microsoft.Data.SqlClient.WriteCommandBefore:-CommandText=Command.CommandText\"" -p 11320
The foolproof way of getting the filter string in correctly for more complicated filters is to put your arguments into a response file and invoke dotnet-trace using that file. This bypasses the shell's parsing logic.
myargs.rsp
--providers Microsoft-Diagnostics-DiagnosticSource:::FilterAndPayloadSpecs="SqlClientDiagnosticListener/Microsoft.Data.SqlClient.WriteCommandBefore:-CommandText=Command.CommandText"
at the shell
dotnet-trace collect -p <PID> @myargs.rsp
 josalem
on 1 Dec 2020
josalem
on 1 Dec 2020
Thanks for the detailed answer. I am on PowerShell and after some struggling, the command which finally worked was: dotnet-trace collect --providers 'Microsoft-Diagnostics-DiagnosticSource:::FilterAndPayloadSpecs=\"SqlClientDiagnosticListener/Microsoft.Data.SqlClient.WriteCommandBefore:-CommandText=Command.CommandText\"' -p 1612.
Thank you for the great work with the tools! I'm closing the ticket.
lowleveldesign
on 2 Dec 2020
Related issues
 CarlosLanderas
·
7Comments
CarlosLanderas
·
7Comments
 noahfalk
·
9Comments
noahfalk
·
9Comments
 davidfowl
·
6Comments
davidfowl
·
6Comments
 adamsitnik
·
5Comments
adamsitnik
·
5Comments
 SachiraChin
·
3Comments
SachiraChin
·
3Comments
Most helpful comment
For
dotnet-traceyou need to quote the values for key-value pairs that contain control characters like;,:,=, etc. since they can get picked up by shells or in the parsing pipeline.You can sometimes run into snags with various shells and how they escape characters. If you quote _just_ your filter string, does it work?
You can also try to quote both:
The foolproof way of getting the filter string in correctly for more complicated filters is to put your arguments into a response file and invoke
dotnet-traceusing that file. This bypasses the shell's parsing logic.myargs.rsp
at the shell