Diagnostics: Exception during EventPipeEventSource deserialization
Trying to consume the nettrace in PerfView results in an exception while converting to ETLX file. I did post this there as well, but since the actual exception is occurring in the diagnostics code itself, I thought i might post here as well.
Creating ETLX file C:\Users\chris\AppData\Local\Temp\PerfView\trace_2e914def.etlx from C:\Users\chris\Documents\trace.nettrace
Error: Exception EventPipe conversion: System.ArgumentOutOfRangeException: Valid values are between 0 and 999, inclusive.
Parameter name: millisecond
   at System.DateTime..ctor(Int32 year, Int32 month, Int32 day, Int32 hour, Int32 minute, Int32 second, Int32 millisecond, DateTimeKind kind)
   at Microsoft.Diagnostics.Tracing.EventPipeEventSource.FromStream(Deserializer deserializer)
   at FastSerialization.Deserializer.ReadObjectDefinition(Tags tag, StreamLabel objectLabel)
   at FastSerialization.Deserializer.GetEntryObject()
   at Microsoft.Diagnostics.Tracing.EventPipeEventSource..ctor(PinnedStreamReader streamReader, String name)
   at Microsoft.Diagnostics.Tracing.Etlx.TraceLog.CreateFromEventPipeDataFile(String filePath, String etlxFilePath, TraceLogOptions options)
   at PerfView.EventPipePerfViewData.GetTraceLog(TextWriter log, Action`3 onLostEvents)
The application environment is a Linux container running on an Azure App Service. Steps taken to create and retrieve the trace are:
trace.zip
SSH into already running app service executing a standard web api.
export PATH="$PATH:/root/.dotnet/tools"
dotnet-trace collect -p
Do some tests via Postman
End trace
Ftp trace.nettrace to remote server for pickup
Download trace.nettrace from remote server.
Try to open file
trace.zip
Target Framework is netcoreapp3.1
Linux image is based on mcr.microsoft.com/dotnet/core/sdk:3.1
 quisitive-crogers
All 9 comments
The Microsoft.Diagnostics.Tracing namespace lives in perfview, the exception comes from here: https://github.com/microsoft/perfview/blob/master/src/TraceEvent/EventPipe/EventPipeEventSource.cs#L374
Keeping this here nonetheless as it's possible the trace itself is bad, and that requires a runtime fix (@josalem, not sure but that might warrant moving this to the runtime repo)
 hoyosjs
on 23 Sep 2020
hoyosjs
on 23 Sep 2020
I did a brief debugging session and it does appear that there is a schema mismatch between what PerfView was expecting and what is actually in the trace.nettrace file. I can't seem to find a schema documented anywhere, though.
quisitive-crogers
on 23 Sep 2020
@quisitive-crogers What's the version of the PerfView you're using?
 sywhang
on 23 Sep 2020
sywhang
on 23 Sep 2020
@sywhang I literally just cloned the git repo and ran it in VS just now. Prior to that, I was use the precompiled exe which is 2.0.60
quisitive-crogers
on 23 Sep 2020
I see. I'm debugging this and seeing some strange values. Specifically the seconds/microseconds value being read from the trace is incorrect (i.e. out of range) and that's the cause of the exception. I tried bypassing that by error-correcting it and still running into errors during metadata parsing. I'll try to manually inspect the bits and see if we have a misalignment error or something.
In the meantime I have couple of questions regarding the environment....
the trace is showing that there are 256 processors in the machine - is that actually the case with this container?
does this error happen with every trace you collect from this container?
sywhang
on 23 Sep 2020
@sywhang I collected another trace and got a totally different exception.
Error: Exception EventPipe conversion: FastSerialization.SerializationException: Could not find object end tag for object of type EventPipeEventSource at stream offset 0x63
   at FastSerialization.Deserializer.FindEndTag(SerializationType type, IFastSerializable objectBeingDeserialized) in C:\Projects\Microsoft\perfview\src\FastSerialization\FastSerialization.cs:line 2047
   at FastSerialization.Deserializer.ReadObjectDefinition(Tags tag, StreamLabel objectLabel) in C:\Projects\Microsoft\perfview\src\FastSerialization\FastSerialization.cs:line 1909
   at FastSerialization.Deserializer.ReadObjectDefintion() in C:\Projects\Microsoft\perfview\src\FastSerialization\FastSerialization.cs:line 1829
   at FastSerialization.Deserializer.GetEntryObject() in C:\Projects\Microsoft\perfview\src\FastSerialization\FastSerialization.cs:line 1113
   at Microsoft.Diagnostics.Tracing.EventPipeEventSource..ctor(PinnedStreamReader streamReader, String name) in C:\Projects\Microsoft\perfview\src\TraceEvent\EventPipe\EventPipeEventSource.cs:line 68
   at Microsoft.Diagnostics.Tracing.EventPipeEventSource..ctor(String fileName) in C:\Projects\Microsoft\perfview\src\TraceEvent\EventPipe\EventPipeEventSource.cs:line 31
   at Microsoft.Diagnostics.Tracing.Etlx.TraceLog.CreateFromEventPipeDataFile(String filePath, String etlxFilePath, TraceLogOptions options) in C:\Projects\Microsoft\perfview\src\TraceEvent\TraceLog.cs:line 179
   at PerfView.EventPipePerfViewData.GetTraceLog(TextWriter log, Action`3 onLostEvents) in C:\Projects\Microsoft\perfview\src\PerfView\PerfViewData.cs:line 9202
[Error: exception while opening EventPipe data.]
This is the machine information from the container. This container is hosted on an Azure App Service with an S1 App Service Plan.
root@01078ca21600:~# lscpu
Architecture:        x86_64
CPU op-mode(s):      32-bit, 64-bit
Byte Order:          Little Endian
Address sizes:       46 bits physical, 48 bits virtual
CPU(s):              1
On-line CPU(s) list: 0
Thread(s) per core:  1
Core(s) per socket:  1
Socket(s):           1
NUMA node(s):        1
Vendor ID:           GenuineIntel
CPU family:          6
Model:               63
Model name:          Intel(R) Xeon(R) CPU E5-2673 v3 @ 2.40GHz
Stepping:            2
CPU MHz:             2394.456
BogoMIPS:            4788.91
Hypervisor vendor:   Microsoft
Virtualization type: full
L1d cache:           32K
L1i cache:           32K
L2 cache:            256K
L3 cache:            30720K
NUMA node0 CPU(s):   0
Flags:               fpu vme de pse tsc msr pae mce cx8 apic sep mtrr pge mca cmov pat pse36 clflush mmx fxsr sse sse2 ss syscall nx pdpe1gb rdtscp lm constant_tsc rep_good nopl xtopology cpuid pni pclmulqdq ssse3 fma cx16 pcid sse4_1 sse4_2 movbe popcnt aes xsave avx f16c rdrand hypervisor lahf_lm abm invpcid_single pti ssbd ibrs ibpb stibp fsgsbase bmi1 avx2 smep bmi2 erms invpcid xsaveopt md_clear flush_l1d
Inspecting the bits in the trace I'm noticing there are additional byte being added in random places in the trace.
For instance, in your first trace:
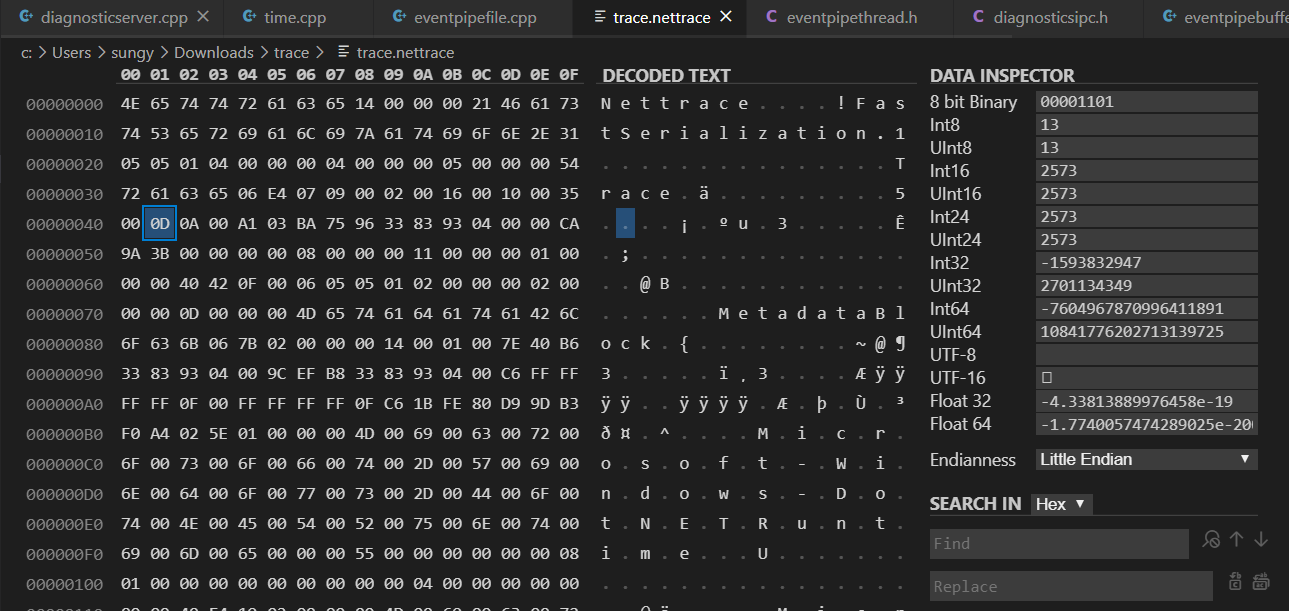
This additional byte 0D is causing the rest of the trace to be misaligned and causes the parser to get confused and throw weird numbers all around until it hits a value that it fails to parse. In your first trace, that happens to be the millisecond value logged because it's a negative value. I tried using a binary editor to remove that 0D and forced it to continue but it couldn't parse some of the payload metadata so I'm guessing there are additional bytes that are being put in the middle of the trace.
I'm actually a little surprised by this because that particular byte is located in the middle of a single block of payload that we write out from the runtime:

I'm trying to see if I can boot up an Azure App Service app and repro this so that I can better understand how this can happen, but this might take a while.
Is there anything special about your environment that I should be aware of? i.e. running multiple apps, redirecting the diagnostics port, anything else that's noteworthy?
sywhang
on 24 Sep 2020
I figured it out and am feeling a bit silly.
So there's nothing wrong with the container or PerfView or the collection process. The problem was with me transferring the file off the docker container using FTP. I was not switching the ftp client into binary mode and as such, ftp was converting things that it recognized as line endings from UNIX to Windows format (which explains the extra bytes in seemingly random places). Switching the transfer mode to binary solved the problem and the file opens just fine.
I apologize for wasting everyone's time and really appreciate the help.
quisitive-crogers
on 24 Sep 2020
@quisitive-crogers Ahhh, that would explain the mystery... :) No problem at all and glad you figured it out in the end!
sywhang
on 24 Sep 2020
Related issues
 SachiraChin
·
3Comments
SachiraChin
·
3Comments
 adamsitnik
·
5Comments
adamsitnik
·
5Comments
 mleenhardt
·
6Comments
mleenhardt
·
6Comments
 chrisnas
·
6Comments
chrisnas
·
6Comments
 t-bzhan
·
8Comments
t-bzhan
·
8Comments
Most helpful comment
Inspecting the bits in the trace I'm noticing there are additional byte being added in random places in the trace.
For instance, in your first trace:

This additional byte
0Dis causing the rest of the trace to be misaligned and causes the parser to get confused and throw weird numbers all around until it hits a value that it fails to parse. In your first trace, that happens to be the millisecond value logged because it's a negative value. I tried using a binary editor to remove that 0D and forced it to continue but it couldn't parse some of the payload metadata so I'm guessing there are additional bytes that are being put in the middle of the trace.I'm actually a little surprised by this because that particular byte is located in the middle of a single block of payload that we write out from the runtime:
I'm trying to see if I can boot up an Azure App Service app and repro this so that I can better understand how this can happen, but this might take a while.
Is there anything special about your environment that I should be aware of? i.e. running multiple apps, redirecting the diagnostics port, anything else that's noteworthy?