Diagnostics: dotnet-gcdump failed to collect dump
I've been using this to investigate https://github.com/aspnet/AspNetCore/issues/13299, and just wanted to mention that once when doing dotnet-gcdump collect, it failed with this exception:
$ dotnet-gcdump collect --process-id 1
Writing gcdump to '/app/20191028_114158_1.gcdump'...
[ERROR] System.ApplicationException: RootIndex not set.
   at Graphs.Graph.AllowReading() in /app/diagnostics/src/Tools/dotnet-gcdump/DotNetHeapDump/Graph.cs:line 236
   at Microsoft.Diagnostics.Tools.GCDump.CollectCommandHandler.<>c__DisplayClass1_0.<Collect>b__0() in /app/diagnostics/src/Tools/dotnet-gcdump/CommandLine/CollectCommandHandler.cs:line 58
   at System.Threading.ExecutionContext.RunInternal(ExecutionContext executionContext, ContextCallback callback, Object state)
--- End of stack trace from previous location where exception was thrown ---
   at System.Threading.Tasks.Task.ExecuteWithThreadLocal(Task& currentTaskSlot)
--- End of stack trace from previous location where exception was thrown ---
   at Microsoft.Diagnostics.Tools.GCDump.CollectCommandHandler.Collect(CancellationToken ct, IConsole console, Int32 processId, String output, Boolean verbose) in /app/diagnostics/src/Tools/dotnet-gcdump/CommandLine/CollectCommandHandler.cs:line 63
Then I retried, and it worked.
Update: I have now an instance on which I'm consistently getting this exception even if I wait and try again.
_Originally posted by @markvincze in https://github.com/dotnet/diagnostics/pull/581#issuecomment-546891045_
 josalem
All 15 comments
@josalem it gives the following output.
$ dotnet-gcdump collect --process-id 1 -v
Writing gcdump to '/app/20191028_090928_1.gcdump'...
  0.0s: Creating type table flushing task
  6.7s: Flushing the type table
 26.8s: Done flushing the type table
 27.3s: Requesting a .NET Heap Dump
 41.0s: Assume no .NET Heap
 41.0s: Shutting down EventPipe session
05:n1s: [Error] Exception during gcdump: System.NullReferenceException: Object reference not set to an instance of an object.
   at Microsoft.Diagnostics.Tools.GCDump.EventPipeDotNetHeapDumper.DumpFromEventPipe(CancellationToken ct, Int32 processID, MemoryGraph memoryGraph, TextWriter log, DotNetHeapInfo dotNetInfo) in /app/diagnostics/src/Tools/dotnet-gcdump/DotNetHeapDump/EventPipeDotNetHeapDumper.cs:line 169
[ 53.4s: Done Dumping .NET heap success=False]
[ERROR] System.ApplicationException: RootIndex not set.
   at Graphs.Graph.AllowReading() in /app/diagnostics/src/Tools/dotnet-gcdump/DotNetHeapDump/Graph.cs:line 236
   at Microsoft.Diagnostics.Tools.GCDump.CollectCommandHandler.<>c__DisplayClass1_0.<Collect>b__0() in /app/diagnostics/src/Tools/dotnet-gcdump/CommandLine/CollectCommandHandler.cs:line 58
   at System.Threading.ExecutionContext.RunInternal(ExecutionContext executionContext, ContextCallback callback, Object state)
--- End of stack trace from previous location where exception was thrown ---
   at System.Threading.Tasks.Task.ExecuteWithThreadLocal(Task& currentTaskSlot)
--- End of stack trace from previous location where exception was thrown ---
   at Microsoft.Diagnostics.Tools.GCDump.CollectCommandHandler.Collect(CancellationToken ct, IConsole console, Int32 processId, String output, Boolean verbose) in /app/diagnostics/src/Tools/dotnet-gcdump/CommandLine/CollectCommandHandler.cs:line 63
_originally posted by @markvincze in https://github.com/dotnet/diagnostics/pull/581#issuecomment-547124756_
josalem
on 29 Oct 2019
@markvincze, I'm opening up this issue to track this failure, so that we don't block the addition of the gcdump tool.
Could you expand on the environment where you are able to routinely able to reproduce this failure?
Info that would be helpful:
- architecture
- OS + version
- base container image used
- configuration of the tool and target, e.g., was the tool installed inside the container
- CPU and memory usage of the target process when this failure occurs
- is the target process deadlocked after this failure?
If possible, could you take a dump of the target process when you see this failure? If you can't share the dump with me, please take a look in the native threads for any stacks referencing the DiagnosticsServer or EventPipe.
CC @sywhang
josalem
on 29 Oct 2019
After looking into the error a bit, this looks very similar to some other issues that I've seen crop up where StopTracing never responds. I believe what is happening is that the Task with source.Process() is dying because EventPipeEventSource is throwing an exception, resulting the reader not reading. This causes the buffer for the named pipe or socket to fill up and the writing thread to block. StopTracing waits for the writing thread to clean itself up, so we end up in a situation where the writing thread is blocked on writing to a full OS transport and the StopTracing command is blocked on the writer. In the case of this tool, the logic causes things to timeout and we end up never collecting the gcdump. Further investigation and proof is required, but that appears to be what is happening.
josalem
on 29 Oct 2019
@josalem, I collected some of the info:
We're running on Kubernetes in the Google Cloud. The OS on the nodes is I believe the "Container-Optimized OS" by Google, where the Docker image of our application runs.
$ uname -a
Linux shadow-mirror-rulesapi-core-single-6c6f7f78bf-sm6fh 4.14.127+ #1 SMP Tue Jun 18 23:08:40 PDT 2019 x86_64 GNU/Linux
The base image is mcr.microsoft.com/dotnet/core-nightly/sdk:3.1.100-preview2
The tool is built from the cloned source and copied into the /root/.dotnet/tools folder during the Docker build.
I'm reproducing this now with a modified version of our service in which the main CPU-intensive operation is commented out, so the CPU-usage is only around 5%, and the memory usage is also very low, around 200MB with the limit of the container set to 5G.
No, the service is not deadlocked after this, it works fine.
During collecting this info, I tested again a couple of times, and now it seems kinda random. I ran the dotnet-gcdump collect command 10 times. It worked 3 times, and failed with the exception 7 times. Both the successful executions and the failures took around 1-2 seconds.
I've uploaded one of the successful dumps here: https://drive.google.com/file/d/1lxRGZj6LeyrVqlmZQiyT2P4VMCoyd-K7/view?usp=sharing
 markvincze
on 30 Oct 2019
markvincze
on 30 Oct 2019
Thanks for the extra info. I don't think there's anything to be learned about the failures from the gcdump of the process unfortunately. If you have a minimized repro of the behavior that you can share, I can attempt to reproduce it locally and debug through it.
josalem
on 30 Oct 2019
Hmm, I don't have a small repro, the service producing the problem has a lot of external dependencies to be able to start up (plus also those third-party proprietary bits).
If it'd help, if you add some extra console logs to the code and push it to a branch, I can try to build and run that version to see the output.
markvincze
on 31 Oct 2019
Btw just one extra comment:
When I first started using dotnet-gcdump, I encountered this issue, so you suggested that I use the commit one before the HEAD. So I used the commit ccde7be6cfcad26 , and with that version I've never encountered this RootIndex not set. exception.
And then a day later I saw that the commit ccde7be6cfcad26 disappeared (I assumed because you rebased or something?), and then I started using the HEAD of the branch. And this issue only started happening then. But this is not conclusive, it might have been just luck that it didn't happen before.
Is there any chance you still have that commit locally, so you could push it with a specific tag or branch so that I could test to verify?
markvincze
on 31 Oct 2019
I'll see if I can find that commit again, but yes, I rebased my changes. Could you try the tip of the PR and see if it the issue still presents?
josalem
on 1 Nov 2019
Hi @josalem,
I'm testing the latest version (d4155991 at the time I built my service), and so far that works fine, I couldn't reproduce the exception any more.
markvincze
on 4 Nov 2019
@josalem, one quick question about dotnet-gcdump collect: if I keep creating dumps over time from the same process, each one will be a full dump, so it's not like the subsequent executions only collect the diffs compared to the previous runs, right?
markvincze
on 4 Nov 2019
@markvincze, that is correct. Each gcdump is a full dump and not a diff from the previous dump. I've been bouncing around the idea of getting a diff experience in the tool by comparing two dumps, but for now, you'll have to use other tools for that. Visual Studio has a diffing experience if you open multiple gcdump files in it.
josalem
on 4 Nov 2019
I believe this issue has been fixed before the PR was merged, so I'm closing this issue. If this crops again, we can reopen the issue and investigate further.
josalem
on 4 Nov 2019
Thanks, that's what I assumed. I was just unsure, because I collected a number of dumps ~15 minutes apart for a service of which the total memory usage was continuously increasing, but the diffs between the dumps show a huge amount of decrease in the instance counts, and barely any increase.
markvincze
on 4 Nov 2019
Hmm, is the total memory consumption changing between the gcdumps? If possible, could you upload the dumps you collected?
josalem
on 5 Nov 2019
Hi @josalem,
(sorry for the late response)
I've been playing with this in the meantime, and I've been confused by the results I'm getting. So here is a concrete example. I've recorded a gcdump for my process at 11:05, and 11:38. You can see the memory usage graph of the application (this is rendered based on the memory usage of the whole Docker container, but the container has nothing else running besides the ASP.NET process, so it should correspond pretty closely to the memory usage of the actual ASP.NET Core application).
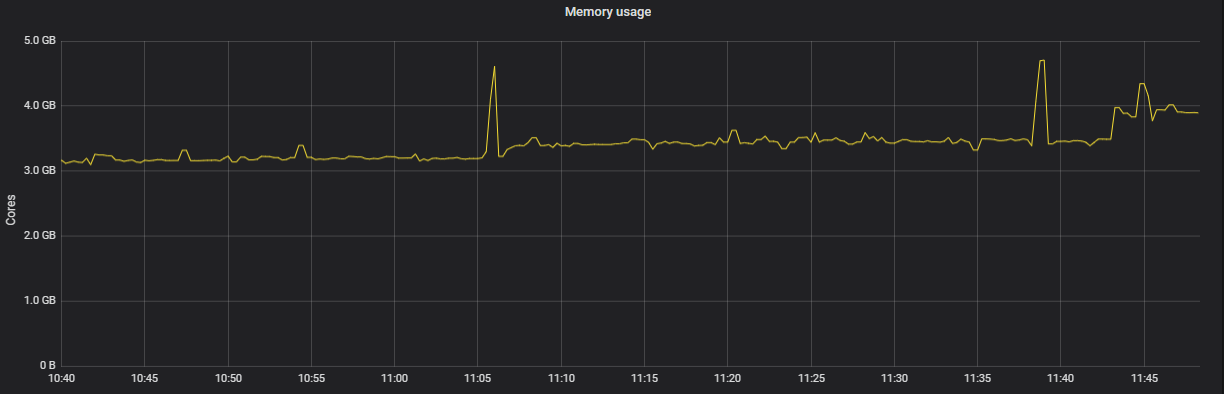
The memory usage is gradually increasing, and there are two spikes at 11:05 and 11:38, which exactly corresponds to the time when the dump was recorded, so I assume those two spikes are caused by dotnet-gcdump itself.
The memory usage before recording the dump at 11:04 was around 3.194 GB, and at 11:37 was around 3.470 GB. (This is just what the Prometheus metric is showing at those times, so probably not accurate down to the byte, but it should be roughly correct.)
The first bit of confusion comes when I open the first dump in PerfView. I'd expect the "Total Metric" field at the top to show the total memory usage in bytes, so I'm expecting to see a number like 3,194,xxx,xxx. Instead of that, it shows 13,362,950, which as far as I understand corresponds to 13MB?

And if I open the second dump, it shows 6,574,561:

If I display the diff between the two, that accordingly shows -6,788,384 in total, and it mostly shows decrease in the instance counts:

And much less increase

I've uploaded the two dumps: at 11:05 and at 11:38
So something seems to be very off. If you have any ideas about what I'm doing wrong, it'd be greatly appreciated. (Sorry if I'm missing something trivial, or if I'm using PerfView completely wrong.)
markvincze
on 8 Nov 2019
Related issues
 davidfowl
·
7Comments
davidfowl
·
3Comments
davidfowl
·
7Comments
davidfowl
·
3Comments
 juliusfriedman
·
6Comments
juliusfriedman
·
6Comments
 brianrob
·
7Comments
brianrob
·
7Comments
 jmezach
·
6Comments
jmezach
·
6Comments