Diagnostics: Dump dotnet process running in docker from host
Is it possible to dump dotnet process running in docker from host?
I am using docker image
mcr.microsoft.com/dotnet/core/runtime:3.0-buster-slim container has SYS_PTRACE capability
and I am trying to dump my application from host.
But when I get PID from docker client
docker top my_container
UID                 PID                 PPID                C                   STIME               TTY                 TIME                CMD
root                4466                4448                0                   09:46               ?                   00:00:00            dotnet NoEnd.dll
dotnet-dump collect -p 4466
Unable to locate .NET runtime associated with this process!
Is this supported scenario or I need to
- exec into container
- install SDK
- install dotnet-dump
- collect dump inside docker container?
Thx
 klesta490
All 27 comments
I believe this is technically possible, but not without some setup on your part and is not technically a supported scenario _yet_. The dotnet-* diagnostic tools communicate via Unix Domain Sockets on Linux and look for the socket files to determine what processes they can attach to. To "bridge" from host to container, you will need to map the /tmp directory of your container to the /tmp directory of your host, e.g., add -v /tmp:/tmp to your docker invocation or ADD /tmp /tmp to your dockerfile. Note that you need to debug those dumps in the same environment they came from.
Let me know if that works for you and feel free to leave feedback on how you wish it _would_ work.
CC @shirhatti @mikem8361
 josalem
on 18 Oct 2019
josalem
on 18 Oct 2019
cc @kichalla
 shirhatti
on 18 Oct 2019
shirhatti
on 18 Oct 2019
Note that you need to debug those dumps in the same environment they came from.
@josalem Could you elaborate on this? In case an app crashes in a container, (which would in turn stop the container) in my scenario the dump of the crashed process is collected in a volume mounted directory from host. I was hoping I can analyze the dumps from the host machine since I have the app's pdbs and the dump file too. Am I missing something?
 kichalla
on 18 Oct 2019
kichalla
on 18 Oct 2019
@klesta490 Yes, you can try out the steps that you mentioned. We are currently doing the same way. Snippet from a Dockerfile that we have to create our own runtime image having the tools and I was able to collect dump, get counter information from within the container.
# dotnet tools are currently available as part of SDK so we need to create them in an sdk image
# and copy them to our final runtime image
FROM mcr.microsoft.com/dotnet/core/sdk:3.0 AS tools-install
RUN dotnet tool install --tool-path /dotnetcore-tools dotnet-sos
RUN dotnet tool install --tool-path /dotnetcore-tools dotnet-trace
RUN dotnet tool install --tool-path /dotnetcore-tools dotnet-dump
RUN dotnet tool install --tool-path /dotnetcore-tools dotnet-counters

FROM mcr.microsoft.com/dotnet/core/aspnet:3.0.0

RUN apt-get update \
  && apt-get upgrade -y \
  && apt-get install -y \
     file \
     lldb \
  && rm -rf /var/lib/apt/lists/*

COPY --from=tools-install /dotnetcore-tools /opt/dotnetcore-tools
ENV PATH="/opt/dotnetcore-tools:${PATH}"
RUN dotnet-sos install
Note that you need to debug those dumps in the same environment they came from.
@josalem Could you elaborate on this? In case an app crashes in a container, (which would in turn stop the container) in my scenario the dump of the crashed process is collected in a volume mounted directory from host. I was hoping I can analyze the dumps from the host machine since I have the app's pdbs and the dump file too. Am I missing something?
@kichalla, let me clarify "environment" a bit: this means a machine that has the same base OS (Linux, Mac, Windows), with the same libc flavor and version (e.g., musl vs glibc), and is the same architecture. You'll also need all the debugging symbols for your app (you can use dotnet symbols to fetch symbols for dotnet itself if you don't have them on your dev box). @mikem8361, did I miss anything here?
If you are unable to diagnose the dump even if those things all match, you can create a modified version of your runtime container that has lldb installed and debug there as well, as that is almost guaranteed to work.
As an example, for my workflow, I make sure the dumps I collect are being written to a dir I have mapped to my host. Then when I go to triage them, I just respin the container, install lldb or dotnet-dump, and debug in the container itself.
josalem
on 18 Oct 2019
https://github.com/dotnet/diagnostics/issues/573#issuecomment-543886037
Maybe we should do this by default in our images?
 davidfowl
on 21 Oct 2019
davidfowl
on 21 Oct 2019
@josalem mapping /tmp didn't work. I still get same error
Unable to locate .NET runtime associated with this process!
I will preinstall dotnet-dump into container according to @kichalla advice.
klesta490
on 21 Oct 2019
Maybe we should do this by default in our images?
with a special tag maybe
 agoretsky
on 21 Oct 2019
agoretsky
on 21 Oct 2019
@agoretsky Why not by default? Size?
davidfowl
on 21 Oct 2019
@josalem mapping
/tmpdidn't work. I still get same error
Unable to locate .NET runtime associated with this process!I will preinstall dotnet-dump into container according to @kichalla advice.
@klesta490 out of curiosity, what PID did you use when you tried this? The socket will be created with the PID that the process is given in the container, so in the case of most containers this tends to be 1. If you tried to use the PID assigned to the container on the host machine, the dotnet tools won't find a socket to communicate over.
josalem
on 21 Oct 2019
@agoretsky Why not by default? Size?
Yes
agoretsky
on 21 Oct 2019
How much size are you willing to pay to have a diagnosable application. What if it was < 5 megs.
davidfowl
on 21 Oct 2019
What if it was < 5 megs.
_Runs the suggested Dockerfile, sees:_
The following NEW packages will be installed:
binfmt-support bzip2 file libbsd0 libc-dev-bin libc6-dev libedit2 libexpat1
libffi-dev libgpm2 liblldb-7 libllvm7 libmagic-mgc libmagic1 libncurses-dev
libncurses6 libpipeline1 libpython-stdlib libpython2-stdlib libpython2.7
libpython2.7-minimal libpython2.7-stdlib libreadline7 libsqlite3-0
libtinfo-dev linux-libc-dev lldb lldb-7 llvm-7 llvm-7-dev llvm-7-runtime
lsb-base manpages manpages-dev mime-support python python-lldb-7
python-minimal python-six python2 python2-minimal python2.7
python2.7-minimal readline-common xz-utils
Good luck. 😝
 bradwilson
on 21 Oct 2019
bradwilson
on 21 Oct 2019
(LLDB v7 itself is 8.5MB, not to mention all of the dependencies like LLVM v7, Python v2.7, libc-dev, etc.)
bradwilson
on 21 Oct 2019
REPOSITORY                             TAG      IMAGE ID       CREATED         SIZE
debuggable                             latest   021f5da8a02c   2 minutes ago   668MB
mcr.microsoft.com/dotnet/core/aspnet   3.0.0    930743cb4e19   4 days ago      207MB
I don’t believe you need the SDK to actually run the tools, only install (for now). You could put all the tools into a known location during the build phase of the dockerfile and then remove the SDK so that it isn’t bulking up the final image. We’re currently investigating the best way to distribute these tools without the SDK, but this could work in the meantime.
From: Brad Wilson notifications@github.com
Sent: Monday, October 21, 2019 9:33:59 AM
To: dotnet/diagnostics diagnostics@noreply.github.com
Cc: John Salem josalem@microsoft.com; Mention mention@noreply.github.com
Subject: Re: [dotnet/diagnostics] Dump dotnet process running in docker from host (#573)
(LLDB v7 itself is 8.5MB, not to mention all of the dependencies like Python 2.7 and libc-dev and friends)
—
You are receiving this because you were mentioned.
Reply to this email directly, view it on GitHubhttps://nam06.safelinks.protection.outlook.com/?url=https%3A%2F%2Fgithub.com%2Fdotnet%2Fdiagnostics%2Fissues%2F573%3Femail_source%3Dnotifications%26email_token%3DAE5VXHMWQZD7RI6T2I75BJTQPXKXPA5CNFSM4JCEDLQKYY3PNVWWK3TUL52HS4DFVREXG43VMVBW63LNMVXHJKTDN5WW2ZLOORPWSZGOEB26RCY%23issuecomment-544598155&data=02%7C01%7Cjosalem%40microsoft.com%7Cc0af63c106df4685c2b808d756447a1f%7C72f988bf86f141af91ab2d7cd011db47%7C1%7C0%7C637072724423486308&sdata=37GytBP9W1JhnCw1%2Br34AhyrzHIslmZy3HFGv%2BbtUKc%3D&reserved=0, or unsubscribehttps://nam06.safelinks.protection.outlook.com/?url=https%3A%2F%2Fgithub.com%2Fnotifications%2Funsubscribe-auth%2FAE5VXHOD3L36QTFOZLHVTULQPXKXPANCNFSM4JCEDLQA&data=02%7C01%7Cjosalem%40microsoft.com%7Cc0af63c106df4685c2b808d756447a1f%7C72f988bf86f141af91ab2d7cd011db47%7C1%7C0%7C637072724423496303&sdata=qx2VJfq72mmcGS3KiaQ%2BVkozAgAKaYgbrx7mgAcDnU8%3D&reserved=0.
josalem
on 21 Oct 2019
Ah, scratch that, I see that lldb install now. Yeah that will be large no matter what you do.
From: John Salem josalem@microsoft.com
Sent: Monday, October 21, 2019 9:37:04 AM
To: dotnet/diagnostics reply@reply.github.com; dotnet/diagnostics diagnostics@noreply.github.com
Cc: Mention mention@noreply.github.com
Subject: Re: [dotnet/diagnostics] Dump dotnet process running in docker from host (#573)
I don’t believe you need the SDK to actually run the tools, only install (for now). You could put all the tools into a known location during the build phase of the dockerfile and then remove the SDK so that it isn’t bulking up the final image. We’re currently investigating the best way to distribute these tools without the SDK, but this could work in the meantime.
From: Brad Wilson notifications@github.com
Sent: Monday, October 21, 2019 9:33:59 AM
To: dotnet/diagnostics diagnostics@noreply.github.com
Cc: John Salem josalem@microsoft.com; Mention mention@noreply.github.com
Subject: Re: [dotnet/diagnostics] Dump dotnet process running in docker from host (#573)
(LLDB v7 itself is 8.5MB, not to mention all of the dependencies like Python 2.7 and libc-dev and friends)
—
You are receiving this because you were mentioned.
Reply to this email directly, view it on GitHubhttps://nam06.safelinks.protection.outlook.com/?url=https%3A%2F%2Fgithub.com%2Fdotnet%2Fdiagnostics%2Fissues%2F573%3Femail_source%3Dnotifications%26email_token%3DAE5VXHMWQZD7RI6T2I75BJTQPXKXPA5CNFSM4JCEDLQKYY3PNVWWK3TUL52HS4DFVREXG43VMVBW63LNMVXHJKTDN5WW2ZLOORPWSZGOEB26RCY%23issuecomment-544598155&data=02%7C01%7Cjosalem%40microsoft.com%7Cc0af63c106df4685c2b808d756447a1f%7C72f988bf86f141af91ab2d7cd011db47%7C1%7C0%7C637072724423486308&sdata=37GytBP9W1JhnCw1%2Br34AhyrzHIslmZy3HFGv%2BbtUKc%3D&reserved=0, or unsubscribehttps://nam06.safelinks.protection.outlook.com/?url=https%3A%2F%2Fgithub.com%2Fnotifications%2Funsubscribe-auth%2FAE5VXHOD3L36QTFOZLHVTULQPXKXPANCNFSM4JCEDLQA&data=02%7C01%7Cjosalem%40microsoft.com%7Cc0af63c106df4685c2b808d756447a1f%7C72f988bf86f141af91ab2d7cd011db47%7C1%7C0%7C637072724423496303&sdata=qx2VJfq72mmcGS3KiaQ%2BVkozAgAKaYgbrx7mgAcDnU8%3D&reserved=0.
josalem
on 21 Oct 2019
Why is lldb needed?
davidfowl
on 21 Oct 2019
I believe that is for dotnet dump analyze, @mikem8361 ?
josalem
on 21 Oct 2019
No lldb is NOT needed for dotnet-dump analyze. Kind of the whole reason for it's existence; for platforms/distros/architectures that lldb doesn't work that well on (arm, alpine, etc.).
 mikem8361
on 21 Oct 2019
mikem8361
on 21 Oct 2019
@mikem8361 just to confirm, so LLDB is not required for .NET Core 3.0 runtime and future versions, but for versions like 2.1 and 2.2 it is still required as these tools do not work those runtimes, right?
kichalla
on 21 Oct 2019
This depends on the tool. SOS installed with dotnet-sos will work on all our supported runtimes (2.x, 3.x and 5.x). dotnet-dump collect only works with 3.x and greater runtimes. dotnet-dump analyze works like SOS on our supported runtimes.
dotnet-trace and dotnet-counters only work against 3.x and greater.
LLDB compared with dotnet-dump analyze is still very useful for all the version of the runtimes because it display more of the native state like stack traces. And of course live debugging.
mikem8361
on 21 Oct 2019
So maybe a diag image for 3.x could contain dotnet-{dump,counters,trace} but not dotnet-sos? Looks like the diff with those is around 63MB:
REPOSITORY                              TAG            IMAGE ID       SIZE
diagnosable                             latest         b73e7ea0a850   270MB
mcr.microsoft.com/dotnet/core/aspnet    3.0.0          930743cb4e19   207MB
Is that too big to include in the base image?
FYI, that's the Dockerfile I used:
FROM mcr.microsoft.com/dotnet/core/sdk:3.0 AS tools-install
RUN dotnet tool install --tool-path /dotnetcore-tools dotnet-trace
RUN dotnet tool install --tool-path /dotnetcore-tools dotnet-dump
RUN dotnet tool install --tool-path /dotnetcore-tools dotnet-counters

FROM mcr.microsoft.com/dotnet/core/aspnet:3.0.0

COPY --from=tools-install /dotnetcore-tools /opt/dotnetcore-tools
ENV PATH="/opt/dotnetcore-tools:${PATH}"
 aelij
on 22 Oct 2019
aelij
on 22 Oct 2019
My guess is dotnet-dump is the culprit:
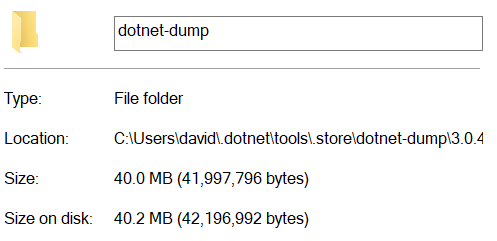
Made worse by the fact that we ship binaries for all platforms:
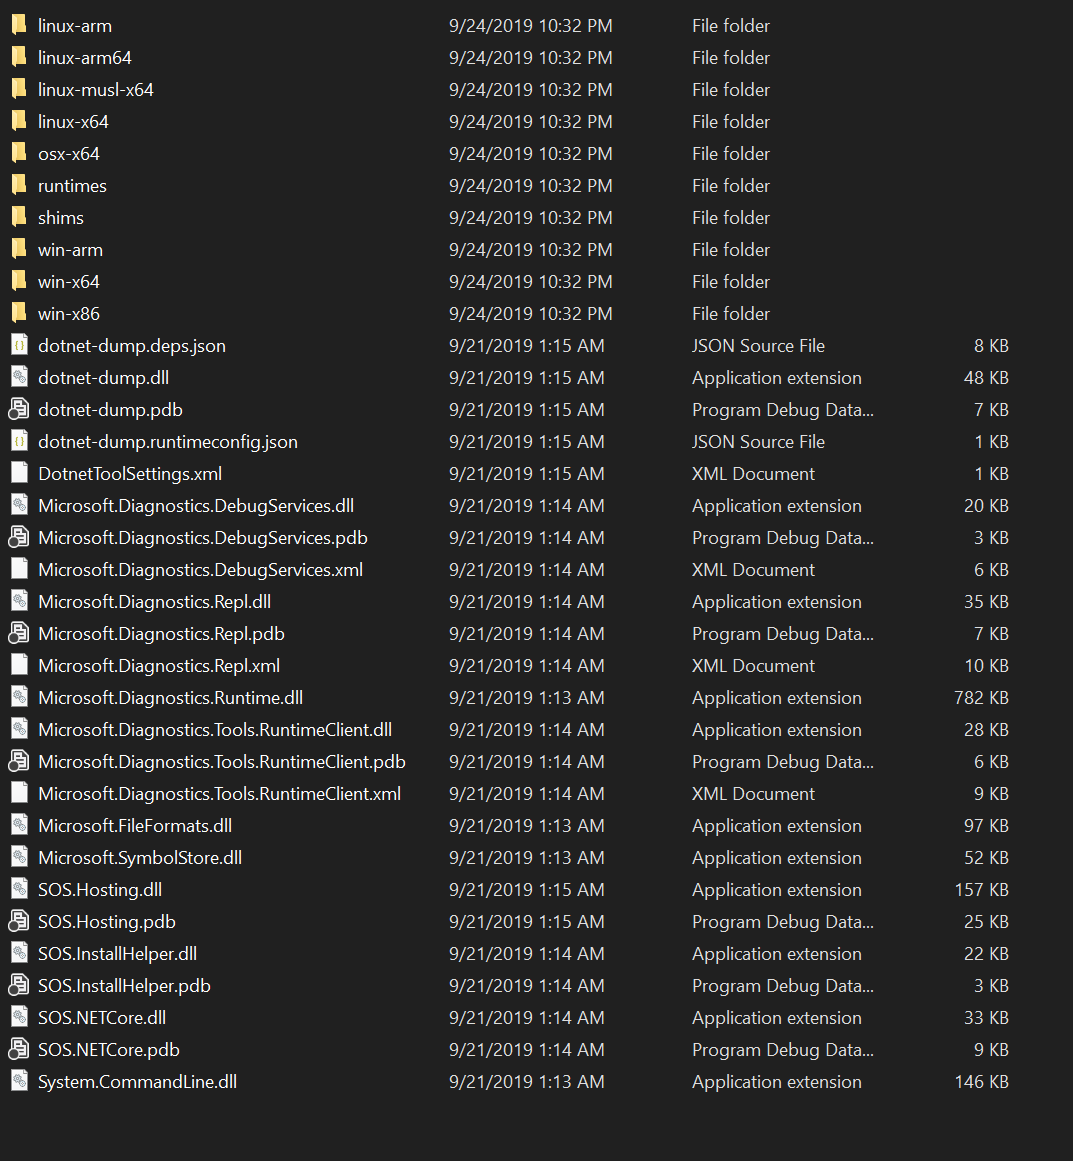
If we can be smart about what we keep, it'd probably be much smaller.
davidfowl
on 22 Oct 2019
@josalem You are right, I am passing PID 4466 (host), but inside docker it is PID 1. Is there any option to bypass PID?
klesta490
on 23 Oct 2019
@klesta490, how do you mean "bypass the PID"? Dotnet processes create Diagnostics IPC sockets using their PID and a timestamp to uniquely identify them. The tools use the PID to find these sockets for connection. Since the dotnet process is running in the PID-space of the docker container, that socket will be created with PID=1.
We're investigating how we might enable this scenario (host tracing something in container). That might involve allowing the tools to look in specific directories for the sockets, allowing you to map the container's /tmp dir to anywhere on your system and have the tools find only sockets from the container.
josalem
on 23 Oct 2019
Not sure what issues are left so I'm closing.
mikem8361
on 3 Dec 2019
Related issues
davidfowl
·
3Comments
 jmezach
·
6Comments
jmezach
·
6Comments
 bruno-garcia
·
4Comments
bruno-garcia
·
4Comments
 noahfalk
·
7Comments
noahfalk
·
7Comments
 vtortola
·
6Comments
vtortola
·
6Comments
Most helpful comment
https://github.com/dotnet/diagnostics/issues/573#issuecomment-543886037
Maybe we should do this by default in our images?