Devextreme: Excel Export Enhancements
The Problem
The current DataGrid export implementation does not allow you to customize Excel files in the following ways:
- add a header and footer
- add boolean values, images, rich texts, formulas, hyperlinks
- format values
- border a cell
- add new worksheets
- customize the workbook or worksheet
- export several widgets into one file
The Proposed Solution
We plan to use the third-party ExcelJS library for Excel file customization and add the 'exportDataGrid' utility for exporting the DataGrid.
Note: At the moment, we are testing the proposed solution and want to collect feedback and find out whether this solution covers most scenarios. After we finish the research, we will decide whether to reimplement the DataGrid's export in a similar way.
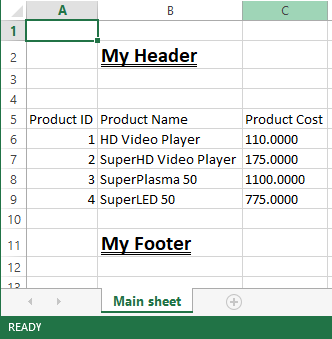
Add header and footer
let dataGridOptions = {
    onExporting: e => {
        var workbook = new ExcelJS.Workbook();
        var worksheet = workbook.addWorksheet('Main sheet');

        exportDataGrid({
            workbook, worksheet, dataGrid: e.component, topLeftCell: { row: 5, column: 1 },
            saveEnabled: false
        }).then(function(dataGridRange) {
            Object.assign(
            worksheet.getRow(2).getCell(2),
            { value: "My Header", font: { bold: true, size: 16, underline: 'double' } }
            );

            Object.assign(
            worksheet.getRow(dataGridRange.to.row + 2).getCell(2),
            { value: "My Footer", font: { bold: true, size: 16, underline: 'double' } }
            );
            return Promise.resolve();
        }).then(function() {
            return workbook.xlsx.writeBuffer();
        }).then(function(buffer) {
            saveAs(new Blob([buffer], { type: "application/octet-stream" }), "DataGrid.xlsx");
        });
        e.cancel = true;
    }
};
Export two grids into one worksheet
let buttonOptions = {
    text: "Export Grids",
    onClick: function() {
        var dataGrid1 = $("#gridContainer1").dxDataGrid("instance");
        var dataGrid2 = $("#gridContainer2").dxDataGrid("instance");
        var workbook = new ExcelJS.Workbook();
        var worksheet = workbook.addWorksheet('Main sheet');

        Object.assign(
            worksheet.getRow(2).getCell(2),
            { value: "Costs:", font: { bold: true, size: 16, underline: 'double' } }
        );
        Object.assign(
            worksheet.getRow(2).getCell(7),
            { value: "Ratings:", font: { bold: true, size: 16, underline: 'double' } }
        );

        exportDataGrid({
            worksheet, dataGrid: dataGrid1, topLeftCell: { row: 4, column: 2 },
            saveEnabled: false
        }).then(function(dataGridRange) {
            return exportDataGrid({
            worksheet, dataGrid: dataGrid2, topLeftCell: { row: 4, column: (dataGridRange.to.column + 2) },
            saveEnabled: true, workbook
            });
        });
    }
};

Export grids into separate worksheets
let buttonOptions = {
    text: "Export Grids",
    onClick: function() {
        var dataGrid1 = $("#gridContainer1").dxDataGrid("instance");
        var dataGrid2 = $("#gridContainer2").dxDataGrid("instance");
        var workbook = new ExcelJS.Workbook();
        var worksheet1 = workbook.addWorksheet('Costs');
        var worksheet2 = workbook.addWorksheet('Ratings');

        Object.assign(
            worksheet1.getRow(2).getCell(2),
            { value: "Costs:", font: { bold: true, size: 16, underline: 'double' } }
        );
        Object.assign(
            worksheet2.getRow(2).getCell(2),
            { value: "Ratings:", font: { bold: true, size: 16, underline: 'double' } }
        );

        exportDataGrid({
            worksheet: worksheet1, dataGrid: dataGrid1, topLeftCell: { row: 4, column: 2 },
            saveEnabled: false
        }).then(function() {
            return exportDataGrid({
            worksheet: worksheet2, dataGrid: dataGrid2, topLeftCell: { row: 4, column: 2 },
            saveEnabled: true, workbook
            });
        });
    }
};

Implementation Details
ExcelJS library
ExcelJS is a library for reading, manipulating, and writing spreadsheet data and styles to Excel and JSON. See ExcelJS: Browser for more information.
FileSaver library is used
FileSaver is a library for saving files on a client. See FileSaver.js for more information.
Try It
Live Sandboxes
- Add header and footer
- Export two grids into one worksheet
- Export two grids each into a new worksheet
- Simple export scenario
- Customize file name
- Customize workbook, worksheet
- Customize cell
- Manually generate and save XLSX file
- Show dxLoadPanel
Installation
Link exportDxDataGrid, ExcelJS, and FileSaver libraries.
We Need Your Feedback
Take a Quick Poll
Do you need these capabilities when exporting DataGrid in your projects?
Get Notified of Updates
Subscribe to this thread or to our Facebook and Twitter accounts for updates on this topic.
 IgnatovDan
All 6 comments
The initial issue that this one was created from, 5165, included a reference to being able to customise the exported cell appearance for pivotgrids, but that seems to now not be included in here. Will the above changes include customisation of cells exported from pivotgrid too? Or is that being covered elsewhere? Specifically, we need to able to export pivotrgrids to excel which include color-coding of cell backgrounds.
 hassankani
on 8 Apr 2019
hassankani
on 8 Apr 2019
Thank you for contacting us. I fully understand your idea.
Although I cannot promise you that we will implement it in the near future, we will take your opinion into account.
For DataGrid we considered this scenario and published our current results at DevExtreme DataGrid – Excel Data Export Customization Enhancements (v18.2). For PivotGrid, we will manage this scenario in a similar way.
IgnatovDan
on 9 Apr 2019
Hello. We currently have a requirement to add headers/footers to the Excel sheet headers/footers, not as rows in the sheet data. While your examples and suggestions don't meet that, ExcelJS does provide the capability to set these values. Will legitimate header/footer editing be provided out of the box? When will these features be available?
We are currently replacing our grid implementation with another product and this feature is a must-have. Thanks.
 CranMalReign
on 29 Oct 2019
CranMalReign
on 29 Oct 2019
Thank you for describing your scenario.
I suggest that you start from our DevExtreme - Data Grid - New Excel Export API Update (CTP in v19.1) post and the DataGrid.ExcelJS CTP export tickets.
If this information is not enough to implement your task, don't hesitate to create a new ticket. In this case, please send us a simplified project that demonstrates your requirements. This will greatly help us find a suitable solution for your task.
IgnatovDan
on 31 Oct 2019
Hello,
I would love to see this implemented in dxPivotGrid. :)
At the moment I'm implementing a custom export logic using other third-party excel libraries on the server-side.
 cbogner85
on 25 Nov 2019
cbogner85
on 25 Nov 2019
Thank you for contacting us.
We are planning to do this, but I cannot give you the exact date. We will take your opinion into account.
 EugeniyKiyashko
on 26 Nov 2019
EugeniyKiyashko
on 26 Nov 2019
Related issues
 hakimio
·
4Comments
hakimio
·
4Comments
 FabianoCastro
·
5Comments
FabianoCastro
·
5Comments
 yeganesalami
·
8Comments
yeganesalami
·
8Comments
 fubar-coder
·
4Comments
fubar-coder
·
4Comments
 Alyar666
·
10Comments
Alyar666
·
10Comments
Most helpful comment
Hello,
I would love to see this implemented in dxPivotGrid. :)
At the moment I'm implementing a custom export logic using other third-party excel libraries on the server-side.