Deeplabcut: GPU use in training goes to 0% after a few thousand iterations.
Windows 10 OS with Anaconda environment (called dlc) and DeepLabCut version = 2.1.4
Code run using a Jupyter Notebook ans a Nvidia GeForce GTX 1070 GPU
GPU Env Info
tensorboard               1.12.0
tensorflow                1.12.0
tensorflow-base           1.12.0
tensorflow-gpu            1.12.0

# Name                    Version                   Build
cudatoolkit               9.0                           1
cudnn                     7.3.1                 cuda9.0_0
Problem
Occasionally when I run the deeplabcut.train_network(path_config_file, allow_growth=True) command, I see some training on GPU for ~15000 iterations and then the GPU usage falls to 0% while the GPU memory is still in use.
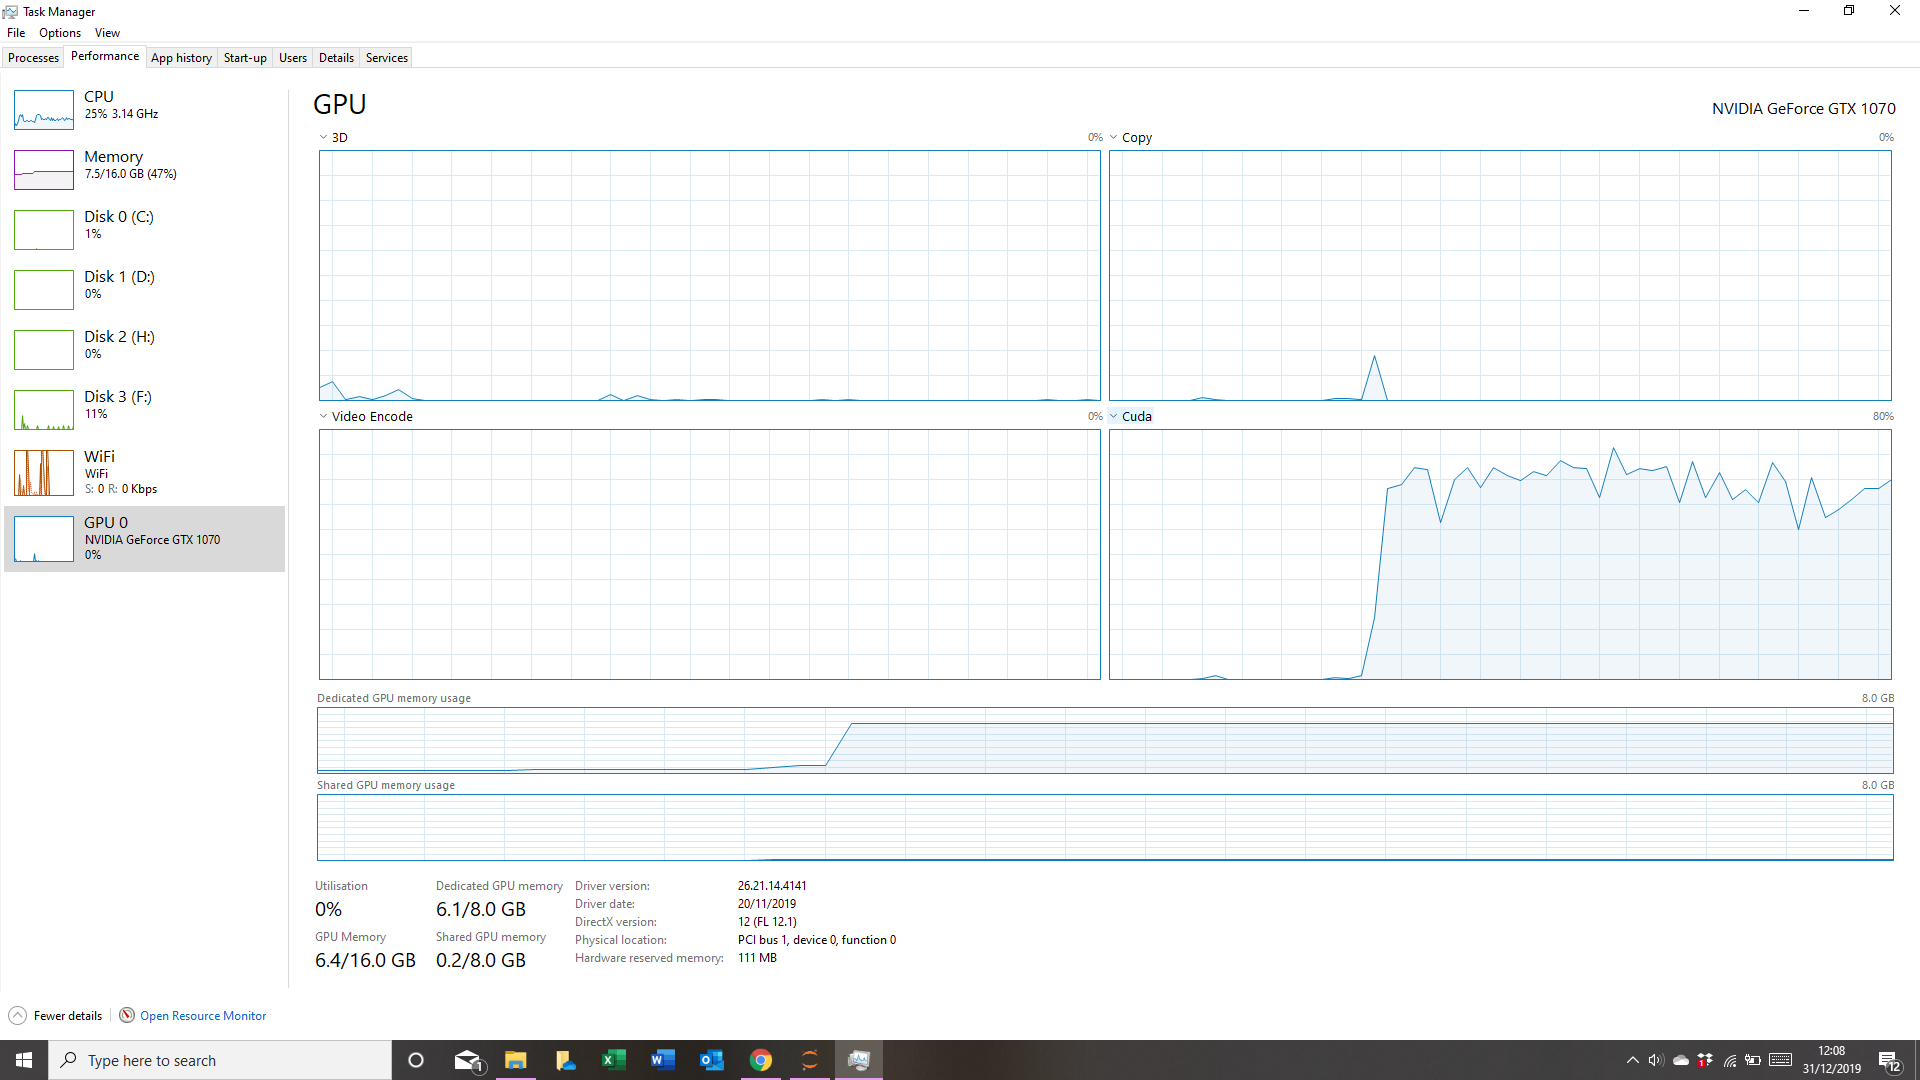

Other times it only runs for a few thousand iterations before stopping.
This occurs regardless of the video upon which I am running the code.
I do not believe it to be a CUDA/TF error (but I have included the verisons of the cudatoolkit and cudnn used within the environment above.
My only other concern was a memory issue which was why I decreased the global scale (to 0.3 for a 1080 by 1920 video) but I found that this did not resolve the problem so I can only assume it is as a result of the number of joints I am using - 43.
Edit
After a little consideration I wanted to check if there was en error when I updated deeplabcut.
Thus I created a fresh install of dlc-windowsGPU.
Without manually changing anything my tensorflow/cuda dependecies became:
# Name                    Version                   Build
tensorboard               1.13.1                   py36_0
tensorflow                1.13.1               h21ff451_8
tensorflow-base           1.13.1                   py36_8
tensorflow-estimator      1.13.0           py36h39e3cac_0
tensorflow-gpu            1.13.1               h0d30ee6_0

cudatoolkit               10.0.130                      0
cudnn                     7.6.5                cuda10.0_0
The problem is the code still experiences the same issue as before.
all_joints:
- - 0
- - 1
- - 2
- - 3
- - 4
- - 5
- - 6
- - 7
- - 8
- - 9
- - 10
- - 11
- - 12
- - 13
- - 14
- - 15
- - 16
- - 17
- - 18
- - 19
- - 20
- - 21
- - 22
- - 23
- - 24
- - 25
- - 26
- - 27
- - 28
- - 29
- - 30
- - 31
- - 32
- - 33
- - 34
- - 35
- - 36
- - 37
- - 38
- - 39
- - 40
- - 41
- - 42
all_joints_names:
- Nose
- Head
- RightEar
- RightEarEnd
- LeftEar
- LeftEarEnd
- Neck04
- Neck03
- Neck02
- Neck01
- Spine02
- Spine01
- Root
- RightShoulder
- RightArm
- RightForeArm
- RightWrist
- RightHand
- RightFinger
- LeftShoulder
- LeftArm
- LeftForeArm
- LeftWrist
- LeftHand
- LeftFinger
- RightLeg
- RightLowerLeg
- RightAnkle
- RightFoot
- RightToe
- LeftLeg
- LeftLowerLeg
- LeftAnkle
- LeftFoot
- LeftToe
- TailBase
- Tail1
- Tail2
- Tail3
- Tail4
- Tail5
- Tail6
- TailEnd
batch_size: 1
bottomheight: 400
crop: False
cropratio: 0.3
dataset: training-datasets\iteration-5\UnaugmentedDataSet_Dogs_Data_Generation_36Jul16\Dogs_Data_Generation_36_J95shuffle1.mat
dataset_type: default
display_iters: 1000
global_scale: 0.3
init_weights: F:\DeepLabTrial\DeepLabCut_trial_dogs\Dogs_Data_Generation_36-J-2019-07-16\dlc-models\iteration-5\Dogs_Data_Generation_36Jul16-trainset95shuffle1\train\snapshot-14000
intermediate_supervision: false
intermediate_supervision_layer: 12
leftwidth: 400
location_refinement: true
locref_huber_loss: true
locref_loss_weight: 0.05
locref_stdev: 7.2801
max_input_size: 1500
metadataset: training-datasets\iteration-5\UnaugmentedDataSet_Dogs_Data_Generation_36Jul16\Documentation_data-Dogs_Data_Generation_36_95shuffle1.pickle
min_input_size: 64
minsize: 100
mirror: false
multi_step:
- - 0.05
  - 10000
- - 0.02
  - 430000
- - 0.002
  - 730000
- - 0.001
  - 1030000
net_type: resnet_50
num_joints: 43
pos_dist_thresh: 17
project_path: F:\DeepLabTrial\DeepLabCut_trial_dogs\Dogs_Data_Generation_36-J-2019-07-16
rightwidth: 400
save_iters: 1000
scale_jitter_lo: 0.5
scale_jitter_up: 1
topheight: 400
Many thanks.
 Gaelic98
All 11 comments
What happens when it stops? Is there a traceback? Or nothing: we have seen a strange issue on some Windows computers, where it stops, BUT if you hit any key it continues. It is still a mystery to us ...
 MMathisLab
on 14 Jan 2020
MMathisLab
on 14 Jan 2020
Could you right-click on the Command Prompt status bar > Properties and verify that Quick Edit Mode is unchecked? Otherwise, unintentional mouse clicks in the window are intercepted and pause the execution of the script.
 jeylau
on 15 Jan 2020
jeylau
on 15 Jan 2020
MMathisLab - There's absolutely nothing - it just stops and says cuda utilization is 0% (in the task manager at least).
Whats strange is that if I hit any key, the process does not continue.
This may be a result of using Anaconda Prompt rather than cmd line.
I've provided some example output
Starting training....
iteration: 100 loss: 0.0022 lr: 0.005
iteration: 200 loss: 0.0034 lr: 0.005
iteration: 300 loss: 0.0025 lr: 0.005
iteration: 400 loss: 0.0024 lr: 0.005
iteration: 500 loss: 0.0023 lr: 0.005
iteration: 600 loss: 0.0025 lr: 0.005
iteration: 700 loss: 0.0024 lr: 0.005
iteration: 800 loss: 0.0022 lr: 0.005
iteration: 900 loss: 0.0024 lr: 0.005
iteration: 1000 loss: 0.0023 lr: 0.005
iteration: 1100 loss: 0.0023 lr: 0.005
iteration: 1200 loss: 0.0024 lr: 0.005
iteration: 1300 loss: 0.0022 lr: 0.005
iteration: 1400 loss: 0.0022 lr: 0.005
iteration: 1500 loss: 0.0024 lr: 0.005
iteration: 1600 loss: 0.0023 lr: 0.005
iteration: 1700 loss: 0.0026 lr: 0.005
iteration: 1800 loss: 0.0022 lr: 0.005
iteration: 1900 loss: 0.0023 lr: 0.005
iteration: 2000 loss: 0.0022 lr: 0.005
iteration: 2100 loss: 0.0022 lr: 0.005
iteration: 2200 loss: 0.0022 lr: 0.005
iteration: 2300 loss: 0.0022 lr: 0.005
jeylau - I've verified that Quick Edit Mode is unchecked. I also unchecked the insert mode option to no avail.
The problem still remains.
Gaelic98
on 15 Jan 2020
^ can you run this dataset on COLAB; I am curious if there is a corrupt image or such. https://github.com/AlexEMG/DeepLabCut/blob/master/examples/COLAB_YOURDATA_TrainNetwork_VideoAnalysis.ipynb
MMathisLab
on 15 Jan 2020
I'll give it a shot later and report back.
Gaelic98
on 16 Jan 2020
any updates, @Gaelic98
MMathisLab
on 29 Jan 2020
I haven't had the chance to run the dataset on the COLAB yet. I have however run it on a CPU server where it seems to be working fine - no drops in performance so I'm suspecting there is something going on with tensorflow and/or windows for my PC rather than a corrupted image(s).
At some point soon, I intend to try our GPU server as well as COLAB to see if there are any issues there.
Gaelic98
on 29 Jan 2020
okay awesome, thanks for the update. We are still having issues reproducing this in house (aside from this find: https://github.com/AlexEMG/DeepLabCut/issues/536#issuecomment-574420706)
MMathisLab
on 29 Jan 2020
I am facing the same issue when running Deeplabcut on windows 10 also with Anaconda environment version = 2.1.6 with NVIDIA Quadro M2000 using .mpg videos. A few times this was resolved by typing something on the keyboard but generally I just have to close the anaconda prompt window (ctrl+c not working). I will try the suggestion of @jeylau and may also just run it on a CPU server, keeping you update.
 KerElena
on 24 Feb 2020
KerElena
on 24 Feb 2020
Besides @jeylau solution, another SOLUTION HERE: https://forum.image.sc/t/training-stops-with-no-error-on-windows10/34520
MMathisLab
on 11 Mar 2020
I find that agrees with what I experienced recently. I updated my driver on my laptop recently and I found that the training did not crash after 50,000+ iterations after which I stopped training as the loss had plateaued.
My solution differed to the one presented in the forum as I had tensorflow-gpu at version 1.12.
Gaelic98
on 12 Mar 2020
Related issues
 tvajtay
·
4Comments
tvajtay
·
4Comments
 Xieyuanting
·
3Comments
Xieyuanting
·
3Comments
 guyts
·
3Comments
guyts
·
3Comments
 cvKDean
·
4Comments
cvKDean
·
4Comments
 vvolhejn
·
4Comments
vvolhejn
·
4Comments
Most helpful comment
Could you right-click on the Command Prompt status bar > Properties and verify that Quick Edit Mode is unchecked? Otherwise, unintentional mouse clicks in the window are intercepted and pause the execution of the script.