Deconz-rest-plugin: 100% CPU Usage
Hi,
I just started using conbee 2 stick with hassio and deconz
After 20 minutes or so deconz starts using 100% CPU (if I restart deconz addon it gets back to only 5% than 20 minutes or so later gets back to 100%)
This is my setup
Hassio : Home Assistant 0.103.0
Conbee2 formware : 264A0700
OS : Debian 10 Buster under VMware ESXi 6.7 u3
Thanks
 Exhortae
All 52 comments
I have similar issue, but 100% CPU usage comes only when I connect via VNC to see network graph. Then if I just close VNC Viewer it stays at 100% CPU. If I close Deconz app (File->Quit) then issue does not seems to appear.
My setup is:
- Conbee II at 264A0700 firmware
- docker container using image marthoc/deconz:aarch64-2.05.71
- host is Orange Pi3 on 5.3 arm64 kernel (Armbian Linux based on Ubuntu 18.04)
- integration with Home Assistant v0.103
 rufik
on 23 Dec 2019
rufik
on 23 Dec 2019
Hi
As it is a new setup I had in fact the vnc viewer and the deconz app open when the cpu hit 100%
I will try your suggestion to close the apps (this week end)
Thanks
Exhortae
on 23 Dec 2019
Hey folks,
was just looking around if someone else was on CPU usage.
Mine isn't that high as yours but I#m having 9-11% all time on raspberry Pi 4 in docker environment.
Just want to ask if that is normal or if we can tweak it a bit?
Using dietpi in latest release as distro.

 nicedevil007
on 28 Dec 2019
nicedevil007
on 28 Dec 2019
I'm getting little bit lower CPU usage for deconz, about 5% on OrangePi 3 (Armbian latest). Running docker container as well. It looks like it's by design :)
rufik
on 30 Dec 2019
Same for me, under 5% with deconz + domoticz on a raspberry 3+, desktop version.
 Smanar
on 30 Dec 2019
Smanar
on 30 Dec 2019
Here's a similar issue regarding high CPU usage: https://github.com/home-assistant/hassio-addons/issues/996
I noticed that this may be somehow caused by devices joining/re-joining the ZigBee network, or maybe devices jumping between nodes. I'm not sure but it seems like it.
That concernes me because I added a TRADFRI bulb lately and playing with it caused this issue a lot. I plan to add some HUE bulbs, Xiaomi sensors and switches now, and if re-joining or jumping between nodes cause that behaviour, than it would could be a huge problem for me in the near future.
To be specific, in my ZigBee network I have 2x CC2530 routers, 1x CC2591 router, 6x Xiaomi sensors, 1x TRADFRI bulb.
 fi-sch
on 25 Feb 2020
fi-sch
on 25 Feb 2020
Just by curiosity, have you try to generate a deconz log during the 100% usage ?
Smanar
on 25 Feb 2020
Do you mean add-on log? There were no errors or any useful info, I suppose.
If you mean something else, let me know what could be valuable (and possibly – how do I get it). I will try to reproduce the issue and provide as much useful information as needed.
fi-sch
on 25 Feb 2020
Nope deconz log, as the problem seem come from it.
You can run deconz with command line and adding some debug option. They will be huge and hard to understand, but I don't see another way to see something.
If you are thinking it is coming from the ikea bulb, have you tried with removing it for some hours to test ?
Smanar
on 25 Feb 2020
Ok, I get it now. Is it possible to make deCONZ log everything to one file and run it normally in background?
I'm not saying it's lightbulb fault. I experienced it number of times before. It's just that last week I bought IKEA bulb for testing and this testing caused this issue to re-appear a few times during one hour. (Example: I was powering it down and checking how many minutes it takes for deCONZ to recognize that it's unavailable.)
fi-sch
on 25 Feb 2020
Yep https://github.com/dresden-elektronik/deconz-rest-plugin/issues/55
On my side I display log on console, but it's possible to redirect then to a file, but take care, the file will be realy huge, not realy good if you are using an SD.
As you need lot of time to have bug, I think it's better doing like me, send log to console, you will loose all informations, but you just need to take a look when you have the 100% cpu bug.
Smanar
on 25 Feb 2020
Yep #55
On my side I display log on console, but it's possible to redirect then to a file, but take care, the file will be realy huge, not realy good if you are using an SD.
As you need lot of time to have bug, I think it's better doing like me, send log to console, you will loose all informations, but you just need to take a look when you have the 100% cpu bug.
Ok, many thanks for explaining. I will try to get some logs then, maybe at the weekend :)
Hopefully someone from dresden elektronik will take a look at this issue. I've written an e-mail some time ago but still did not receive any response from them.
fi-sch
on 26 Feb 2020
I have the same issue of high CPU usage for deconz under docker. First it was my Synology box where all my home assistant, home bridge, etc docker containers were running. Adding the conbee2/deconz slowed the system down, so I moved to Ubuntu under Proxmox on an i5 4core 4GB machine I had lying around.
Deconz/conbee2 is taking ~100% of one core all the time basically. Any word from Dresden?
EDIT: found a comment somewhere the issue was related to uPnP, passed --upnp=0 as a param and now all is good, deconz at 2-5% CPU now.
 FickleLife
on 5 Apr 2020
FickleLife
on 5 Apr 2020
I have the same issue of high CPU usage for deconz under docker. First it was my Synology box where all my home assistant, home bridge, etc docker containers were running. Adding the conbee2/deconz slowed the system down, so I moved to Ubuntu under Proxmox on an i5 4core 4GB machine I had lying around.
Deconz/conbee2 is taking ~100% of one core all the time basically. Any word from Dresden?
EDIT: found a comment somewhere the issue was related to uPnP, passed
--upnp=0as a param and now all is good, deconz at 2-5% CPU now.
Do you experience this issue while connecting via VNC? I experience it mainly (or only?) after using VNC connection. It may be somehow caused by quitting the VNC client without closing the connection properly or something...
If anyone would guide me what's worth checking if that is the case, I will certainly be able to reproduce it on my side and provide anything that may be helpful. It's hard for me to debug it by myself because I'm not an UNIX guy and I don't have any idea how to read system logs (if there's something alarming in those).
Thanks in advance!
fi-sch
on 6 Apr 2020
For me the issue is the same, if I logon using vnc, tigervnc and deconz take 100% of one of my raspberry cores.
Using Hassio on Rapberry 4-conbee 2.
If i Restart Deconz from hassios Supervisor the problem goes away till i log in again.
 christiangrassi
on 13 Apr 2020
christiangrassi
on 13 Apr 2020
I'm experiencing exactly the same issue after moving from RPi to Intel NUC 8, which is obviously much more powerful and stable. This time I'm not running pure Debian Buster with HA Supervised. I moved to HassOS instead.
fi-sch
on 11 May 2020
If you disable the LQI indicator you should solve the issue.
Simple deselect LQI on the top of the screen.
christiangrassi
on 11 May 2020
I have the same issue of high CPU usage for deconz under docker. First it was my Synology box where all my home assistant, home bridge, etc docker containers were running. Adding the conbee2/deconz slowed the system down, so I moved to Ubuntu under Proxmox on an i5 4core 4GB machine I had lying around.
Deconz/conbee2 is taking ~100% of one core all the time basically. Any word from Dresden?
EDIT: found a comment somewhere the issue was related to uPnP, passed
--upnp=0as a param and now all is good, deconz at 2-5% CPU now.
Where did you pass this upnp command?
 mendevi
on 29 May 2020
mendevi
on 29 May 2020
Its the command line used to launch deconz.
It depend how you run it, but you can take a look here https://github.com/dresden-elektronik/phoscon-app-beta/issues/26 (in this example it is to change port)
Smanar
on 29 May 2020
Thank you for the quick response. I got upnp set to 0 but my problem ended
up being the VNC issue.
Any idea if this has been reported as a bug or not?
On Fri, May 29, 2020, 15:44 Smanar notifications@github.com wrote:
Its the command line used to launch deconz.
It depend how you run it, but you can take a look here
dresden-elektronik/phoscon-app-beta#26
https://github.com/dresden-elektronik/phoscon-app-beta/issues/26 (in
this example it is to change port)—
You are receiving this because you commented.
Reply to this email directly, view it on GitHub
https://github.com/dresden-elektronik/deconz-rest-plugin/issues/2218#issuecomment-636154117,
or unsubscribe
https://github.com/notifications/unsubscribe-auth/ANBWAKBMGTZ7BZHAOKFIPMDRUAGC5ANCNFSM4J3B5WTQ
.
mendevi
on 29 May 2020
IDK, this bug is realy rare.
On my side, the only situation I have encounter with something similar is when LQI is enabled, but I never use docker.
Smanar
on 29 May 2020
I can confirm having the same 100% CPU problem on a Ubuntu 18.04.4 VM running in Proxmox, latest official deCONZ deb, 1CPU, 1Gig RAM. Adding the --upnp=0 parameter solved it for me, too.
EDIT:
Sadly, it did not solve the problem. The 100% started again, about half an hour later, but now, the web interface wasn't accessible, too. Reverted the change and hoping for a solution...
 pandel
on 15 Jun 2020
pandel
on 15 Jun 2020
This issue has been automatically marked as stale because it has not had recent activity. It will be closed if no further activity occurs. Thank you for your contributions.
![stale[bot] picture](https://avatars3.githubusercontent.com/in/1724?v=4&s=40) stale[bot]
on 6 Jul 2020
stale[bot]
on 6 Jul 2020
I suppose it's still valid.
IMO, there should be something like automatic connection closing mechanism which would trigger after some time of inactivity (e.g. 15 minutes) or if VNC connection is open for a prolonged time (e.g. 1 hour).
fi-sch
on 6 Jul 2020
Did you update to the latest version?
 Mimiix
on 6 Jul 2020
Mimiix
on 6 Jul 2020
Yup, but being aware of this issue I tried to avoid leaving LQI option 'on' and tried to properly close connection each time I used VNC. No issues so far.
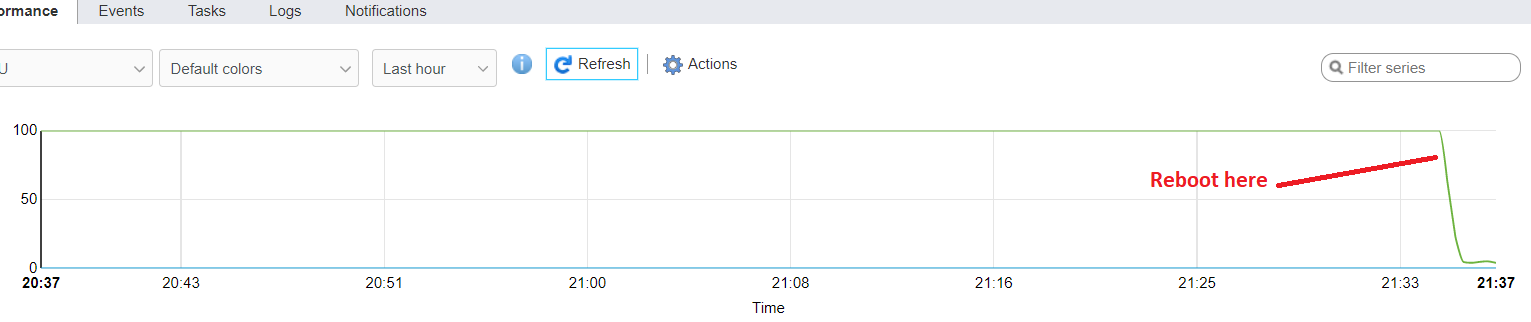
However, I've just tried to reproduce it. I've connected via VNC, turned LQI option on and then I closed VNC client on my mac. Since then CPU usage stays around 56-57%. Before doing so (before connecting via VNC and so on) it was about 7-8%.
Launching VNC client once more and turning off LQI brings CPU back to 7-8%.
fi-sch
on 6 Jul 2020
The conclusion is that just leaving LQI option 'on' cause that issue. Closing connection properly has nothing to do with it, probably.
fi-sch
on 6 Jul 2020
Perhaps some can help:
I am using this on a Ubuntu based server, installed as deb package, running without X. The server is connected to ioBroker home automation server. What is this LQI thing?
pandel
on 6 Jul 2020
Perhaps some can help:
I am using this on a Ubuntu based server, installed as deb package, running without X. The server is connected to ioBroker home automation server. What is this LQI thing?
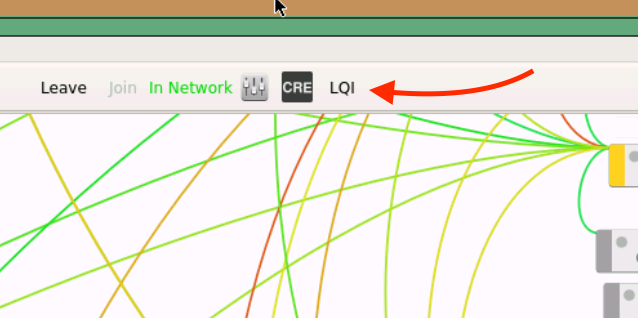
When you turn it on by clicking on it, after a while LQI (Link Quality Index) will appear near each drawn connection line.
fi-sch
on 6 Jul 2020
@fi-sch
Thanks, but you didn't understand: I have no X window system on this machine, it is a basic command line server only!
pandel
on 6 Jul 2020
Sorry, my bad. Indeed you've written about using it without X – I didn't get that.
I'm not sure if that would be possible. There's: https://github.com/ma-ca/deconz-cli-plugin but I don't see such a command to constantly retrieve LQI from all available nodes.
I'd assume that this problematic option makes sense only in deCONZ UI as it draws the "LQI map".
However, I'm not a specialist, nor CLI guy. So let's wait for deCONZ team's answer.
fi-sch
on 7 Jul 2020
:-) - That's why I don't think it has something to do with a GUI feature. My server starts to ramp up to 100% randomly atm. Sometimes it lasts a few days, sometimes it starts right at the beginning. I always know when it happens, because some of my automated lighting scenes simply don't work when it starts... The last version of deconz never had this problem so there seems to be a bug in the upgrade. I thought about building the deb package from source, because we already have .78 as source here and that might help. Sadly, the deb package in the official repo is always behind the sources. I'd appreciate a nightly build highly...
pandel
on 7 Jul 2020
@pandel Please raise a seperate issue for that and provide all the requested input. That really helps us here, thanks!
 SwoopX
on 7 Jul 2020
SwoopX
on 7 Jul 2020
This issue has been automatically marked as stale because it has not had recent activity. It will be closed if no further activity occurs. Thank you for your contributions.
stale[bot]
on 29 Jul 2020
Still valid.
fi-sch
on 29 Jul 2020
@fi-sch I'll add backlog and to-do and get @manup to look into it.
Mimiix
on 29 Jul 2020
That's not a big problem for me personally as I'm aware of this issue and remember to always disable LQI option before leaving VNC. I'm just keeping stale bot away from this unresolved issue :)
It may be highly problematic and confusing for those that are not aware – especially new users (like I was, and dealt with this problem for months). It was really annoying when I was using deCONZ via VNC and then some time after leaving home I was getting high CPU usage warning on my phone. It was also important to me at that time as I was using RPi 4 without any active cooling and with high CPU usage it was simply overheating to dangerous levels.
I did not know why that was happening and even wrote an automation that would restart deCONZ add-on for me when CPU usage or temperature was high for a couple of minutes. That's not what you would expect from such a pricey device.
Maybe it would be enough to put an info about it in known issues or something. Also in readme of deCONZ add-on (yup, I know that it's not maintained by DE).
fi-sch
on 29 Jul 2020
The thing for me is mostly i cannot reproduce it nor we have solid logs :/
However, how long ago was that RPI issue you had? What versions?
Mimiix
on 29 Jul 2020
A few notes: The LQI button in the GUI is only for displaying the link quality between nodes based on the neighbor table entries. It is not very optimized and causes higher CPU usage. So it should only be enabled temporarily to see the values.
The button has otherwise no purpose and doesn't effect query of nodes at all.
When logged in via VNC the CPU usage also increases significantly, depending on the number of nodes on a small network CPU usage should be between 2% to 6%.
 manup
on 29 Jul 2020
manup
on 29 Jul 2020
It was still happening around 3 months ago – at that time I changed the host device. Right now I can still reproduce it on my Intel NUC8 with i3 CPU.
As for logs – sorry but I'm not too familiar with unix and CLI. I'm also using deCONZ add-on for Hass.io on HassOS.
fi-sch
on 29 Jul 2020
When logged in via VNC the CPU usage also increases significantly, depending on the number of nodes on a small network CPU usage should be between 2% to 6%.
For me, AFAIR, it was increasing over time – the longer it (LQI button) was left 'on', the more CPU it consumed. I have network with around 40 devices. When I was using RPi it was about 20-25 devices.
Maybe it would be good idea to turn LQI button off automatically after 30-60 minutes?
fi-sch
on 29 Jul 2020
@fi-sch thanks for mentioning the LQI issue here. I was hitting the 100% CPU usage in my docker container after updating to Phoscon 2.05.79 and had no clue how to resolve it.
Of course I did the update after I tried adding new devices and I was under the impression the new device was causing the high CPU consumption. Luckily the reason was much simpler: just disabled the LQI and the CPU is back to normal.
Adding an auto-timeout on the LQI display in VNC would be a good idea!
 hollie
on 4 Aug 2020
hollie
on 4 Aug 2020
I never use the VNC feature, and still experience at least the unresponsiveness of DECONZ fairly regularly. I'm don't know how to track CPU usage exactly; running Deconz on the RPi as a Hass.IO pluging in HassOS.
 boekabart
on 28 Aug 2020
boekabart
on 28 Aug 2020
@boekabart I'd suggest opening a new issue on this as it is not related to this issue.
Mimiix
on 28 Aug 2020
@boekabart before opening a new issue, can take a look here https://github.com/dresden-elektronik/deconz-rest-plugin/issues/2967
It s an exemple can come from other device than repeater.
Smanar
on 28 Aug 2020
Small update: The LQI view high CPU usage has been fixed in 2.05.81.
manup
on 20 Sep 2020
@Exhortae @fi-sch Could you let me know if .81 fixed it?
Mimiix
on 21 Sep 2020
@Exhortae @fi-sch Could you let me know if .81 fixed it?
Hi Mimiix
Sorry I switched to another zigbee stick
Exhortae
on 21 Sep 2020
@Exhortae Okido.
Mimiix
on 21 Sep 2020
@Exhortae @fi-sch Could you let me know if .81 fixed it?
Unfortunately I can't until deCONZ add-on for Home Assistant gets it's bump to 0.81. I'm waiting for that and hope it gets done this week...
fi-sch
on 21 Sep 2020
I want to report that for me the issue seems to be resolved. I don't see any significant increase in CPU usage when enabling LQI option.
fi-sch
on 15 Oct 2020
@fi-sch Great!
Closing this issue 👍
Mimiix
on 15 Oct 2020
Related issues
 ScharV
·
5Comments
ScharV
·
5Comments
 marthoc
·
6Comments
marthoc
·
6Comments
 horchi
·
5Comments
horchi
·
5Comments
 g0dsCookie
·
3Comments
g0dsCookie
·
3Comments
 qm3ster
·
3Comments
qm3ster
·
3Comments