Ddev: xdebug - breakpoint ignored - standard setup - ubuntu 20.04/ddev/vscode
Describe the bug
I followed the steps here to setup xdebug on ddev with visual studio code: https://ddev.readthedocs.io/en/stable/users/step-debugging/#visual-studio-code-vscode-debugging-setup
However, when I visit my site on my local ddev site through my browser, my breakpoint set on index.php is ignored - the web page fully loads, which tells me that the code has executed beyond my breakpoint set in index.php
A clear and concise description of what the bug is.
To Reproduce
Steps to reproduce the behavior (as per xdebug setup in link above):
"1. Install the php-debug extension."
- done: https://marketplace.visualstudio.com/items?itemName=felixfbecker.php-debug (v1.13.0 by Felix Becker)
"2.Add to the launch.json the stanza defining "Listen for xdebug" (see config snippet)"
Locations:
My git source top level folder for my site code is "gmb-develop"
And my docroot is "web"
And below - this is my launch.json located in gmb-develop/.vscode/launch.json
{
  // Use IntelliSense to learn about possible attributes.
  // Hover to view descriptions of existing attributes.
  // For more information, visit: https://go.microsoft.com/fwlink/?linkid=830387
  "version": "0.2.0",
  "configurations": [
    {
      "name": "Listen for XDebug",
      "type": "php",
      "request": "launch",
      "port": 9000,
      "pathMappings": {
        "/var/www/html": "${workspaceRoot}"
    }
    },
    {
      "name": "Launch currently open script",
      "type": "php",
      "request": "launch",
      "program": "${file}",
      "cwd": "${fileDirname}",
      "port": 9000
    }
  ]
}
"3. Set a breakpoint in your index.php. If it isn't solid red, restart."
- did this in index.php
- my site is a Drupal 7 site
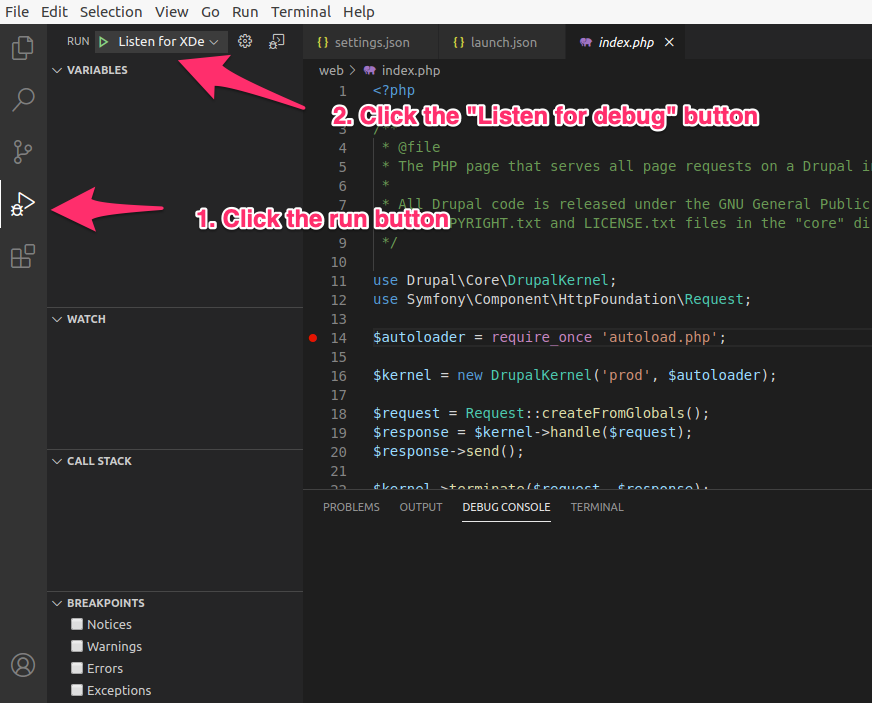
"4. Click the vscode debug button"
"5. Run the "Listen for XDebug" job"

"6. Go to a page in your project, you should hit your breakpoint."
- nothing happens - breakpoint seems to be ignored - page fully loads whereas I'd expect the breakpoint to be hit, so that the code execution doesn't advance past it to load the full page.
This is what I believe to be the debug button, now, in version 1.45.1 of Visual Studio Code I have running on Ubuntu 20.04.


This is different from the icon shown on the steps above ( https://ddev.readthedocs.io/en/stable/users/step-debugging/#visual-studio-code-vscode-debugging-setup ), shown here

Can you confirm that the button I have does the same thing as the button shown in your guide? If so, does your guide need updating?
Expected behavior
A clear and concise description of what you expected to happen.
- breakpoint ignored - as detailed elsewhere in this issue.
Screenshots
If applicable, add screenshots to help explain your problem.
- provided
Version and configuration information (please complete the following information):
- Host computer OS and Version: [e.g. Windows 10, macOS High Sierra]
Ubuntu 20.04 LTS 64 bit, 32Gb RAM i7 quad core, same issue seen on 18.04 - Docker version information (use
docker version) and insert it here. - ddev version information (use
ddev version)
docker version
Client: Docker Engine - Community
 Version:           19.03.11
 API version:       1.40
 Go version:        go1.13.10
 Git commit:        42e35e61f3
 Built:             Mon Jun  1 09:12:34 2020
 OS/Arch:           linux/amd64
 Experimental:      false

Server: Docker Engine - Community
 Engine:
  Version:          19.03.11
  API version:      1.40 (minimum version 1.12)
  Go version:       go1.13.10
  Git commit:       42e35e61f3
  Built:            Mon Jun  1 09:11:07 2020
  OS/Arch:          linux/amd64
  Experimental:     false
 containerd:
  Version:          1.2.13
  GitCommit:        7ad184331fa3e55e52b890ea95e65ba581ae3429
 runc:
  Version:          1.0.0-rc10
  GitCommit:        dc9208a3303feef5b3839f4323d9beb36df0a9dd
 docker-init:
  Version:          0.18.0
  GitCommit:        fec3683
- config.yaml contents for the misbehaving project
cat config.yaml
name: gmb-develop
type: drupal7
docroot: web
php_version: "7.2"
webserver_type: nginx-fpm
router_http_port: "80"
router_https_port: "443"
xdebug_enabled: false
additional_hostnames: []
additional_fqdns: []
provider: default
use_dns_when_possible: true


# This config.yaml was created with ddev version v1.14.2
# webimage: drud/ddev-webserver:v1.14.2
# dbimage: drud/ddev-dbserver-mariadb-10.2:v1.14.1
# dbaimage: phpmyadmin/phpmyadmin:5
# However we do not recommend explicitly wiring these images into the
# config.yaml as they may break future versions of ddev.
# You can update this config.yaml using 'ddev config'.

# Key features of ddev's config.yaml:

# name: <projectname> # Name of the project, automatically provides
#   http://projectname.ddev.site and https://projectname.ddev.site

# type: <projecttype>  # drupal6/7/8, backdrop, typo3, wordpress, php

# docroot: <relative_path> # Relative path to the directory containing index.php.

# php_version: "7.3"  # PHP version to use, "5.6", "7.0", "7.1", "7.2", "7.3", "7.4"

# You can explicitly specify the webimage, dbimage, dbaimage lines but this
# is not recommended, as the images are often closely tied to ddev's' behavior,
# so this can break upgrades.

# webimage: <docker_image>  # nginx/php docker image.
# dbimage: <docker_image>  # mariadb docker image.
# dbaimage: <docker_image>

# mariadb_version and mysql_version
# ddev can use many versions of mariadb and mysql
# However these directives are mutually exclusive
# mariadb_version: 10.2
# mysql_version: 8.0

# router_http_port: <port>  # Port to be used for http (defaults to port 80)
# router_https_port: <port> # Port for https (defaults to 443)

# xdebug_enabled: false  # Set to true to enable xdebug and "ddev start" or "ddev restart"
# Note that for most people the commands
# "ddev exec enable_xdebug" and "ddev exec disable_xdebug" work better,
# as leaving xdebug enabled all the time is a big performance hit.

# webserver_type: nginx-fpm  # Can be set to apache-fpm or apache-cgi as well

# timezone: Europe/Berlin
# This is the timezone used in the containers and by PHP;
# it can be set to any valid timezone,
# see https://en.wikipedia.org/wiki/List_of_tz_database_time_zones
# For example Europe/Dublin or MST7MDT

# additional_hostnames:
#  - somename
#  - someothername
# would provide http and https URLs for "somename.ddev.site"
# and "someothername.ddev.site".

# additional_fqdns:
#  - example.com
#  - sub1.example.com
# would provide http and https URLs for "example.com" and "sub1.example.com"
# Please take care with this because it can cause great confusion.

# upload_dir: custom/upload/dir
# would set the destination path for ddev import-files to custom/upload/dir.

# working_dir:
#   web: /var/www/html
#   db: /home
# would set the default working directory for the web and db services.
# These values specify the destination directory for ddev ssh and the
# directory in which commands passed into ddev exec are run.

# omit_containers: ["db", dba", "ddev-ssh-agent"]
# Currently only these containers are supported. Some containers can also be
# omitted globally in the ~/.ddev/global_config.yaml. Note that if you omit
# the "db" container, several standard features of ddev that access the
# database container will be unusable.

# nfs_mount_enabled: false
# Great performance improvement but requires host configuration first.
# See https://ddev.readthedocs.io/en/stable/users/performance/#using-nfs-to-mount-the-project-into-the-container

# host_https_port: "59002"
# The host port binding for https can be explicitly specified. It is
# dynamic unless otherwise specified.
# This is not used by most people, most people use the *router* instead
# of the localhost port.

# host_webserver_port: "59001"
# The host port binding for the ddev-webserver can be explicitly specified. It is
# dynamic unless otherwise specified.
# This is not used by most people, most people use the *router* instead
# of the localhost port.

# host_db_port: "59002"
# The host port binding for the ddev-dbserver can be explicitly specified. It is dynamic
# unless explicitly specified.

# phpmyadmin_port: "8036"
# phpmyadmin_https_port: "8037"
# The PHPMyAdmin ports can be changed from the default 8036 and 8037

# mailhog_port: "8025"
# mailhog_https_port: "8026"
# The MailHog ports can be changed from the default 8025 and 8026

# webimage_extra_packages: [php-yaml, php7.3-ldap]
# Extra Debian packages that are needed in the webimage can be added here

# dbimage_extra_packages: [telnet,netcat]
# Extra Debian packages that are needed in the dbimage can be added here

# use_dns_when_possible: true
# If the host has internet access and the domain configured can
# successfully be looked up, DNS will be used for hostname resolution
# instead of editing /etc/hosts
# Defaults to true

# project_tld: ddev.site
# The top-level domain used for project URLs
# The default "ddev.site" allows DNS lookup via a wildcard
# If you prefer you can change this to "ddev.local" to preserve
# pre-v1.9 behavior.

# ngrok_args: --subdomain mysite --auth username:pass
# Provide extra flags to the "ngrok http" command, see
# https://ngrok.com/docs#http or run "ngrok http -h"

# disable_settings_management: false
# If true, ddev will not create CMS-specific settings files like
# Drupal's settings.php/settings.ddev.php or TYPO3's AdditionalSettings.php
# In this case the user must provide all such settings.

# no_project_mount: false
# (Experimental) If true, ddev will not mount the project into the web container;
# the user is responsible for mounting it manually or via a script.
# This is to enable experimentation with alternate file mounting strategies.
# For advanced users only!

# provider: default # Currently either "default" or "pantheon"
#
# Many ddev commands can be extended to run tasks before or after the
# ddev command is executed, for example "post-start", "post-import-db",
# "pre-composer", "post-composer"
# See https://ddev.readthedocs.io/en/stable/users/extending-commands/ for more
# information on the commands that can be extended and the tasks you can define
# for them. Example:
#hooks:
#  post-import-db:
#    - exec: drush cc all
- Do you have any custom configuration (nginx, php, mysql) in the .ddev folder? If so, have you tried without them?
your guide at: https://ddev.readthedocs.io/en/stable/users/step-debugging/#visual-studio-code-vscode-debugging-setup
says:
"By default, ddev is set up to contact the default port, port 9000 on your IDE. However, if you have something else listening on that port, you'll need to change the port. (The most likely conflict is php-fpm, which also has 9000 as a default port.)"
I don't believe I have php-fpm - I've just gone with whatever ddev provides when doing ddev config, ddev start.
Additional context
Add any other context about the problem here. Thanks!
ddev --version
ddev version v1.14.2
xdebug is excellent but I despair with setting it up, it seems to be often fiddly and there are nuances whereby subtle things slip through the cracks. I'm done with sh*tty poxy print_r and need the big folks proper tools of xdebug again.
I will say that anyone who says xdebug is zero config is talking absolute BS (I'm looking directly face on, sternly at you, PHPStorm - don't waste my time I won't get back). I switched to Visual Studio Code because I couldn't see any value in paying for PHP Storm anymore - it's overrated I think.
Thank you ddev team for a wonderful tool. I hope all the information I've taken the time to give describing my standard, not unusual setup, is helpful.
 therobyouknow
All 3 comments
You don't seem to mention enabling xdebug, it's disabled by default. ddev xdebug enable - maybe I missed that in your description.
There's a full step-by-step debugging routine at https://stackoverflow.com/a/49696596/215713
BTW, I do always recommend that people do PHPStorm first because it is easier, despite your suspicion. All of the other IDEs are also easy once you've got one going and understand what's happening.
 rfay
on 11 Jun 2020
rfay
on 11 Jun 2020
I didn't have any trouble getting this going except my general unfamiliarity with vscode and where the launch.json was. But once I found the launch.json in the config, did a ddev xdebug enable, clicked the "run" button and clicked the "Listen for xdebug" button, it worked perfectly. Tested on Ubuntu 20.04 with vscode 1.46.0.

rfay
on 11 Jun 2020
jackpot @rfay fella. You were absolutely right!
It was xdebug not enabled.
ddev xdebug enable
I had my "horse blinkers" on following those six steps https://ddev.readthedocs.io/en/stable/users/step-debugging/#visual-studio-code-vscode-debugging-setup
Thank you very much!
I can now floor it, put my foot on with the gas, with dev work. No more sh*tty tin-pot print_r bye bye!
therobyouknow
on 11 Jun 2020
Related issues
 rthideaway
·
7Comments
rthideaway
·
7Comments
 juergen-venne
·
7Comments
therobyouknow
·
5Comments
juergen-venne
·
7Comments
therobyouknow
·
5Comments
 localhorst
·
7Comments
localhorst
·
7Comments
 jcnventura
·
3Comments
jcnventura
·
3Comments
Most helpful comment
You don't seem to mention enabling xdebug, it's disabled by default.
ddev xdebug enable- maybe I missed that in your description.There's a full step-by-step debugging routine at https://stackoverflow.com/a/49696596/215713
BTW, I do always recommend that people do PHPStorm first because it is easier, despite your suspicion. All of the other IDEs are also easy once you've got one going and understand what's happening.