Dd-trace-js: dd-trace reports its own activity as APM http traces
Describe the bug
Datadog is receiving extremely frequent traces like the attached screenshot, which are tracing the activity of dd-trace itself sending traces to the agent on localhost.
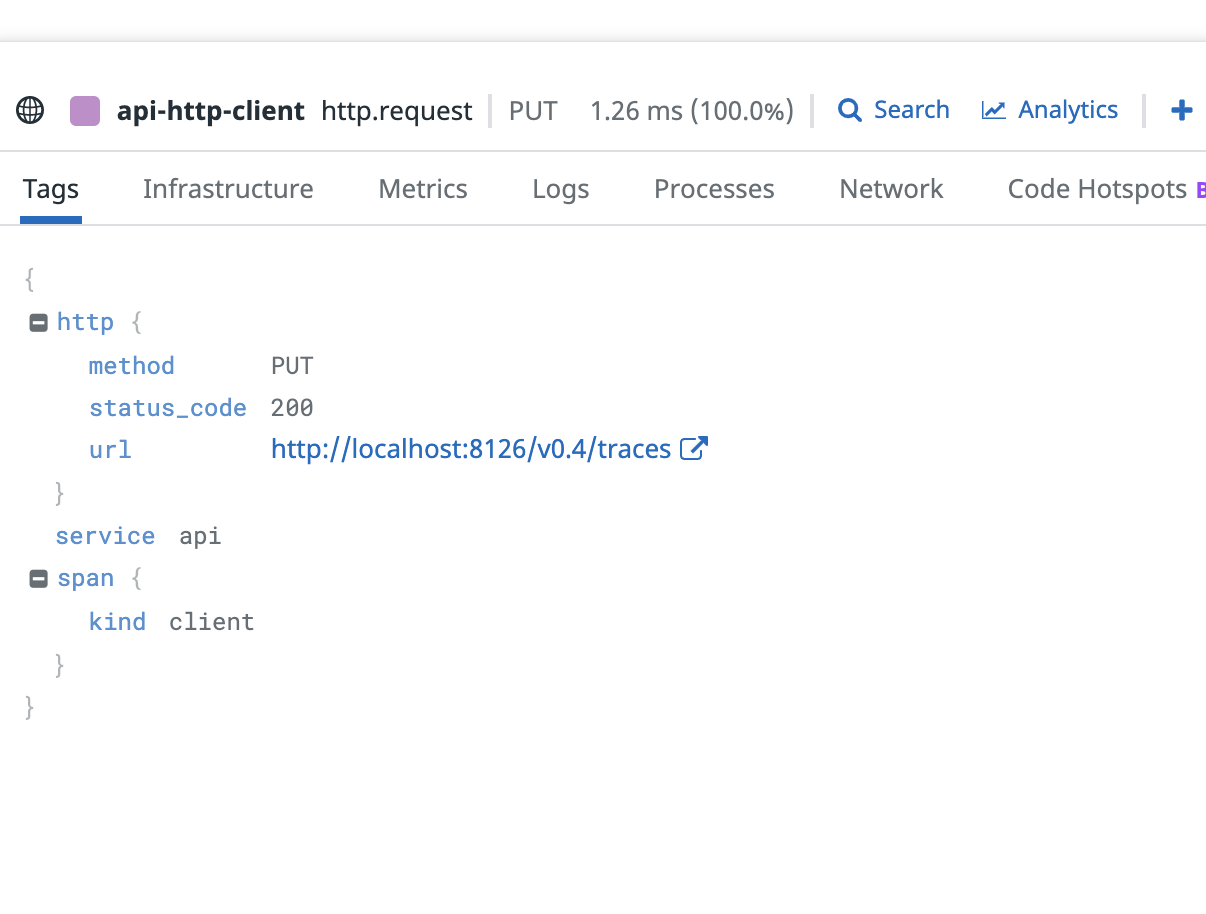
A workaround is manually adding the URL to the http blocklist solves the issue, like this
import tracer from 'dd-trace'
tracer.init()
tracer.use('http', {
  blocklist: ['http://localhost:8126/v0.4/traces']
})
export default tracer
Environment
Running in ECS Fargate with agent as a sidecar container.
"datadog/agent:latest"
Agent container definition (in Terraform HCL representation, not JSON)
  datadog_agent_container_definition = {
    name      = "datadog-agent"
    image     = "datadog/agent:latest"
    essential = true
    environment = [
      {
        name  = "DD_APM_ENABLED"
        value = "true"
      },
      {
        name  = "ECS_FARGATE"
        value = "true"
      }
    ]
    secrets = [
      {
        name      = "DD_API_KEY",
        valueFrom = data.aws_secretsmanager_secret.datadog_api_key.arn
      }
    ]
    # Expose port 8126 so that the dd-trace instrumentation in our app can deliver traces to
    # the Datadog agent
    portMappings = [
      {
        hostPort      = 8126
        protocol      = "tcp"
        containerPort = 8126
      },
    ]
    # Apply tight limits on how much CPU/memory can be used by the agent container.
    cpu    = 10
    memory = 256
    # Define these empty values to avoid unnecessary diffs (default is [], Terraform tries to set 'null')
    mountPoints = []
    volumesFrom = []
  }
App container definition:
base_container_definition = {
    name  = local.app_container_name
    image = var.image
    essential = true
    environment = [

      {
        name  = "DD_TRACE_AGENT_HOSTNAME"
        value = "localhost"
      },
      {
        name  = "DD_SERVICE"
        value = var.name
      }
    ]
    logConfiguration = {
      logDriver = "awsfirelens"
      options = {
        Name           = "datadog"
        apikey         = local.datadog_api_key
        Host           = "http-intake.logs.datadoghq.com"
        dd_service     = var.name
        dd_source      = "firelens"
        dd_message_key = "log"
        TLS            = "on",
        provider       = "ecs"
      }
    }
    # Define these empty values to avoid unnecessary diffs (default is [], Terraform tries to set 'null')
    cpu          = 0
    mountPoints  = []
    volumesFrom  = []
    portMappings = []
  }
- Node version:
14 - Tracer version:
$ yarn list dd-trace
yarn list v1.22.10
└─ [email protected]
- Agent version:
:latesttag
 werkshy
All 16 comments
Same problem here
 fabiano-amaral
on 19 Feb 2021
fabiano-amaral
on 19 Feb 2021
Same here
Agent version: latest tag
dd trace: 0.24.1
 0xkalvin
on 23 Feb 2021
0xkalvin
on 23 Feb 2021
Tried excluding this using DD_APM_IGNORE_RESOURCES, but the doc has no info about valid regex formats or how to debug. My valid regular expressions in go or javascript failed, so I ended up using DD_APM_IGNORE_RESOURCES="PUT.*" which is just terrible.
 christiangjengedal
on 24 Feb 2021
christiangjengedal
on 24 Feb 2021
Also using the blocklist workaround to avoid these PUT requests on my production metrics
const datadog = require('dd-trace')

function init ({ service }) {
  datadog.init({
    service,
    runtimeMetrics: true,
  })

  datadog.use('http', {
    blocklist: [
      'http://127.0.0.1:8126/v0.4/traces',
      'http://127.0.0.1:8126/v0.5/traces',
    ],
  })
}
We've just released a fix for a bug that ignored the sampling flag in some cases which also affected blocked URLs. I wasn't able to reproduce a case where explicitly adding a URL to the blocklist changed the behaviour however, so please let me know if the issue is resolved with 0.31.3.
 rochdev
on 25 Mar 2021
rochdev
on 25 Mar 2021
@rochdev the issue seems to be fixed in 0.31.3, I have removed the blocklist entry for http://localhost:8126/v0.4/traces and I am not seeing any of those PUT traces to that URL.
Thank you.
werkshy
on 26 Mar 2021
I am still experiencing the PUT request issue on 0.31.4
 justinlesko
on 29 Mar 2021
justinlesko
on 29 Mar 2021
@justinlesko Can you provide a reproduction snippet? I can no longer reproduce this with our example app.
rochdev
on 30 Mar 2021
@rochdev I am also seeing the issue on 0.31.4. We initialize DD with:
  tracer.init({
    logInjection: true,
    analytics: true,
  });

  tracer.use('http', {
    blocklist: ['/health'],
  });
 g-guirado
on 30 Mar 2021
g-guirado
on 30 Mar 2021
I'm seeing this with 0.31.4 and 6.26.0 agent as well
 jprosevear
on 7 Apr 2021
jprosevear
on 7 Apr 2021
We need a reproduction snippet or app because we can no longer reproduce this with the fix.
rochdev
on 7 Apr 2021
Tested with 0.31.3 and 0.31.4, same issue. Stripped it down to just:
const tracer = require('dd-trace').init();
tracer.use('express');
Node 14.2.0 and Express. PUT occurs ever 2 seconds after the first trace is submitted (but not before).

Maybe some additional dep thats not locked is causing an issue?
jprosevear
on 7 Apr 2021
Node 12.22.1 and 14.16.1 same issue.
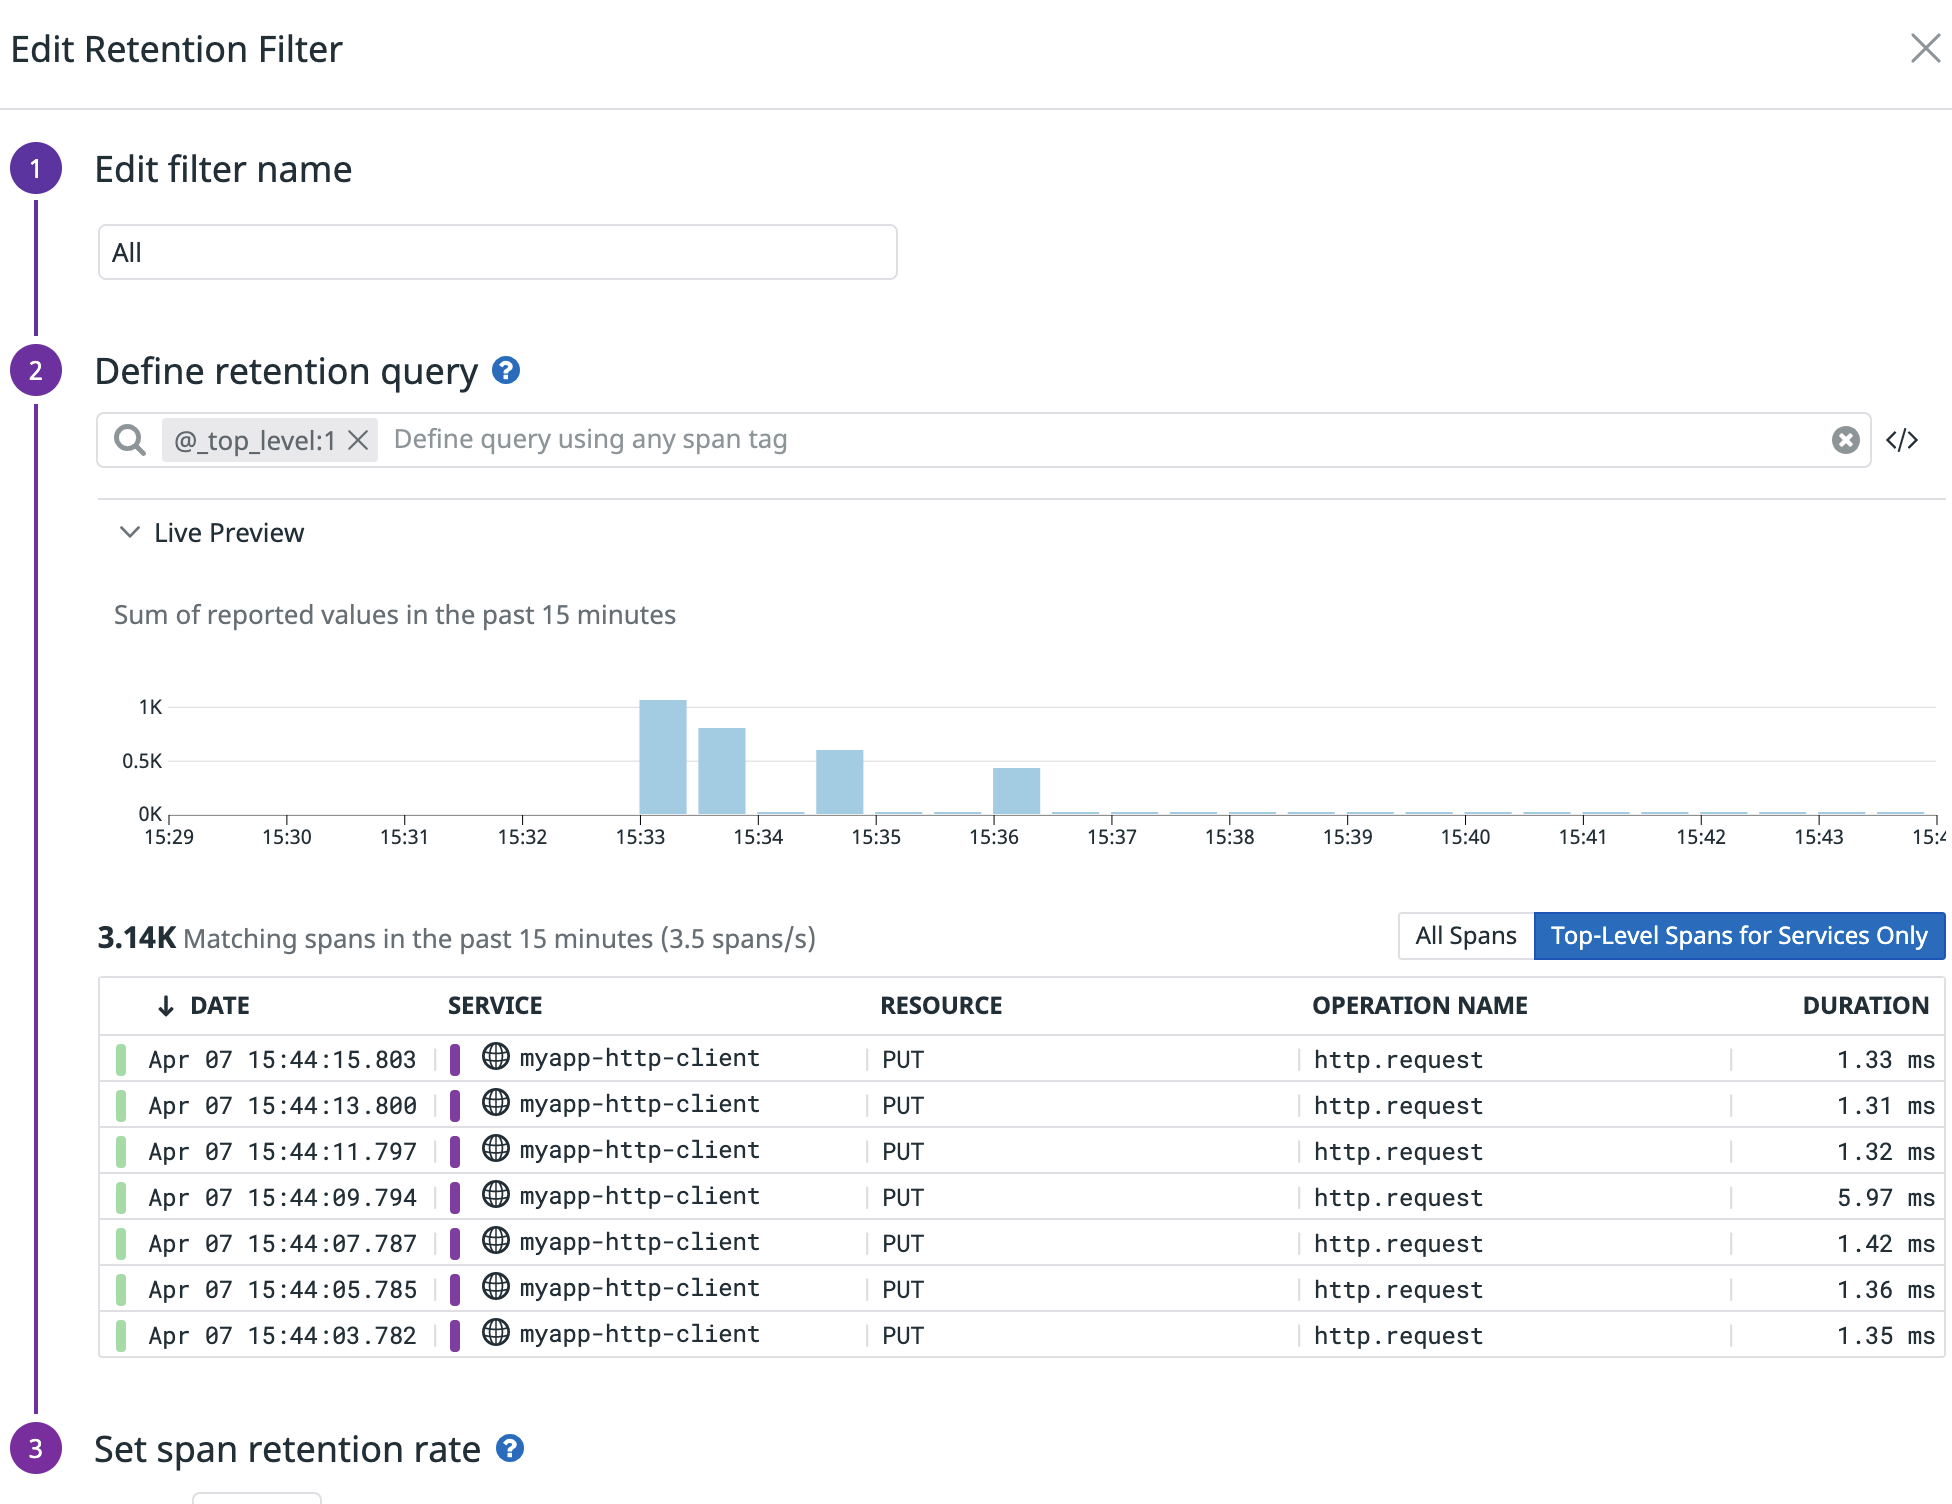
Could this be impacted by ingestion control and retention filters?
jprosevear
on 7 Apr 2021
Could this be impacted by ingestion control and retention filters?
No, because these traces should never leave the tracer. I'm surprised how easy this seems to have been reproduced since I wasn't able to reproduce on my end after the fix. I'll try again and report back.
rochdev
on 7 Apr 2021
Thanks @rochdev let me know if I can test/help
jprosevear
on 8 Apr 2021
@jprosevear The issue should now _actually_ be fixed in 0.32.0. Please feel free to reopen if you're still having any issue!
rochdev
on 13 Apr 2021
Related issues
 blugavere
·
3Comments
blugavere
·
3Comments
 kumaraksi
·
5Comments
kumaraksi
·
5Comments
 edrich-xendit
·
3Comments
edrich-xendit
·
3Comments
 millerick
·
5Comments
millerick
·
5Comments
 kappj
·
4Comments
kappj
·
4Comments
Most helpful comment
We've just released a fix for a bug that ignored the sampling flag in some cases which also affected blocked URLs. I wasn't able to reproduce a case where explicitly adding a URL to the blocklist changed the behaviour however, so please let me know if the issue is resolved with 0.31.3.