Dd-trace-js: Make custom span a parent of all subsequent spans until it ends
Request
It's entirely possible that I just don't know how to use this library properly and this feature already exists (which would be great), but I would like to request a feature to set a custom span as a currently active span.
Issue:
Here is a sample express code:
const tracer = require("dd-trace");

tracer.init({
  env: "local",
  hostname: process.env.DD_HOST,
  service: "tk-mock-trace",
  plugins: true,
});

const express = require("express");
const http = require("http");

const app = express();
const port = 3000;

app.get("/", (_, res) => {
  const mySpan = tracer.startSpan("mySpan", {
    childOf: tracer.scope().active(),
  });
  http.get("http://google.com", () => {
    mySpan.finish();
    res.send("Let there be trace!");
  });
});

app.listen(port, () => {
  console.log(`server up`);
});
Running this gets me this trace:
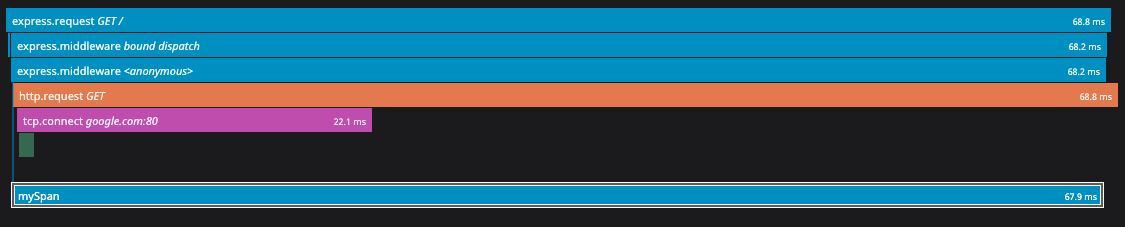
All spans except the mySpan span are auto-generated via dd plugins; and in this example,I simply want to be able to make http.request related spans to become its children. Ultimately, I want a way to set all subsequent spans children of mySpan, until mySpan has finished.
I know that I could use tracer.scope().activate(...) to do something like this, but in the example above, there really isn't a function that I can pass as an argument for activate, because all I know is a start/endpoints. In a situation where we want to create a custom span that gets started/finished based on a library's lifecycle hooks (e.g. Apollo Server Hooks) we would want a functionality like this.
 t-kwak
All 8 comments
Can you share an example using Apollo Server Hooks of what you are trying to achieve that is not working? Generally speaking it should be possible to do what you want with tracer.trace() if the library was written to be APM compatible.
Unrelated but may I ask where you found the documentation for startSpan? We've been trying to deprecate it for a long time outside of OpenTracing and it's unclear where users are still finding the documentation to use it as it's been replaced by tracer.trace().
 rochdev
on 2 Feb 2021
rochdev
on 2 Feb 2021
Thank you for the response!
Simple Apollo Server Plugin Example:
Let's say I want to track how long it takes to parse a GQL request:
// @ts-nocheck
import {ApolloServerPlugin} from 'apollo-server-plugin-base';
import tracer from 'dd-trace';

const sampleTracingPlugin: ApolloServerPlugin = {
  requestDidStart() {
    return {
      parsingDidStart() {
        const mySpan = tracer.startSpan('parsing_span', {
          childOf: tracer.scope().active(),
        });
        return () => mySpan.finish();
      },
    };
  },
};

export default sampleTracingPlugin;
This gets us:

In this example, we want graphql.parse to be a child of the main span.
My bigger concern/question is that, it sounds like the only way to properly set up a span around a certain operation is for that operation to be fully encompassed by a function? I suppose that is a good practice in general, but prod codebases are rarely refactored well, and sometimes we just want to "start a span here, end that span there, an make all other spans in-between its children," even if staring/endpoints are in two separate functions. It also sounds like, if we are building an internal tool, and we want to allow devs to measure performance using their preferred tool, exposing simple XyzDidStart/XyzDidFinish hooks isn't going to be enough?
To answer your question, I found startSpan in what I thought was official API doc (https://datadoghq.dev/dd-trace-js/interfaces/tracer.html)
t-kwak
on 2 Feb 2021
My bigger concern/question is that, it sounds like the only way to properly set up a span around a certain operation is for that operation to be fully encompassed by a function?
Unfortunately it's the only way to ensure that context is propagated properly. The original scope manager of dd-trace worked similar to what you proposed above, and while it was slightly more flexible, it was also a lot more prone to misuse and memory leaks.
Another issue when using this kind of API with something like hooks is that you have no guarantee of the asynchronous context where the hook is executed. For example, it could be scheduled for execution with a timer, in which case you would end up activating the span on the wrong scope which would not work and could cause unexpected side-effects. If for any reason _exit is not called at the right moment, it could also cause memory leaks and all sorts of issues.
Said that, for your use case I think there are 3 options:
1) Apollo should expose hooks that allow wrapping the request since otherwise it means it doesn't support APM tools (all APM vendors work the same way for context propagation to my knowledge).
2) You could rely on auto-instrumentation, assuming we add the missing functionalities that you need for Apollo. We are actually planning to add Apollo support but it's unclear why the GraphQL plugin alone is not enough. If you can explain in details the spans and/or metadata that you would like to see that the GraphQL plugin is missing, it would be very helpful for us to add official support. We also welcome external contributions if you want to give it a shot.
3) You could use the private API of the scope manager to manually enter/exit the scope. This is not available on the default scope manager but if you use the one based on executionAsyncResource with tracer.init({ scope: 'async_resource' }) then you would have access to the _enter and _exit methods. This is hacky and should definitely be used as a last resort, but it might work to unblock you short term assuming that the Apollo hooks are called synchronously. It's extremely important that _exit is called in the same asynchronous context as _enter however, so it should not be called in a hook that is only called after the request has a response.
I would say that if you're going to implement a solution based on 3, it should only be done if 1 and/or 2 will be implemented soon, because otherwise depending on the tracer internals might break in a future version. The same applies if Apollo changes how the hooks are called internally.
Happy to work with you on an Apollo integration if you can provide more details of exactly what the trace should look like.
To answer your question, I found startSpan in what I thought was official API doc
Thank you for validating that. It is indeed the official API doc, I guess we should make it more obvious that tracer.trace() is the preferred API
rochdev
on 2 Feb 2021
Okay, that's fair - thank you so much for a detailed answer. To give you more context, we are primarily interested in tracing the internal workings of Apollo Gateway, but I think plugins for a general Apollo Server would be a nice-to-have too. I'd be more than happy to make the contribution if that is the optimal route, but I'd need a couple of days to digest this a bit and sync internally for me to determine next steps on my end, and I'll respond here. Just wanted to give you a heads up so you don't think I just dropped off. Thanks again :)
t-kwak
on 2 Feb 2021
We're running into this at work. We've got a bunch of manually-implemented Spans, and they all seem to be siblings (rather than parents) of the auto-instrumented Spans. It seems this is happening because we've got a bunch of code that uses the OpenTracing API so it does Tracer#startSpan and Span#finish. We do this because different environments use different Tracers (development uses Jaeger, production uses DataDog).
It makes sense that dd-trace would have its own API that makes things easier, but it's a bit disappointing to not be able to have our manually-implemented Spans be parents of the auto-instrumented Spans without rewriting all of our code to use dd-trace (aside from relying on the private API). Doing so would mean losing the ability to trace in development–as I understand it anyway, since I don't believe dd-trace can export to Jaeger, for example.
I wonder though, is it possible to solve this with something like Tracer#inject? I don't know if the auto-instrumented Spans use Tracer#extract on the other end, so maybe I'm barking up the wrong tree. Any thoughts on whether that might be feasible?
 joneshf-cn
on 25 Feb 2021
joneshf-cn
on 25 Feb 2021
@joneshf-cn Scope management never landed in OpenTracing since the project is now deprecated. The only options would be to either use the dd-trace API directly, or switch to OpenTelemetry which has replaced OpenTracing. Both options support scope management but there are trade-offs. For example, using OpenTelemetry you would be gaining support for multiple simultaneous vendors, but losing a lot of visibility as our feature set is much larger than what OpenTelemetry provides.
rochdev
on 25 Feb 2021
I see. Thanks for explaining why that's not possible. Also, thanks for explaining what the options are!
joneshf-cn
on 25 Feb 2021
It looks like this question has been answered, so I'll close it. @t-kwak or @joneshf-cn if either of you have any more related questions, please feel free to reopen this, comment, or make a new issue as appropriate.
 bengl
on 19 May 2021
bengl
on 19 May 2021
Related issues
 vecerek
·
3Comments
vecerek
·
3Comments
 jprosevear
·
4Comments
jprosevear
·
4Comments
 blugavere
·
3Comments
blugavere
·
3Comments
 bojand
·
4Comments
bojand
·
4Comments
 nickpresta
·
5Comments
nickpresta
·
5Comments