Dd-trace-js: Differentiate remote http-client endpoints
I created a new Serverless Framework project, with the datadog plugin installed.
custom:
  webpack:
    webpackConfig: ./webpack.config.js
    includeModules: true
  datadog:
    addLayers: true
    logLevel: "info"
    flushMetricsToLogs: true
    site: datadoghq.eu
    enableXrayTracing: true
    enableDDTracing: true
    forwarder: arn:aws:lambda:eu-west-1:xxxxxxxxxxxxxxxx:function:dd-func-test-Forwarder-xxxxx
    enableTags: true
Then updated the function.
import { APIGatewayProxyHandler } from "aws-lambda";
import "source-map-support/register";
import fetch from "node-fetch";

export const hello: APIGatewayProxyHandler = async (event, _context) => {
  await fetch("https://jsonplaceholder.typicode.com/todos/1")
  try {
    await fetch("http://httpstat.us/500");
  } catch(e) {
    console.log("error calling httpstat.us", e);
  }
  return {
    statusCode: 200,
    body: JSON.stringify(
      {
        message:
          "Go Serverless Webpack (Typescript) v1.0! Your function executed successfully!",
        input: event,
      },
      null,
      2
    ),
  };
};
The code makes 2 HTTP requests, but when I look at the Service Map, I can only see one service (http-client).
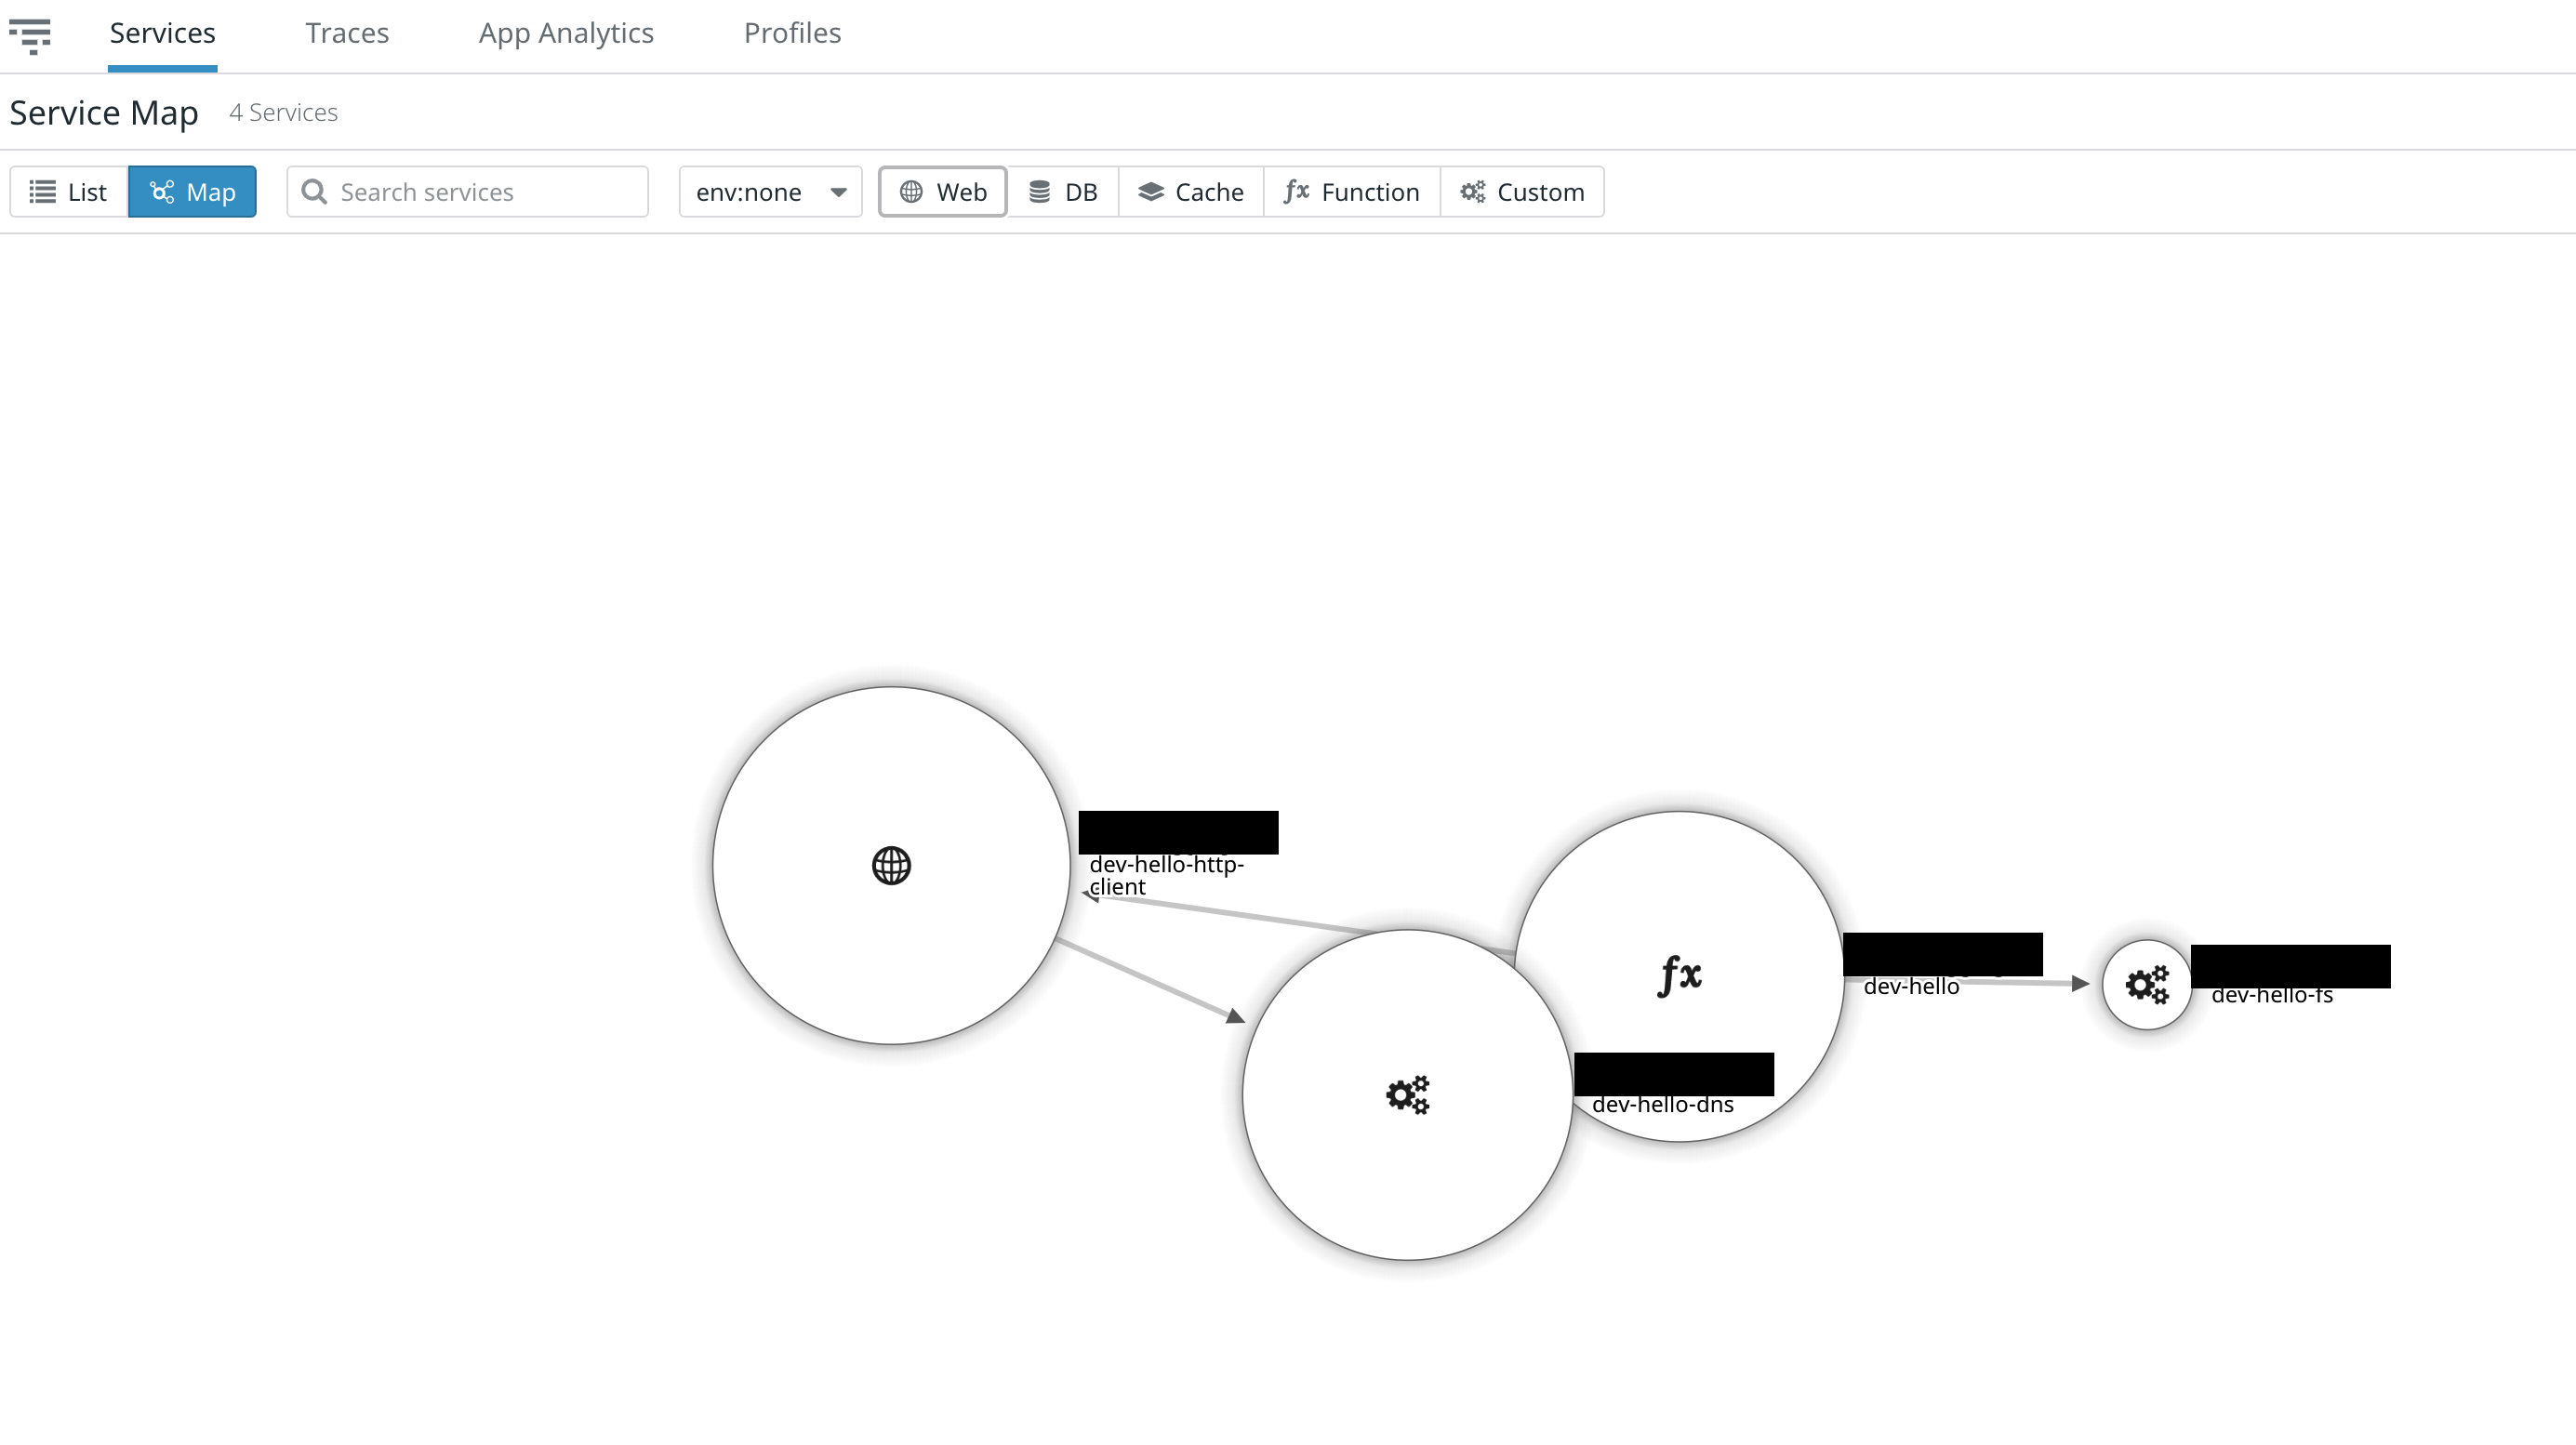
One of them is returning 500 consistently (it's supposed to!), the other is working fine, and Datadog can differentiate on the hosts.
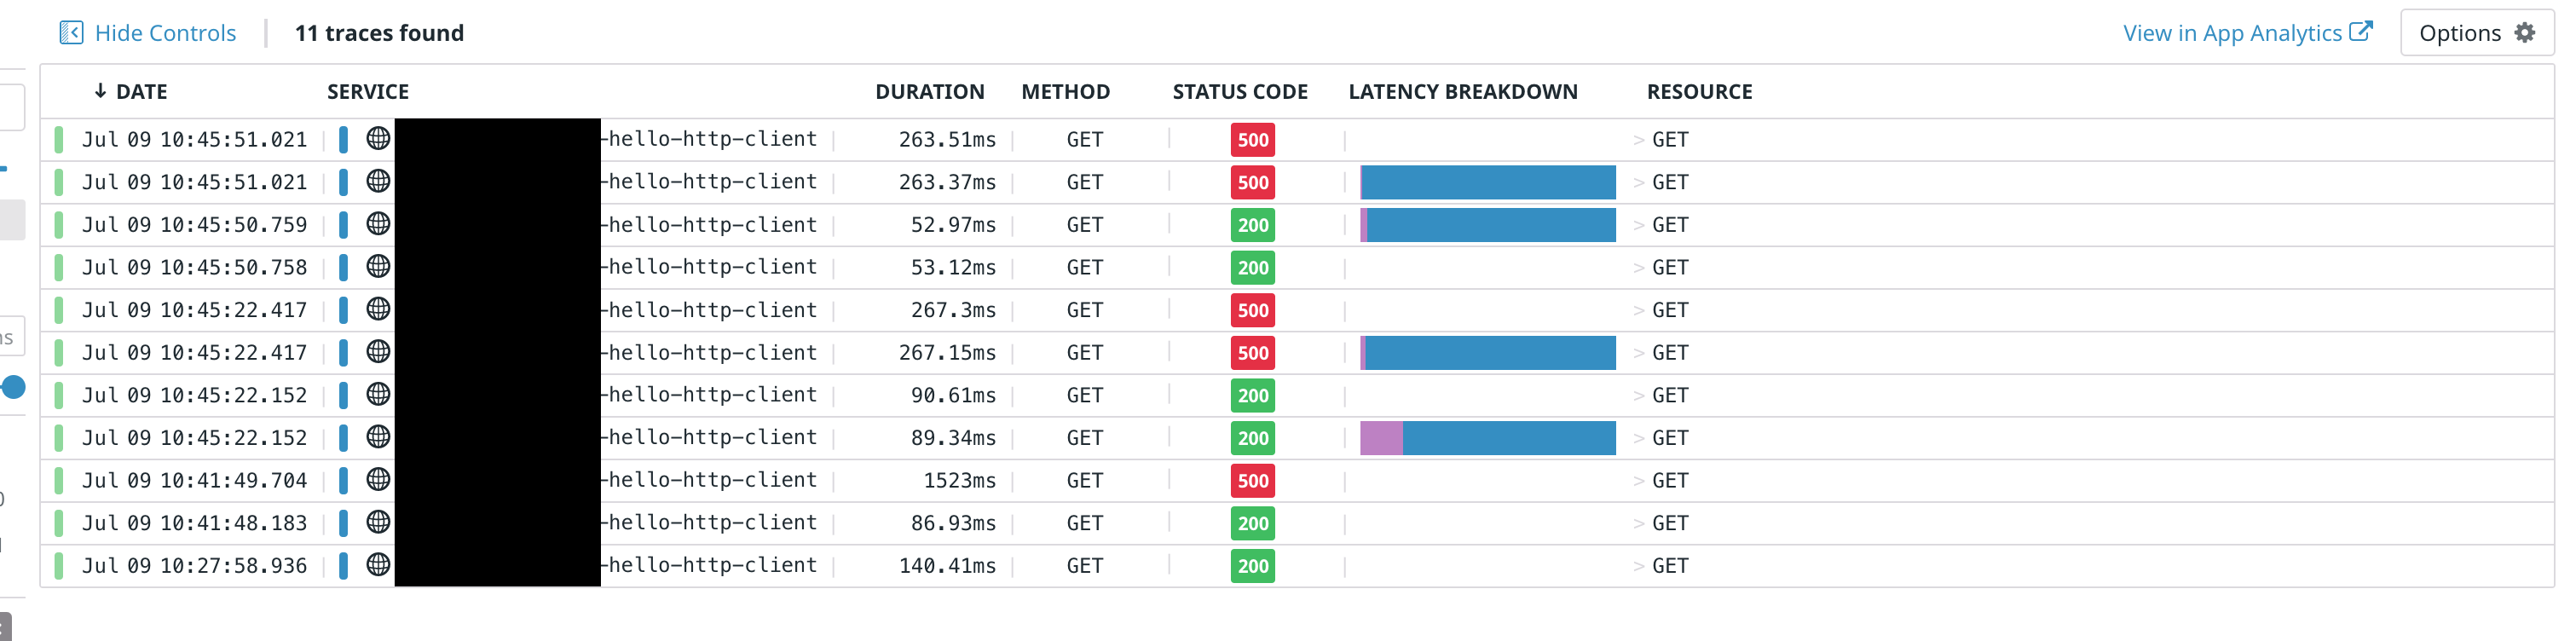
It seems very clear that they're separate services. Is there a way to differentiate those fetch calls?
I'd expect each domain (i.e. jsonplaceholder.typicode.com, httpstat.us) to automatically be shown as a distinct service, and maybe have to manually distinguish where path segments are used to differentiate API calls. For example you might use https://api.example.com/service1 and https://api.example.com/service2 as prefixes.
 a-h
a-h
All 2 comments
It's possible to split client HTTP requests by domain by using the splitByDomain option on the plugin.
For example:
tracer.use('http', {
  splitByDomain: true
})
This won't break them down by path, but it will break them out by instance. You can then further split by path in search and in analytics, but not on the service page. The reasoning is that in general, if multiple paths represent multiple services, it means there is a proxy in front of the services that will forward the request, in which case there is actually multiple backend services sitting behind. By instrumenting the proxy and/or the backend services, you would then get the full picture.
Please let me know if that works for your use case!
 rochdev
on 9 Jul 2020
rochdev
on 9 Jul 2020
Thanks for that. With the Datadog Serverless plugin, there's no hook to configure the tracer, but I imported the modules as shown in some of the other Node.js examples to allow that.
// This must be the first import.
import ddtrace from "dd-trace";
const tracer = ddtrace.init();
tracer.use("http", {
  splitByDomain: true,
});

import { APIGatewayProxyHandler } from "aws-lambda";
import "source-map-support/register";
import fetch from "node-fetch";
import { datadog, sendDistributionMetric } from "datadog-lambda-js";

export const handler: APIGatewayProxyHandler = async (_event, _context) => {
  const jsonSpan = tracer.startSpan("call_json_placeholder")
  await fetch("https://jsonplaceholder.typicode.com/todos/1");
  jsonSpan.finish()
  try {
    await fetch("https://httpstat.us/500");
  } catch(e) {
    console.log("error calling httpstat.us", e);
  }
  sendDistributionMetric("randomValue", Math.random());
  return {
    statusCode: 200,
    body: JSON.stringify({ msg: "ok" }),
  };
};

export const hello = datadog(handler);
However, I still only saw a single http-client result in the service map. However, when I split it out into two files, it worked fine. So, yep, that did the trick for me. Thanks!
In case anyone else is looking for this, here's the result:
tracer.ts
import ddtrace from "dd-trace";
const tracer = ddtrace.init();
tracer.use("http", {
  splitByDomain: true,
});
export default tracer;
handler.ts
import tracer from "./tracer";
import { APIGatewayProxyHandler } from "aws-lambda";
import "source-map-support/register";
import fetch from "node-fetch";
import { datadog, sendDistributionMetric } from "datadog-lambda-js";

export const handler: APIGatewayProxyHandler = async (_event, _context) => {
  const jsonSpan = tracer.startSpan("call_json_placeholder")
  await fetch("https://jsonplaceholder.typicode.com/todos/1");
  jsonSpan.finish()
  try {
    await fetch("https://httpstat.us/500");
  } catch(e) {
    console.log("error calling httpstat.us", e);
  }
  sendDistributionMetric("randomValue", Math.random());
  return {
    statusCode: 200,
    body: JSON.stringify({ msg: "ok" }),
  };
};

export const hello = datadog(handler);
Related issues
 Cretezy
·
5Comments
Cretezy
·
5Comments
 nickpresta
·
5Comments
nickpresta
·
5Comments
 kappj
·
4Comments
kappj
·
4Comments
 stephenh
·
4Comments
stephenh
·
4Comments
 blugavere
·
3Comments
blugavere
·
3Comments
Most helpful comment
It's possible to split client HTTP requests by domain by using the
splitByDomainoption on the plugin.For example:
This won't break them down by path, but it will break them out by instance. You can then further split by path in search and in analytics, but not on the service page. The reasoning is that in general, if multiple paths represent multiple services, it means there is a proxy in front of the services that will forward the request, in which case there is actually multiple backend services sitting behind. By instrumenting the proxy and/or the backend services, you would then get the full picture.
Please let me know if that works for your use case!