Dd-trace-js: How to log payload in span
Not able to see payload in logs tab
Followed
- https://docs.datadoghq.com/tracing/guide/adding_metadata_to_spans/?tab=nodejs
- https://datadoghq.dev/dd-trace-js/interfaces/span.html#log
const tracer = require('dd-trace').init({
    logInjection: true,
    analytics: true,
    service: '/datadog_spans',
    hostname: 'localhost',
    port: '8126'
});

const span = tracer.startSpan('starting process for 35');
span.setTag('event', 'input_data_for_shopping_cart')
span.setTag('customer.id', 35)
span.addTags({ 'user.id': 35 })
span.log({ payload: {user_name : 'tom' , addesss : 'home'} })
span.finish();

There is nothing inside logs ,Its empty
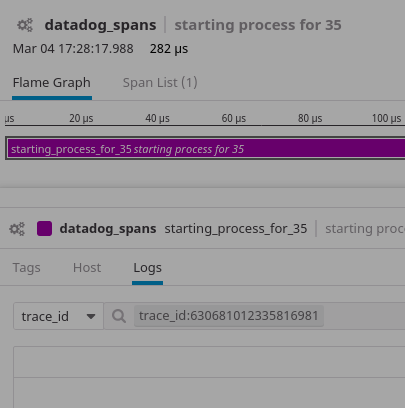
am i doing anything wrong ?
 pawarvijay
All 7 comments
span.log() is a no-op and is only available on the tracer to be OpenTracing compliant. Log injection works with your existing logger for logs sent to our Log Management product. Out of the box we support winston, bunyan and pino, but other loggers can also have the context injected manually easily.
 rochdev
on 4 Mar 2020
rochdev
on 4 Mar 2020
@rochdev
So if I use Tracer config + Winston config combination with common trace id and span id
Then will it show logs in logs tab ?
const tracer = require('dd-trace').init({
logInjection: true, // auto traceid/spanid generation
analytics: true,
service: '/datadog_spans',
hostname: 'localhost',
port: '8126'
});
//Pseudo code
Const logger = Winston.createLogger({...
const span = tracer.startSpan('starting process for 35');
span.setTag('event', 'input_data_for_shopping_cart')
span.setTag('customer.id', 35)
span.addTags({ 'user.id': 35 })
logger.log({
level: 'info',
message: 'Hello distributed log files!'
});
span.finish()
Assuming you forward your Winston logs to our Log Management product and have it enabled, then yes, you will see your logs in the Logs section and also in the Logs tab of the corresponding trace.
Basically, all the tracer does with the logInjection option is to add the trace ID and span ID to all log records. Then correlation happens in the backend once both the log records and the trace have been received by each corresponding product.
rochdev
on 5 Mar 2020
thanks, That was very quick reply
Cool I will try Tracer+Winston log thing.
Just one more thing if I use
opentracing totally instead of (tracer+Winston log)
then will span.log work ?
As you have mentioned on very first comment about opentracing span.log
pawarvijay
on 5 Mar 2020
OpenTracing is just a specification and has no implementation, meaning the opentracing-javascript library is completely no-op. Our tracer is an implementation of OpenTracing, but we did not implement span.log() as we correlate with existing logs instead.
rochdev
on 5 Mar 2020
Not able to connect dd_trace with winston
is there any other way ?
combine_dd_trace_winston code repo
const tracer = require('dd-trace').init({
logInjection: true,
analytics: true,
service: '/datadog_spans',
hostname: 'localhost',
port: '8126'
});
const { createLogger, format, transports } = require('winston');
const logger = createLogger({
level: 'info',
exitOnError: false,
format: format.json(),
transports: [
new transports.File({ filename: `${process.cwd()}/logs/datadog_spans.log` }),
],
});
let payload = 77
const span = tracer.startSpan('first span ' + payload);
span.setTag('event', 'input_data_for_shopping_cart')
span.setTag('customer.id', payload)
logger.log('info', { "name": payload, age: payload, address: payload }, { http: { status_code: 200, method: 'GET' } });
span.finish();
// Output --------
{"http":{"status_code":200,"method":"GET"},"level":"info","message":{"name":77,"age":77,"address":77}}
There is no trace_id & span_id
The automatic injection uses the span that is active on the current scope. Sorry about that I completely missed that this was missing in your example.
The easiest way to achieve this is to use tracer.trace instead of the OpenTracing API:
tracer.trace('first span ' + payload, () => {
  // here the span is active on the scope
  logger.log('info', { "name": payload, age: payload, address: payload }, { http: { status_code: 200, method: 'GET' } });
})
It's also possible to do it using the OpenTracing API but it's more difficult to manage and the ScopeManager PR never landed so it would not be OpenTracing compliant anyway.
It's also worth noting that in a real-world app using our auto-instrumentation, this is handled for you out of the box, meaning you don't need to manage the spans nor the scopes. You can assume within a request one will always be available and simply log normally.
rochdev
on 5 Mar 2020
Related issues
 shortcircuit3
·
6Comments
shortcircuit3
·
6Comments
 vecerek
·
3Comments
vecerek
·
3Comments
 stephenh
·
4Comments
stephenh
·
4Comments
 kumaraksi
·
5Comments
kumaraksi
·
5Comments
 zen0wu
·
5Comments
zen0wu
·
5Comments
Most helpful comment
The automatic injection uses the span that is active on the current scope. Sorry about that I completely missed that this was missing in your example.
The easiest way to achieve this is to use
tracer.traceinstead of the OpenTracing API:It's also possible to do it using the OpenTracing API but it's more difficult to manage and the
ScopeManagerPR never landed so it would not be OpenTracing compliant anyway.It's also worth noting that in a real-world app using our auto-instrumentation, this is handled for you out of the box, meaning you don't need to manage the spans nor the scopes. You can assume within a request one will always be available and simply log normally.