Dd-trace-js: Why does dd-trace add a new service with `-graphql` suffix on its name?
I am using dd-trace-js with apollo graphql library in my node application.
My dependency list looks like:
    "apollo-server-express": "^2.9.12",
    "apollo-server-testing": "^2.9.12",
    "express": "^4.17.1",
    "graphql": "^14.5.8",
    "graphql-request": "^1.8.2",
    "graphql-scalar-types": "^2.0.0",
    "graphql-subscriptions": "^1.1.0",
    "graphql-tag": "^2.10.1",
    "graphql-tools": "^4.0.6",
    "jest-sonar-reporter": "^2.0.0",
    "moment": "^2.24.0",
    "node-cache": "^5.0.2",
    "retry": "^0.12.0",
    "subscriptions-transport-ws": "^0.9.16",
    "uuid": "^3.3.3",
    "ws": "^7.2.0"
I am using this syntax to send trace span to datadog:
tracer.trace('request', () => this.myFunction(payload));
I am able to see the trace on datadog but there are two services appear on the dashboard under APM. One is my service name configured in init() method. The other one is my-service-graphql which includes all the traces in graphql framework. I think this is added by datadog js automatically. I wonder how I can combine these two into one service.
 zhaoyi0113
All 13 comments
The way our APM works, we compute stats out of the box by service, span name and resource. In order to get the correct list of resources, and the metrics by component, there must be one service name for each component. The main service name is only used by the root component, for example Express.
Said that, this model doesn't always work for everyone, and we allow you to change it if something else better fits your needs. For example, if you want to change the GraphQL integration to use the main service name, you can do it like this:
// right after tracer.init()
tracer.use('graphql', {
  service: 'my-service'
})
As mentioned above however, this will have an impact on the default aggregations. You can set up your own aggregations with App Analytics however to mitigate this if this is problematic for you.
It's also worth noting that every integration has its own service name, so you would have to do this for all supported modules if you want only a single service name by service.
 rochdev
on 16 Jan 2020
rochdev
on 16 Jan 2020
I have tried to add tracer.user('graphql') after init but it doesn't help. I still see a separate service name comes up.
Is there anything else I need to setup?
zhaoyi0113
on 17 Jan 2020
Is it possible that graphql is imported before the tracer is initialized? This is a common cause for auto-instrumentation not working properly. You can find more info in the setup docs.
If you can share your imports and initialization code I can take a look.
rochdev
on 20 Jan 2020
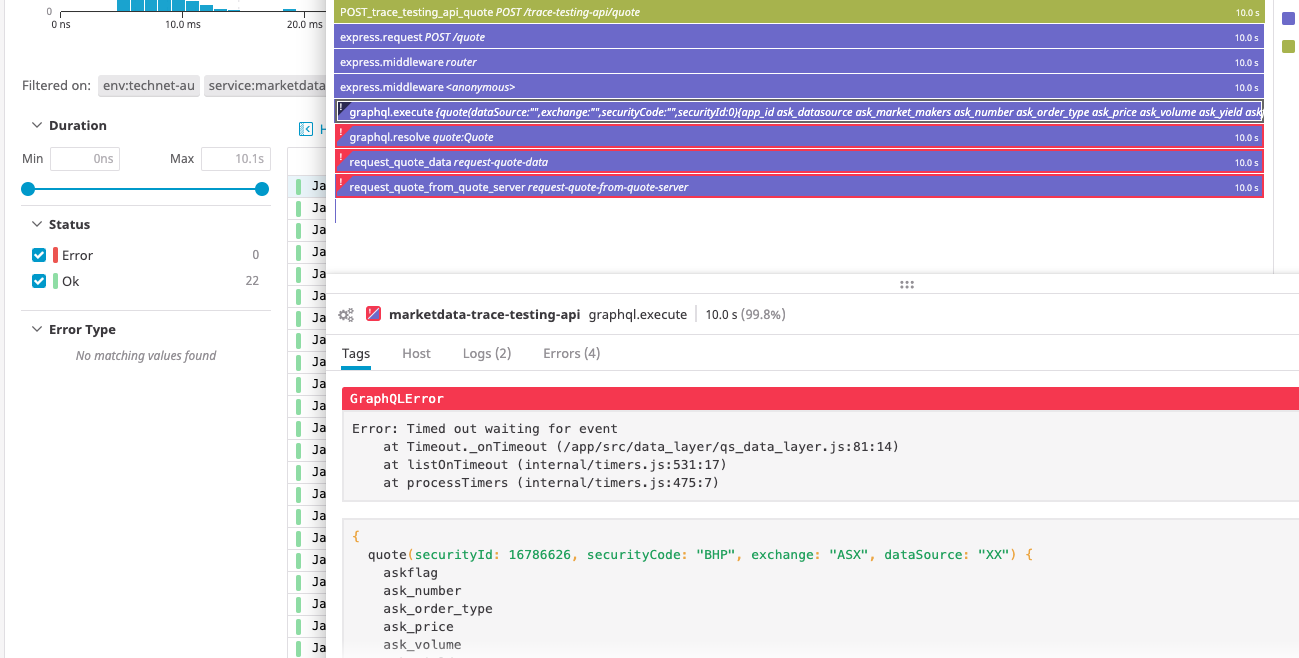
I have tried that and it works. The extra -graphql service is gone. But when I look at the trace data in datadog dash board as the screenshot. It doesn't report the error response as an error in trace. As you can see, there is an exception thrown to graphql framework and the response has an error field to address this issue. But the datadog trace doesn't consider it is an error response, probably because the http response code is always 200 from graphql server. Is there a way to tell trace server to look at the response payload for error response? Is this something can be done in this library or not?
zhaoyi0113
on 22 Jan 2020
Ah yes for this use case changing the service name is not the right approach.
So there are 2 options here:
1) Check for errors on the -graphql service directly. In general this would be our recommended approach since the Express request did not actually fail, although given how GraphQL works, I understand how this could be deemed undesirable.
2) If you want the entire request to be in error, which seems to be your request here, then you can manually set the tag when an error is detected. You can achieve this with a hook on the Express request. It might take a bit of work to grab the GraphQL error from there since all you have is the request/response objects, but it should be feasible.
In both cases, I would recommend to leave the -graphql suffix as this is how the platform expects the trace to look.
Let me know if you need any help to implement the second option. Since this is probably a common use case for GraphQL and other similar frameworks that use HTTP only as a transport, I'm also open to suggestions to make this work out of the box. Ideally it would be on the Express plugin, but I'm not sure it could be done reliably. Maybe something like a propagateErrors option on the GraphQL plugin?
rochdev
on 22 Jan 2020
Thanks for your quick response. Could you let me know what I should do for the option2? How can I manually set a tag when an error is detected? I am able to attach an error handler on grpahql framework and I just need to know what I can do to make the entire request as error.
zhaoyi0113
on 22 Jan 2020
After thinking about this a bit more, option 2 would actually be very difficult to implement since Apollo does a lot of effort to completely abstract the transport.
One thing also that is very different between Express+GraphQL and just Express, is that when Express is used alone to serve requests, in general HTTP is used for many things, not only transport. We could then say that Express is both the framework and the transport. For Apollo however, Apollo (so GraphQL) is the framework and Express (so HTTP) is the transport. This distinction is important because it means anything related to Express becomes irrelevant from a GraphQL perspective. For example, the path is always the same, the method is always the same (in most cases), and the status code is always the same. These are usually the information that help differentiate different types of request, but with GraphQL these become only relevant for network issues.
This means that the information for Express and for GraphQL are fundamentally different and should not be mixed together as they have different meanings. This is basically why they are currently classified as 2 different services, which is how we classify components with different sets of resources.
Said all that, I think option 1 is actually the best if we can make it work for you. Can you describe the use cases you are trying to accomplish that are not working for you? Maybe there is an easier solution that doesn't involve altering the trace structure.
rochdev
on 24 Jan 2020
Thanks for the detailed explanation. My use case is very simple. I just want to look at all the trace log from one service. It is very hard to read if the trace data spreads into multiple services. In my case, I see there are 4 services are created, -graphql, -tcp, -http-client and dns. People in my team is not happy to open each of these services to view the data.
Based on that, I am looking for a solution which provides all data into one place. And your solution about calling tracer.use works great except it doesn't give us the error data.
I am welcome any other solutions if combining services is very hard to do.
zhaoyi0113
on 24 Jan 2020
The only page that is limited to a single service is Services. If you go to Traces (renamed from Trace Search) or App Analytics, both allow you to do powerful searches and aggregations across you entire system. You can combine different services, or basically anything, in a single pane of glass. The same applies to dashboards. I would say that would be one solution, and probably the one I would recommend since it gives you the most flexibility. If you don't see these in the sidebar under APM, it's possible these features are not enabled in your account. If that's the case, you can contact support and they will get them enabled for you.
Another approach as we discussed before is to try to merge them in a single service, but the problem with that approach is that things like aggregations and errors are only computed for the root span of the service. That's why when you tried to set the same service name for both, you are still not getting the result you expect. The GraphQL span would have to be the root. Now of course you could disable the Express plugin completely so that GraphQL is the root, but then you would lose visibility on the transport, for example network failures.
In short, I would really recommend trying Traces and App Analytics and see if that works for your team. This is what will give you the most flexibility to slice and dice all data.
Please let me know if that works!
rochdev
on 24 Jan 2020
Thanks for your response. Probably I have to use the dashboard feature to sort this out. But I am not convenience about why separating traces into different component. Or at least, it should be easily configured. Because it is a very straightforward requirement that people like seeing all data in one spot for their services.
zhaoyi0113
on 29 Jan 2020
@zhaoyi0113 I agree, and we are actively working to make this more flexible.
rochdev
on 29 Jan 2020
Hi @rochdev
I have a similar problem.
When I am viewing my traces using dd-trace, it shows multiple services like:
- apiProject-mongodb
- apiProject-tcp
- apiProject-redis
- apiProject-http-client
- apiProject
Its consuming a lot of traces quota and hardly leaving any quota for my other projects. I want to keep only last 5th one (i.e. apiProject).
I tried this and it was successful to remove one service:
const tracer = require('dd-trace');
tracer.use('dns', {
  service: 'apiProject'
});
However, when I tried for multiple services I am not able to remove service name with additional suffix such as mongodb, tcp, redis, http-client.
Could you please help me with the same?
 shubhamUpadhyayInBlue
on 3 Apr 2020
shubhamUpadhyayInBlue
on 3 Apr 2020
@shubhamUpadhyayInBlue In general this is not desirable as it breaks the expected behavior of our platform. Is the only issue you are having the quotas? If that's the case, could you clarify what quota you are referring to? To my knowledge it should be fine to have hundreds or even thousands of services without any issues.
rochdev
on 6 Apr 2020
Related issues
 wcoc
·
3Comments
wcoc
·
3Comments
 kappj
·
4Comments
kappj
·
4Comments
 ngraef
·
5Comments
ngraef
·
5Comments
 blugavere
·
3Comments
blugavere
·
3Comments
 jessedobbelaere
·
4Comments
jessedobbelaere
·
4Comments
Most helpful comment
Thanks for your response. Probably I have to use the dashboard feature to sort this out. But I am not convenience about why separating traces into different component. Or at least, it should be easily configured. Because it is a very straightforward requirement that people like seeing all data in one spot for their services.