Dd-trace-js: Memory leak in latest version of dd-trace
Describe the bug
We're experiencing several crashes per day caused by out of memory exceptions. After debugging for a while we discovered that disabling tracing resolved the issue. We also tried disabling all plugins, but that still resulted in the out of memory exceptions.
Environment
- Operation system: Linux running in Docker on Google Cloud
- Node version: Latest LTS (v12.13.0)
- Tracer version: v0.16.1
- Agent version: v6.15.0
 devillexio
All 42 comments
Do you have runtime metrics enabled? In most cases, these metrics are able to pinpoint the issue fairly quickly. The most important charts to look at are: type of memory consumed, number of spans in heap, and async resources.
 rochdev
on 22 Nov 2019
rochdev
on 22 Nov 2019
Not at the moment, but thanks for the advice. I'll take a look at enabling it, and seeing what the metrics say.
devillexio
on 22 Nov 2019
I'm currently collecting debug tracing on Datadog's request. For reference, my support ticket with Datadog is 280106.
devillexio
on 25 Nov 2019
If followed up in the ticket so I can look into your account. Did you enable runtime metrics?
rochdev
on 25 Nov 2019
Not in the flare I sent earlier. I only had the agent debugging enabled as well as the tracer debugging.
I'll send another flare with both tracer debugging and runtime metrics enabled, once the application has run for 30 minutes.
devillexio
on 25 Nov 2019
Uploaded another flare with the runtime metrics enabled, as well as debug tracing.
devillexio
on 25 Nov 2019
I looked at the runtime metrics, and it seems there are a lot of promises that are kept in memory (you can see that with the runtime.node.async.resources.by.type metric). This in general would mean that there is an existing leak on promises since we do not use promises in the tracer. It's possible such a leak has gone unnoticed since a promise resource is very lightweight, but since we hold spans in memory for every async resource, we can make the problems several orders of magnitude worse.
Said that, I would say the first step here would be to try and figure out whether it's the tracer that is somehow holding the promise resources.
The following snippet added to the app with the tracer disabled or removed would keep a count of promises held in memory:
const promises = new Set()

setInterval(() => {
  console.log(`Promises in memory: ${promises.size}`) // use a metric instead if possible and convenient
}, 30000)

require('async_hooks').createHook({
  init: (asyncId, type) => {
    if (type === 'PROMISE) {
      promises.add(asyncId)
    }
  },
  destroy: () => {
    promises.delete(asyncId)
  }
}).enable()
If you see the count increasing while the tracer is disabled, this would indicate an existing leak. In that case, looking at a heap dump or heap profile would help finding where exactly it comes from. If the count does not increase, then the tracer is probably at fault. If that's the case, the sample applies for a heap dump or heap profile, but in this case it would be best to send it to support in the ticket so I can take a look.
rochdev
on 25 Nov 2019
Thank you @rochdev! Your debug code has been most helpful. I'm able to confirm that the promises keep increasing even with tracing disabled. I also discovered that the promises are related to some promise wrapped DB code.
I'm going to refactor some of the code and use the promise code native to the library (mysql2), instead of using Node's utils.promisfy.
devillexio
on 26 Nov 2019
Just a quick update.
There seems to be a couple of issues at play. It seems to be a combination of sql promise / connection pool issue, as well as a dialogflow session management issue.
I'm looking at another application of ours that's also affected to try and isolate at least one of the problems. I'll provide updates here if I find anything else.
devillexio
on 26 Nov 2019
Okay, I think I have managed to isolate a service that seems most affected by this issue. As a test, I briefly enabled tracing and saw a definite continued increase in memory usage on the service that is otherwise running stable:
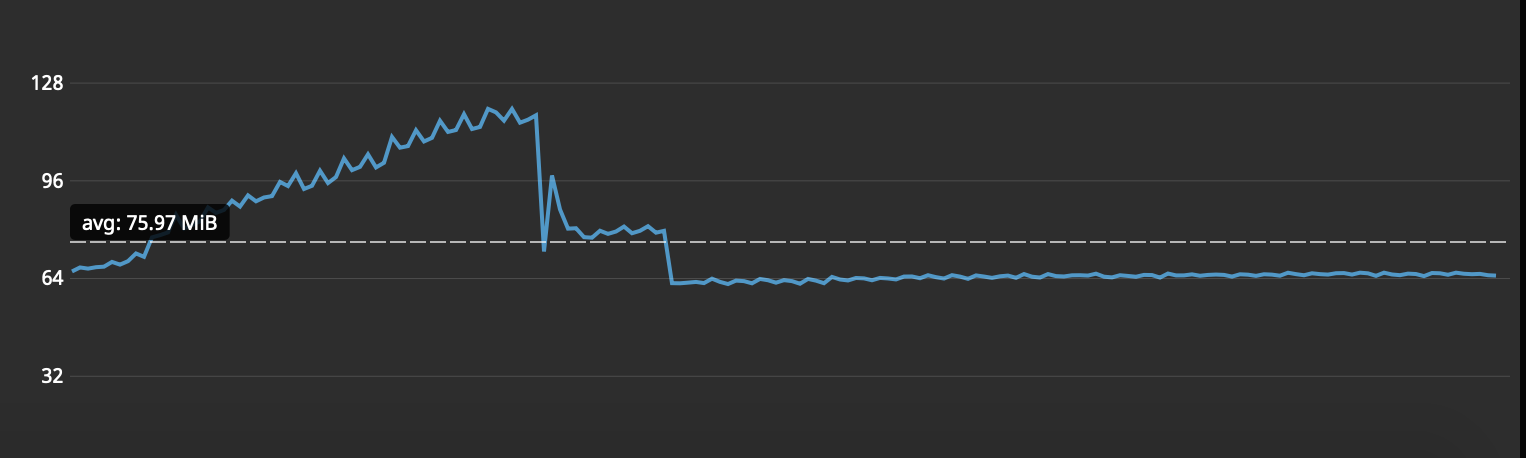
For reference, this service runs fairly stable at around 60 to 64 MB of memory on average, with tracing disabled.
I've booked a slot for tomorrow to gather another flare for this service. Is there anything you want me to enable for the flare? Aside from:
- DD_TRACE_ENABLED=true
- DD_TRACE_DEBUG=true
- DD_RUNTIME_METRICS_ENABLED=true
- DD_LOG_LEVEL=debug
Will 15 minutes be enough, before requesting the flare?
devillexio
on 27 Nov 2019
Uploaded another flare after running the application for 15 minutes:
Asking the agent to build the flare archive.
/tmp/datadog-agent-2019-11-28-14-09-14.zip is going to be uploaded to Datadog
Also kept an eye on the runtime metrics while it was running:
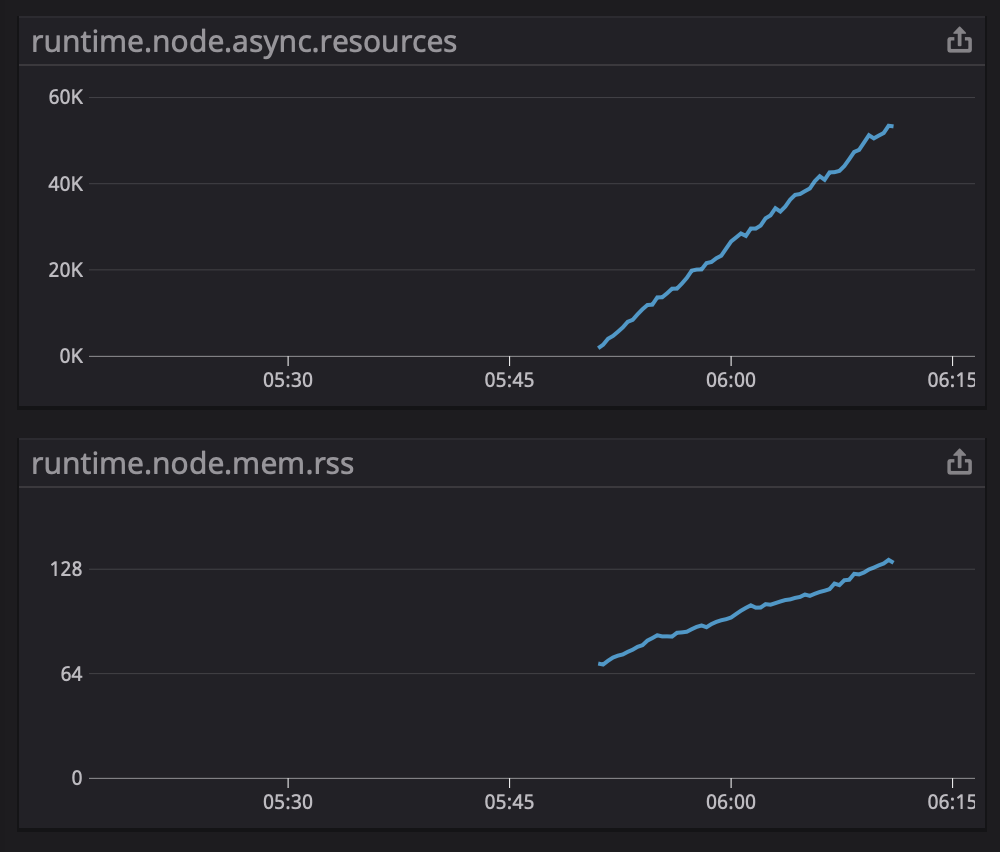
Unfortunately still not able to reproduce this locally. I do see the promise count increase, but as soon as I attach the node debugger locally and start recording, these are reclaimed by gc.
devillexio
on 28 Nov 2019
Flares will not really help for this kind of issue, since it's isolated to the app and unrelated to the agent.
The way the tracer is designed, we use async resources to propagate the context automatically. This is the only construct provided by Node to achieve this. If async resources are leaking, then any span associated with that resource will also be retained. From the above charts, it looks like this is the case. The existing leak would need to be fixed so that spans are not held in memory by the leaking resources.
Given the above, there are 2 options:
1) To find what is leaking promises and fix the issue. This will stop the spans from being held in memory forever.
2) If you cannot find the leak, it would be possible to wipe older spans on a timer. Of course this has many drawbacks but I understand that it can be difficult to find a memory leak. If you choose to go this route, let me know and I can explain how to achieve this.
rochdev
on 28 Nov 2019
as soon as I attach the node debugger locally and start recording, these are reclaimed by gc
Actually, this is interesting. If the GC is able to clean the promises, in theory it should mean that they are not leaking. The GC should trigger earlier when it sees that the memory is increasing a lot from the objects that are held.
Can you try to trigger the GC automatically on a timer and see if it helps? For example, every 15 minutes call global.gc(). To enable the garbage collector, you need to run your app with node --expose-gc. If that helps, then I'll have to look into why the GC would not automatically run.
One thing worth noting also is that attaching the Node debugger impacts how async_hooks works.
rochdev
on 28 Nov 2019
Okay cool. I'll give that a try!
Any idea why we don't see this happening in production with tracing disabled?
Also, I forgot to mention that we recently upgraded to the latest Node LTS (v12), in case that makes a difference.
devillexio
on 28 Nov 2019
Any idea why we don't see this happening in production with tracing disabled?
Just to make sure I didn't read this wrong, I thought you said above that you were able to confirm the promise resources still increasing in production with the tracer disabled? Or do you just mean that you don't see the increase in memory in production?
If that's the case, then it would be because promise resources are very lightweight C++ objects, so you would probably need hundreds of thousands of them in memory to even start noticing a leak. On the other hand, the spans that we attach to these resources hold much more memory, so you would start seeing the leak sooner.
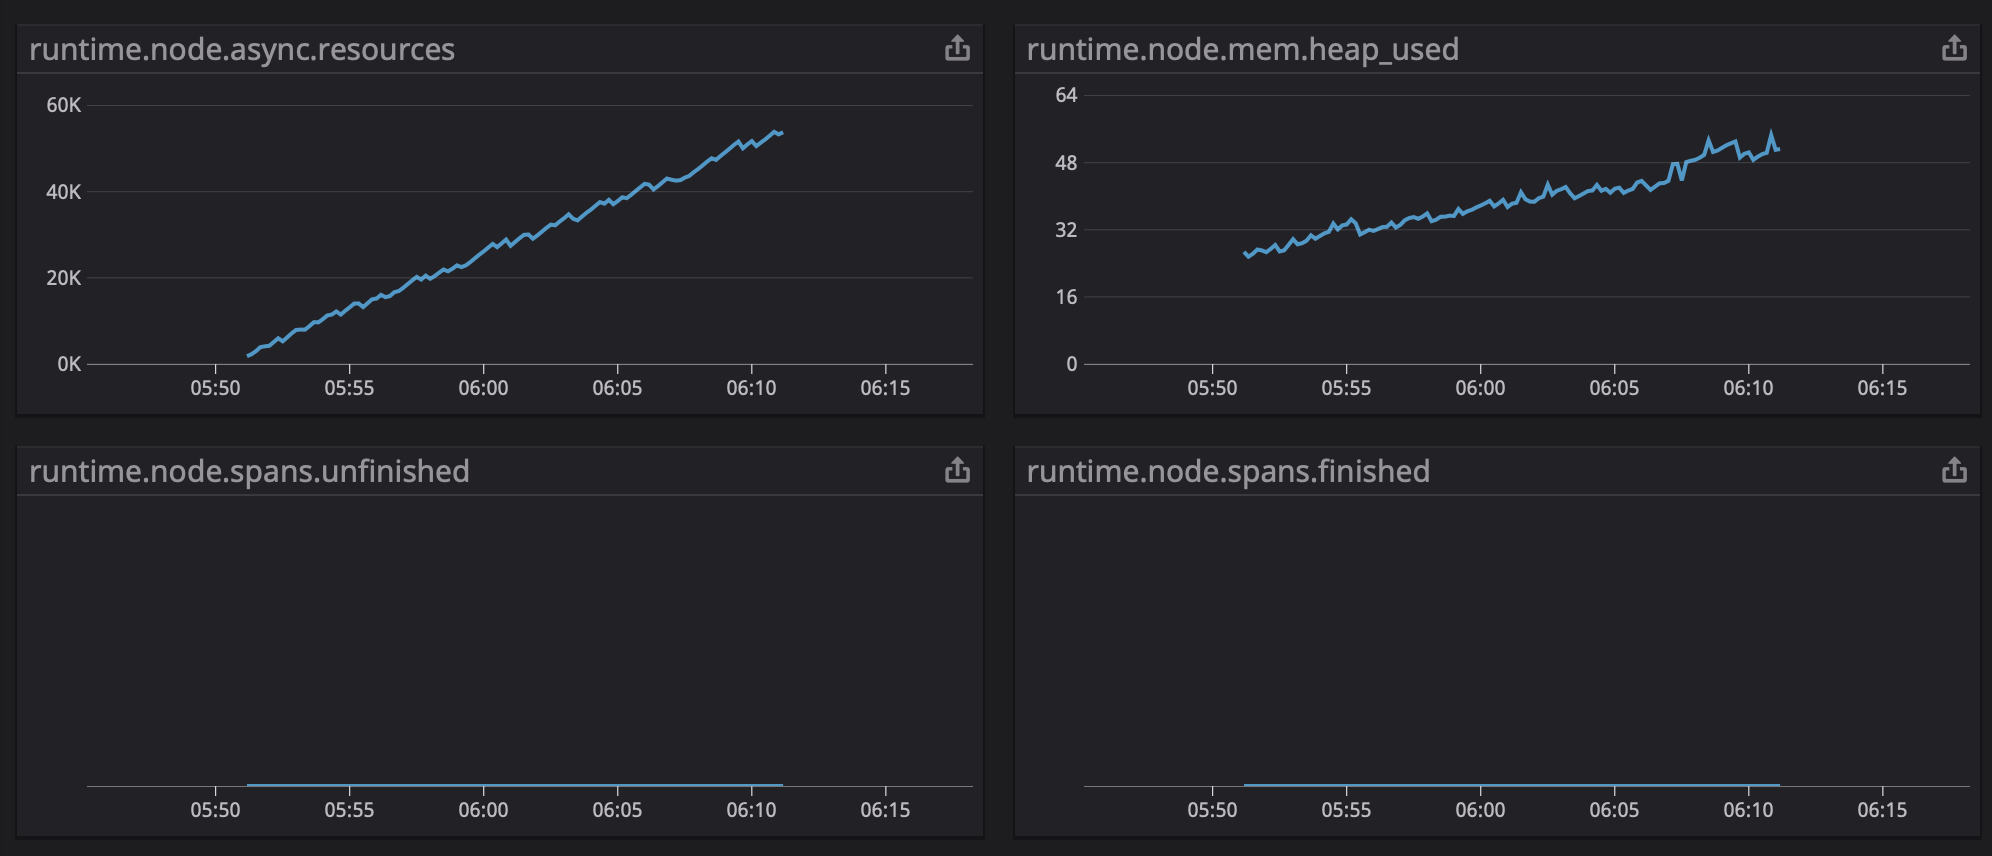
One additional thing I'd like to check to make sure that there isn't another issue at play, do you see a high count for runtime.node.spans.unfinished?
rochdev
on 28 Nov 2019
Sorry for the miscommunication. You are right. I meant that I only noticed the memory increase with tracing enabled.
I checked now and didn't see any high count for the spans, both finished or unfinished:
devillexio
on 28 Nov 2019
Here are the logs from running the test with the following parameters:
- Every second we call an endpoint with some data to process
- Every 5 seconds we print the promise count
- Every 20 seconds we call
global.gc()
Note that the "..." indicate omitted calls to the POST /events endpoint.
[2019-11-28 15:52:42] INFO : App is running under env 'development', listening on port 8080, and has an available heap size of 1048294416 bytes (~0.98GB)
[2019-11-28 15:52:42] INFO : Setting log level to "info"...
  <-- POST /events
  --> POST /events 200 49ms -
[2019-11-28 15:52:47] INFO : Promises in memory: 88
  <-- POST /events
  --> POST /events 200 10ms -
...
[2019-11-28 15:52:52] INFO : Promises in memory: 174
  <-- POST /events
  --> POST /events 200 11ms -
...
[2019-11-28 15:52:57] INFO : Promises in memory: 584
  <-- POST /events
  --> POST /events 200 10ms -
...
[2019-11-28 15:53:02] INFO : Calling GC...
[2019-11-28 15:53:02] INFO : Promises in memory: 10
  <-- POST /events
  --> POST /events 200 10ms -
...
[2019-11-28 15:53:07] INFO : Promises in memory: 338
  <-- POST /events
  --> POST /events 200 11ms -
...
[2019-11-28 15:53:12] INFO : Promises in memory: 748
  <-- POST /events
  --> POST /events 200 8ms -
...
[2019-11-28 15:53:17] INFO : Promises in memory: 1158
  <-- POST /events
  --> POST /events 200 11ms -
...
[2019-11-28 15:53:22] INFO : Calling GC...
[2019-11-28 15:53:22] INFO : Promises in memory: 10
From what I saw when I had the debugger attached, the 10 promises that always remain in memory are related to database connections in the connection pool (from mysql2).
Any idea if Node changes the way the GC works in the latest LTS? We have the following runtime flags that haven't changed in a couple of years (with the exception of us adding --unhandled-rejections recently with the upgrade to Node v12):
node --unhandled-rejections=strict --optimize_for_size --max_old_space_size=115 --gc_interval=100 .
Any idea if Node changes the way the GC works in the latest LTS?
Not that I know of. Is the issue not present on older versions?
When the promises are garbage collected, do you see the memory going down as well?
rochdev
on 28 Nov 2019
I did some further tests and found that if I give the container less memory, Node consistantly runs GC whenever the memory usage hits around 50-60%.
For the test, I once again used the following runtime parameters, with the only difference being the max_old_space_size value:
node \
--unhandled-rejections=strict \
--optimize_for_size \
--max_old_space_size=45 \
--gc_interval=100.
I was doing about a 100 requests per second and the logs end at around 10k requests:
[2019-11-28 17:40:27] INFO : App is running under env 'development', listening on port 8080, and has an available heap size of 35731440 bytes (~0.03GB)
[2019-11-28 17:40:27] INFO : Setting log level to "info"...
[2019-11-28 17:40:36] INFO : Promises in memory: 2305
[2019-11-28 17:40:36] INFO : Memory used: 18 / 34 (52.23%%)
[2019-11-28 17:40:46] INFO : Promises in memory: 2204
[2019-11-28 17:40:46] INFO : Memory used: 17 / 34 (49.93%%)
[2019-11-28 17:40:56] INFO : Promises in memory: 1073
[2019-11-28 17:40:57] INFO : Memory used: 16 / 34 (47.83%%)
[2019-11-28 17:41:06] INFO : Promises in memory: 183
[2019-11-28 17:41:06] INFO : Memory used: 15 / 34 (45.41%%)
[2019-11-28 17:41:16] INFO : Promises in memory: 1772
[2019-11-28 17:41:16] INFO : Memory used: 18 / 34 (51.46%%)
[2019-11-28 17:41:26] INFO : Promises in memory: 473
[2019-11-28 17:41:26] INFO : Memory used: 16 / 34 (47.81%%)
[2019-11-28 17:41:36] INFO : Promises in memory: 1859
[2019-11-28 17:41:36] INFO : Memory used: 18 / 34 (52.03%%)
[2019-11-28 17:41:46] INFO : Promises in memory: 1073
[2019-11-28 17:41:46] INFO : Memory used: 17 / 34 (48.84%%)
[2019-11-28 17:41:56] INFO : Promises in memory: 1870
[2019-11-28 17:41:56] INFO : Memory used: 18 / 34 (52.31%%)
[2019-11-28 17:42:06] INFO : Promises in memory: 548
[2019-11-28 17:42:06] INFO : Memory used: 16 / 34 (47.17%%)
[2019-11-28 17:42:16] INFO : Promises in memory: 1863
[2019-11-28 17:42:16] INFO : Memory used: 18 / 34 (52.57%%)
Is there perhaps anything the tracer does that would prevent the GC from running or reclaiming the promises?
devillexio
on 28 Nov 2019
Not that I know of. Is the issue not present on older versions?
I tested and there were no real differences between Node v10 (previous LTS) and Node v12 (current LTS). There's slightly more memory available in the latter, but the rest of the behavior remains consistent.
devillexio
on 28 Nov 2019
Is there perhaps anything the tracer does that would prevent the GC from running or reclaiming the promises?
In general, Node GC is very lazy when there is enough memory available. I've seen environments that reach almost 100,000 spans in memory before the GC removes them.
What could be happening is that the GC sees a lot of promises, but they are very lightweight so it decides to skip them. Then the tracer keeps the span based on the ID on the resource and not the resource itself, so there is no relationship, and this is memory the GC cannot reclaim. Once the available memory gets low enough, major GC is triggered which cleans up everything, including the promise resources and the spans.
One thing to note however, is that we also remove the spans from memory when the promise is resolved/rejected, so it probably means there are a lot of promises that never get resolved or rejected in the app.
rochdev
on 28 Nov 2019
One thing to note however, is that we also remove the spans from memory when the promise is resolved/rejected, so it probably means there are a lot of promises that never get resolved or rejected in the app.
Hmm. Would that not mean that they would not be eligible for reclamation by the GC then? I know you said the node debugger affects the way async works, but the only promises that remain around are the ones for the mysql2 connection pool, which is exactly 10 in total.
devillexio
on 28 Nov 2019
The way promises work in Node, if it's never resolved/rejected, but there is nothing in code that references either the promise, or the resolve or reject functions, it's eligible for GC since it can never be resolved nor rejected. In that case, there is no way for the tracer to know it should remove the span associated with the promise.
rochdev
on 28 Nov 2019
That's a good point to note. There aren't any obvious cases like that for the application code, but it may be a shared dependency.
I'll do some more testing to see if I can narrow down the debugging surface area.
By the way, did anything else stand out from the flare I sent earlier today?
devillexio
on 28 Nov 2019
By the way, did anything else stand out from the flare I sent earlier today?
Not really. In general flares are mostly useful to troubleshoot issues with the agent, backend, or when we are not sure where the issue comes from. In this case the issue is clearly within the app and the interaction with the tracer, so flares wouldn't really provide more information.
rochdev
on 28 Nov 2019
What could be happening is that the GC sees a lot of promises, but they are very lightweight so it decides to skip them. Then the tracer keeps the span based on the ID on the resource and not the resource itself, so there is no relationship, and this is memory the GC cannot reclaim. Once the available memory gets low enough, major GC is triggered which cleans up everything, including the promise resources and the spans.
One thing to note, however, is that we also remove the spans from memory when the promise is resolved/rejected, so it probably means there are a lot of promises that never get resolved or rejected in the app.
This got me thinking so I added to the async_hooks code snippet you shared earlier.
I basically added the promiseResolve function to track existing vs resolved promises. This helped me confirm that in this particular app, all promises are resolved (except the original 10 for the DB).
Here is the output of my tests with node available memory set to 45MB:
  [2019-11-29 05:00:42] INFO : Promises:
      created: 66966
      current: 10
      unresolved: 0
  [2019-11-29 05:00:42] INFO : Memory (MB):
      used: 15
      total: 32
      usedPercentage: "46.78%"
Here is the code that generated the above:
logger.info('Setting log level to "info"...')
  logger.level = 'info'

  const memoryInMb = raw => (raw / 1024 / 1024).toFixed(2)
  const totalMb = memoryInMb(totalHeapSize)

  const displayMemoryUsage = () => {
    const usedHeapSize = v8.getHeapStatistics().used_heap_size

    const usedMb = memoryInMb(usedHeapSize)
    const usedPercentage = (usedHeapSize / totalHeapSize).toLocaleString(undefined, { style: 'percent', minimumFractionDigits: 2 })

    logger.info({ used: Math.round(usedMb), total: Math.round(totalMb), usedPercentage }, 'Memory (MB):')
  }

  let created = 0
  const current = new Set()
  const unresolved = new Set()

  setInterval(() => {
    logger.info({ created, current: current.size, unresolved: unresolved.size }, 'Promises:')
    displayMemoryUsage()
  }, 5000)

  require('async_hooks').createHook({
    init: (asyncId, type) => {
      if (type === 'PROMISE') {
        current.add(asyncId)
        unresolved.add(asyncId)
        created++
      }
    },
    destroy: (asyncId) => {
      current.delete(asyncId)
    },
    promiseResolve: (asyncId) => {
      unresolved.delete(asyncId)
    }
  }).enable()
I'll deploy something similar to our staging environment and see if any promise leak shows up there.
devillexio
on 29 Nov 2019
Definitely make sure to check the metric in Datadog as well to make sure it matches what you see in your logs.
rochdev
on 29 Nov 2019
Definitely make sure to check the metric in Datadog as well to make sure it matches what you see in your logs.
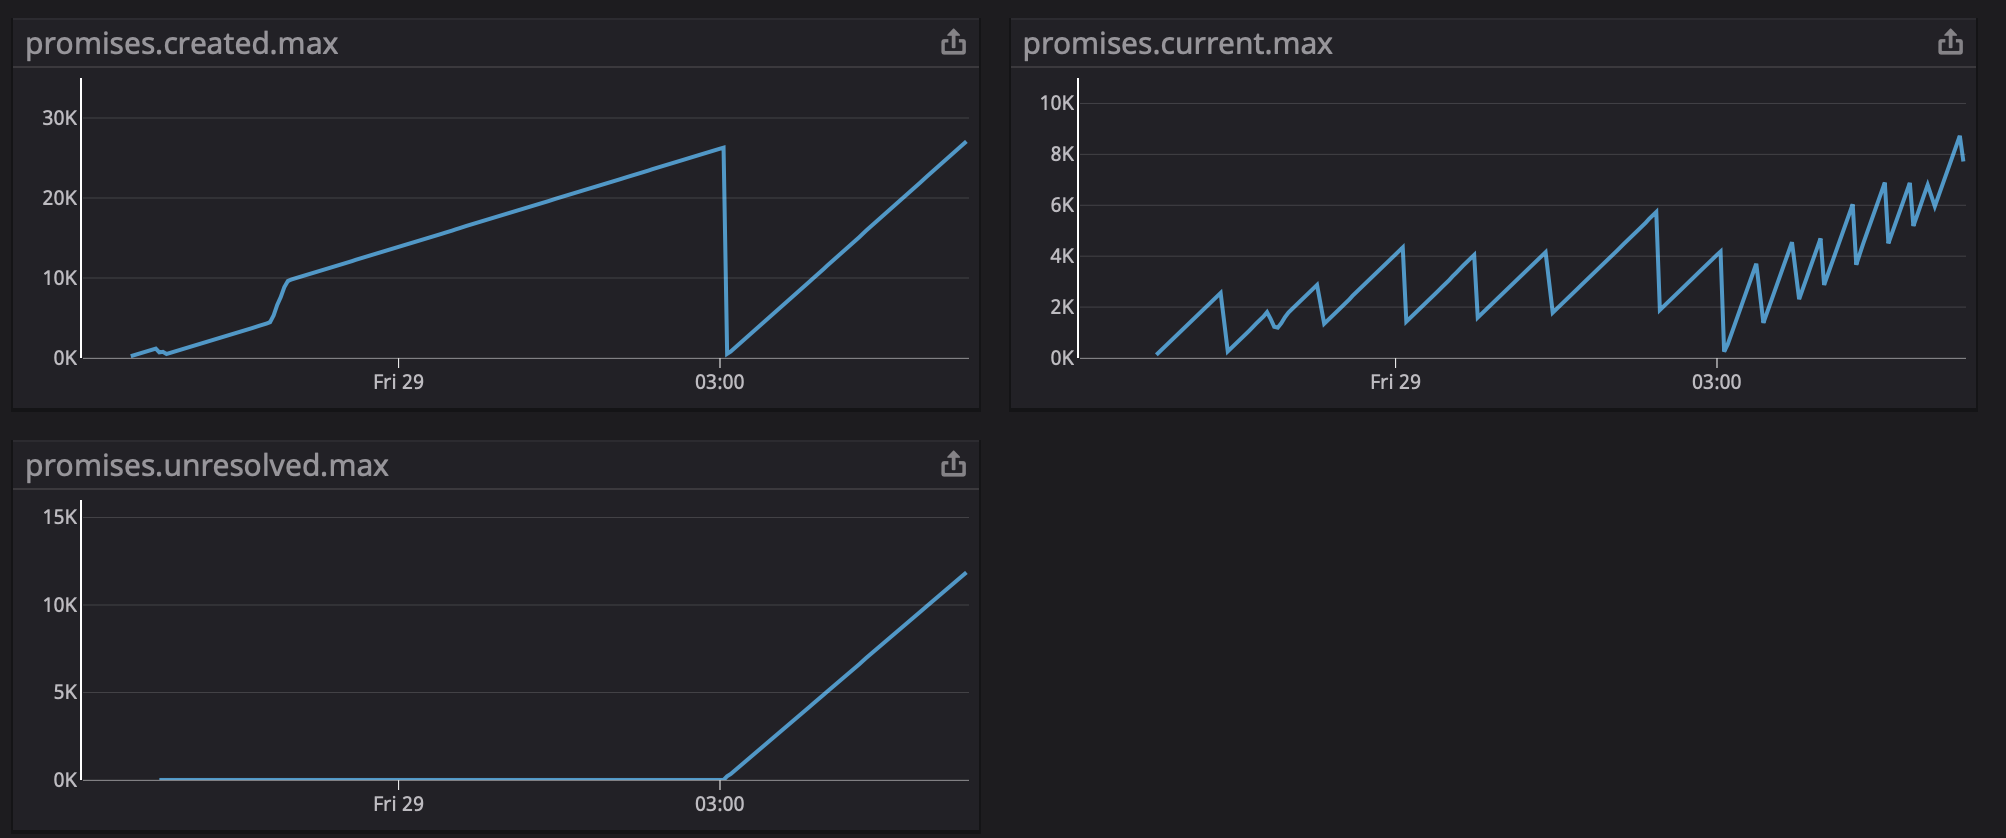
After running the tests locally I added the code to our boilerplate project that we use as a starting point for our backend services.
From the start of the chart we had DD_TRACE_ENABLED=false, and from 03:00 we redeployed with DD_TRACE_ENABLED=true. Before the deploy, the unresolved capped at "2", with it continually growing after enabling tracing.
No artificial load was created on the application. It's basically the k8s health check hitting the GET /.
devillexio
on 29 Nov 2019
Is the boilerplate code public? Reproducing this locally would help me a lot to find what could be holding promises.
rochdev
on 29 Nov 2019
Unfortunately not, but I can attach it to the support ticket by replying to the email thread if that can work?
devillexio
on 29 Nov 2019
That works. As soon as it's on the ticket I'll look into it.
rochdev
on 29 Nov 2019
Thank you. Email sent.
devillexio
on 29 Nov 2019
Can you try with tracer.init({ trackAsyncScope: false })?
rochdev
on 29 Nov 2019
Can you try with
tracer.init({ trackAsyncScope: false })?
That definitely made a difference. The unresolved now once again stays at 2, with tracing enabled and trackAsyncScope: false:

It's only run for 30 minutes, but it looks really promising.
devillexio
on 29 Nov 2019
It looks like the issue could be coming from our scope tracking for non-native promises when using async/await. If you do not use non-native promises, it should be safe to keep the option off. In any case, the worst that could happen without the option is a disconnected trace, which is definitely better than a memory leak.
I'll continue to investigate with the boilerplate, but this is a good starting point to narrow down the issue.
rochdev
on 29 Nov 2019
Awesome! Thanks for being so supportive and responsive! We almost exclusively use async/await where we can, so I'm happy with the trade-off.
Please let me know if you want me to try anything else. I'm happy to help! 😄
devillexio
on 29 Nov 2019
I fixed the issue where the promise created by the await call in the scope manager would never be resolved in #772.
Can you try with 0.17.0-beta.10 and re-enable trackAsyncScope to see if the original issue with memory is resolved?
rochdev
on 2 Dec 2019
Great, thanks! I'll try it today and report back.
devillexio
on 2 Dec 2019
Can you try with 0.17.0-beta.10 and re-enable
trackAsyncScopeto see if the original issue with memory is resolved?
I can confirm that the fix works as expected. In the case of the boilerplate, the _unresolved_ promise count remains at 2, even with tracing and track async scope enabled.
devillexio
on 2 Dec 2019
Perfect! The fix will be in the next release which will be published this week. Thanks a lot for the very thorough details provided, it helped me a lot to pinpoint the exact issue.
rochdev
on 2 Dec 2019
Just released 0.16.2 with the fix. Please let me know if that fixes the memory increase.
rochdev
on 3 Dec 2019
We've been running this fix on staging for about 6 hours, and I can confirm the memory doesn't increase. Thanks again @rochdev! 🙌
devillexio
on 4 Dec 2019
Related issues
 nickpresta
·
5Comments
nickpresta
·
5Comments
 icirellik
·
5Comments
icirellik
·
5Comments
 edrich-xendit
·
3Comments
edrich-xendit
·
3Comments
 Cretezy
·
5Comments
Cretezy
·
5Comments
 bojand
·
4Comments
bojand
·
4Comments