We've deployed 0.6.1 across our production service fleets. Out of over a dozen services, we're seeing memory leaks with 2 services. All services are more or less node.js/express based with the following configuration for dd-trace:
import datadogTracer from 'dd-trace';

datadogTracer.init(config);
datadogTracer.use('express', {
    headers: [
      'x-datadog-trace-id',
      'x-datadog-parent-id',
      'x-datadog-sampling-priority',
    ],
  });
datadogTracer.use('http', { splitByDomain: true });
datadogTracer.use('redis', {});
datadogTracer.use('graphql', { service });
datadogTracer.use('pg', {});
Are you aware of any outstanding memory leak issues? I've taken two separate heapdumps with a delta containing the leak, showing a lot of DatadogSpans being retained. I can provide the heapdumps to help troubleshoot.
 terryma
All 82 comments
Were you getting the same memory leak before upgrading to 0.6.1? Which version was used before if any? Do you do custom tracing at all or only rely on the out of the box integrations?
Heap dumps would definitely be useful. I would recommend to open a support ticket and submit the heap dumps there. Also, can you try updating to 0.7.2 to see if it fixes the issue? There is also more logging in that version to detect spans that are not properly finished.
About outstanding memory leaks, the only one I'm aware of is a bug in Node that affects HTTP clients with keep-alive when used with async_hooks, which we use. This however would cause context objects to be kept in memory and not spans. I am not aware of any bug where spans would leak.
 rochdev
on 7 Jan 2019
rochdev
on 7 Jan 2019
No custom tracing, just out of the box integration for now.
About outstanding memory leaks, the only one I'm aware of is a bug in Node that affects HTTP clients with keep-alive when used with async_hooks, which we use. This however would cause context objects to be kept in memory and not spans.
This actually might be the issue. I just took a look at the heapdump diffs again, and it's definitely a list of Context objects getting retained. Context eventually has a reference to all the spans and I missed this initially

Any lights you can shed on this known issue? Any mitigations?
terryma
on 7 Jan 2019
Is this the issue you're referencing? https://github.com/nodejs/node/issues/19859? Curious to why this only affects 2 of our services, and why it's not more widespread.
terryma
on 7 Jan 2019
Yes, that's the issue I was referencing. It depends on quite a few factors to trigger the leak, so it's possible that only a few services are affected. Of course this is only a theory at this point. A fix was released for this specific bug in Node 8.13.0 and 10.14.2. If you are still getting the same behavior with these versions, it means your issue is a different bug that would probably be in the tracer.
Can you try to redeploy with an updated version of Node?
rochdev
on 7 Jan 2019
Thanks! I updated one of the affected services with node 10.15.0 and so far it looks like the same issue is still happening.
It depends on quite a few factors to trigger the leak
Could you elaborate on that if you have some info? I can try to generate a new heapdump diff with this new version of node, but I'm expecting to see similar behavior.
terryma
on 9 Jan 2019
It depends on quite a few factors to trigger the leak
I meant to trigger the leak from the Node bug, but since you updated it means this is not the issue.
Were you using a version of dd-trace that didn't leak before in these services? If so, what was the version?
If you could share the actual heap dump it would be very helpful. You can send it to me on our public Slack, but I would suggest opening a support ticket as well (you can give me the ticket number on Slack too).
One thing that could be interesting to try to narrow down the issue would be disabling some of the plugins to see if it makes a difference.
rochdev
on 9 Jan 2019
I found the same issue.
In my case, I updated dd-trace from 0.6.2 to 0.7.2 and memory leak happen.
[email protected]
[email protected]
[email protected]
 tomonari-t
on 18 Jan 2019
tomonari-t
on 18 Jan 2019
@tomonari-t Are you saying you didn't have any issue before 0.7.2? Most reports so far seem to indicate the issue was present in at least 0.6.0.
rochdev
on 18 Jan 2019
@rochdev Yes. When I used [email protected], memory leak didn't happen.
tomonari-t
on 19 Jan 2019
@tomonari-t Can you try disabling plugins for promise libraries? So far it seems the leak is caused by the scope manager, which could have an impact on these plugins specifically if that's the case. Since these plugins were added in 0.7.0, it would explain why you are just now getting the issue. The plugins that would have to be disabled are bluebird, q and when.
rochdev
on 21 Jan 2019
@terryma @tomonari-t Can you try with 0.9.0? We have rewritten some core components that were prone to memory leaks.
rochdev
on 22 Feb 2019
Just want to add that we're also seeing clear memory leaks with 0.8.0. Will try with 0.9.0 this week and report back.
 Chris911
on 26 Feb 2019
Chris911
on 26 Feb 2019
Unfortunately we're still seeing memory issues in one of our applications with 0.9.3.
I'll try again with some of the plugins disabled later this week.
Chris911
on 26 Feb 2019
In general the most probable causes of leaks are:
- Scope manager. This should no longer be an issue since 0.9.0 with our new much simpler scope manager.
- Node memory leak in
async_hooksin part versions. If you are using any version lower than 8.15.0 or 10.15.0 it is recommended to update as it may fix the issue. - In one of our plugins. Trying to enable/disable them as you're doing is a good way to pinpoint which one.
@Chris911 Are you doing manual instrumentation?
rochdev
on 26 Feb 2019
One other thing to keep in mind is some plugins are required to avoid memory leaks. If you are using tracer.init({ plugins: false }) it's possible these don't get enabled. In general unless you have issues it's recommended to not use this configuration option.
rochdev
on 26 Feb 2019
We do use plugins: false and then enable specific plugins based on configuration. I shared most of our setup with your support team (support ticket ID 204548). I'll report back if I'm able to pinpoint which plugin is causing the issue but it's not easy to debug because we can't reproduce on our dev environments.
Chris911
on 26 Feb 2019
@Chris911 Can you try without tracer.init({ plugins: false })?
Another option would be to enable these plugins if any of the corresponding module is used either directly or transitively: bluebird, q, when, generic-pool. Using these modules without the corresponding plugin may cause a memory leak, so worth a try.
rochdev
on 26 Feb 2019
@Chris911 Also, we are thinking of deprecating the plugins option as in general it should never be needed and may cause many issues. What is your use case for using it?
rochdev
on 26 Feb 2019
When we did our initial testing of the APM a few weeks back we were getting memory leaks on our dev environments. They went away when we disabled all plugins and only enable 1-2. I'll try with plugins: true sometime this week.
Also to answer your previous question we're not doing any custom instrumentation.
Chris911
on 26 Feb 2019
We enabled [email protected] with a deployment last night on our cluster serving web traffic (it's an express 4 app) running node v10.15.1 and saw the memory utilization gradually increase over night until we did another deployment/servers restarted this morning.

 freewil
on 28 Feb 2019
freewil
on 28 Feb 2019
@freewil Which version were you using before? Also, which supported modules are you using? Could you provide a snippet of the tracer initialization?
rochdev
on 28 Feb 2019
We weren't using dd-trace before.
Non-native modules in use:
- express
- mongodb-core
- redis
const ddTrace = require("dd-trace")
// https://datadog.github.io/dd-trace-js/#tracer-settings
ddTrace.init({
enabled: true,
debug: false,
service: 'REDACTED',
hostname: 'REDACTED',
port: 'REDACTED',
env: 'REDACTED'
})
I will try to add an option for tomorrow's release so you can disable individual plugins. This will allow you to try without individual plugins to try and pinpoint the issue. I'll keep you posted when it's available.
rochdev
on 28 Feb 2019
Cool, thanks!
freewil
on 28 Feb 2019
@rochdev I work with @terryma, I upgraded the services showing the memory leak to dd-trace 0.9.3 and the memory leak is gone, thanks for your help!
 manuelconvoy
on 4 Mar 2019
manuelconvoy
on 4 Mar 2019
@rochdev
I will try to add an option for tomorrow's release so you can disable individual plugins.
Any ETA on this? Was this an option that was removed in a recent release? It appears you can/could do this in the code examples above with tracer.init({ plugins: false }) ?
freewil
on 5 Mar 2019
@freewil The release that was planned last Friday was pushed back and I don't have an ETA right away, but I did release a beta as 0.10.0-beta.0 that contains this functionality by doing tracer.use('express', false) for example.
The reason I prefer to not recommend going the tracer.init({ plugins: false }) route is that it can actually cause more harm than good since it will remove plugins that are important for the health of the tracer.
I would say to try 0.10.0-beta.0 and try disabling plugins one by one to try and pinpoint the problem. Then it will be much easier to try and find the issue.
rochdev
on 5 Mar 2019
Ok - thanks for the update and info!
freewil
on 5 Mar 2019
I've been trying to narrow down the cause of the memory leak by selectively enabling plugins. Here is the timeline of actions taken:
1) After experiencing memory leak on 0.9.2, upgraded to 0.10.0-beta.0. Changed tracer initialization to the following:
const ddTrace = require("dd-trace")
// disable plugins to isolate memory leaks
// see: https://github.com/DataDog/dd-trace-js/blob/64601d82ebb12da02c600aa4bee1bfd492af9b8e/docs/index.d.ts#L261-L288
ddTrace.use("bluebird", false)
ddTrace.use("express", false)
ddTrace.use("mongodb-core", false)
ddTrace.use("q", false)
ddTrace.use("redis", false)
return ddTrace.init(config)
2) After still experiencing memory leak after 1), disabled all the plugins (most of these node modules aren't even being used):
// disable plugins to isolate memory leaks
// see: https://github.com/DataDog/dd-trace-js/blob/64601d82ebb12da02c600aa4bee1bfd492af9b8e/docs/index.d.ts#L261-L288
ddTrace.use("amqp10", false)
ddTrace.use("amqplib", false)
ddTrace.use("bluebird", false)
ddTrace.use("bunyan", false)
ddTrace.use("dns", false)
ddTrace.use("elasticsearch", false)
ddTrace.use("express", false)
ddTrace.use("generic-pool", false)
ddTrace.use("graphql", false)
ddTrace.use("hapi", false)
ddTrace.use("http", false)
ddTrace.use("ioredis", false)
ddTrace.use("koa", false)
ddTrace.use("memcached", false)
ddTrace.use("mongodb-core", false)
ddTrace.use("mysql", false)
ddTrace.use("mysql2", false)
ddTrace.use("net", false)
ddTrace.use("pg", false)
ddTrace.use("pino", false)
ddTrace.use("q", false)
ddTrace.use("redis", false)
ddTrace.use("restify", false)
ddTrace.use("router", false)
ddTrace.use("when", false)
ddTrace.use("winston", false)
3) After memory leak went away after 2), enabled net and http:
ddTrace.use("http", true)
ddTrace.use("net", true)
4) After experiencing memory leak again after 3, disabled http plugin:
ddTrace.use("http", false)
5) Memory leak went away after 4), - tracer is no longer logging anything with just net enabled.
freewil
on 11 Mar 2019
@freewil Can you try with express enabled and http disabled? This will tell me if the leak would be in the server component or the client component since the http plugin uses the same code as express for servers.
rochdev
on 11 Mar 2019
@rochdev After also running 0.9.2 and experiencing the memory leak on some separate processes that don't run a http server, I have to assume it's the client.
I'll try out your suggestion though to confirm.
freewil
on 11 Mar 2019
On my end we believe the issue might be related to the RabbitMQ (amqplib) integration. We noticed the memory issues occurred mostly when we have long running queue tasks running. A couple weeks ago we manually triggered a long and data heavy background task via RabbitMQ while the APM was enabled and quickly saw the memory raise (does not happen without the APM). This task is data heavy and makes a lot of read/writes to the DB. My guess is that there's a context scope for the RabbitMQ messages that lives for the entirety of the task and it just piles the traces. Because we do a lot of DB queries which are also monitored a lot of memory is used to store that information. It's not really a memory leak but just a result of storing objects (traces) but a long task (20-30 minutes). We don't have the same issue with New Relic's APM but I don't think they have the same support RabbitMQ monitoring.
Chris911
on 11 Mar 2019
@Chris911 What you are describing would have been happening in previous versions, but should no longer be the case with the new scope manager since the trace of the message would be sent individually before the DB calls. What does the trace look like? Is the root span very long or very very short?
rochdev
on 11 Mar 2019
We are also experiencing a memory leak after implementing dd-trace 0.7.2 a few months ago. The leak was very slow so we just now noticed it. Upgrading to 0.10.1 to see if it improves.
 nkblue
on 18 Mar 2019
nkblue
on 18 Mar 2019
We are also experiencing this problem:
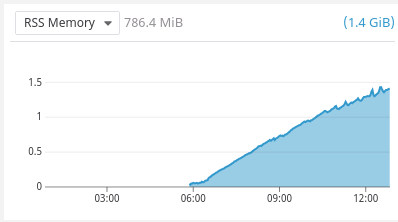
All of our dd-trace enabled pods will consume more and more memory until they starve the nodes and are restarted, and then they restart at 0mb and again slowly crawl their way up to GB and GB of leakage.
I took a snapshot of a pod that was around 190mb at the time:
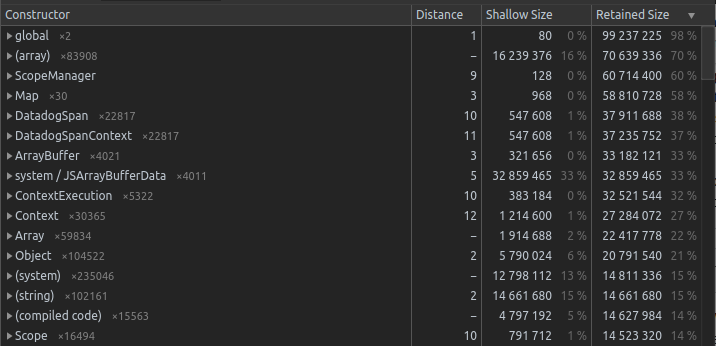
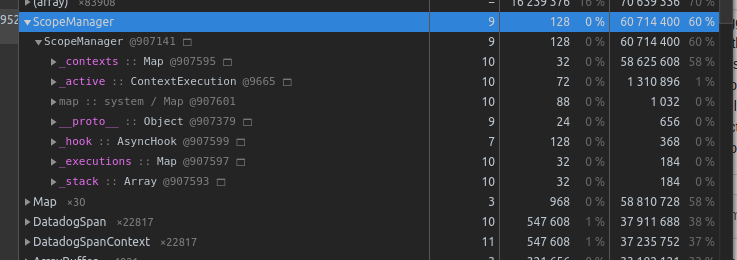
Looks like the datadog scope manager is taking up 60% of the memory here.
Here's our full instrumentation:
const packageJson = require('../../package.json');

/* eslint-disable */
export const ddTrace = require('dd-trace').init();

ddTrace.use('http', {
    service: packageJson.name,
});

ddTrace.use('https', {
    service: packageJson.name,
});
 jacob-hd
on 19 Mar 2019
jacob-hd
on 19 Mar 2019
@jacob-hd This was a known issue with the old scope manager that was overly complex and prone to memory leaks. The scope manager has since been rewritten from scratch in recent versions. Can you try with 0.10.2 and post a new snapshot if the problem still exists?
rochdev
on 19 Mar 2019
@rochdev We updated to 0.10.2 and the leak persists.
Will post a new snapshot later today or tomorrow.
jacob-hd
on 19 Mar 2019
@rochdev Here is the snapshot for 0.10.2:
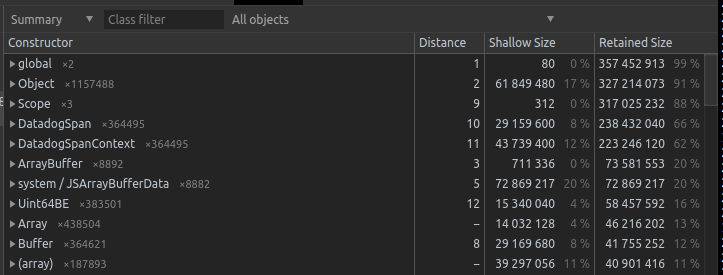
This is a simple, stateless service consuming hundreds of MB of RAM from the datadog memory leak.
The only usage other than the registering of dd-trace is this span tagger:
const span = ddTrace.scope().active();
if (span) {
    span.setTag('request url', url);
    span.setTag('request body', JSON.stringify(body));
}
^ this is directly from the docs though, should be good right? That's not causing the leak? (I could try removing these lines and see if it persists...)
jacob-hd
on 20 Mar 2019
@jacob-hd Your code snippet is fine and should not be causing a leak. There was an issue in the past where the interaction between a few components we are using would trigger a leak. It's supposed to be fixed when using Node >=10.14.2. Of course it's possible that it's not completely fixed, but just to be sure, what version of Node are you using?
I am in the process of adding some memory leak detection mechanisms to the tracer to make it easier to diagnose exactly what is holding the spans in memory. This should land in the next few days in a beta release.
rochdev
on 20 Mar 2019
@rochdev Good call - we were using Node 8.11 on this service.
After upgrading to Node 10.15 the leak appears to be gone:
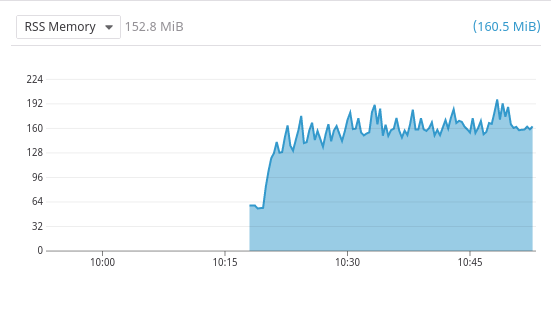
Thanks for the guidance!
jacob-hd
on 22 Mar 2019
Upgraded to 10.15.3 on Friday and still seeing a memory leak:
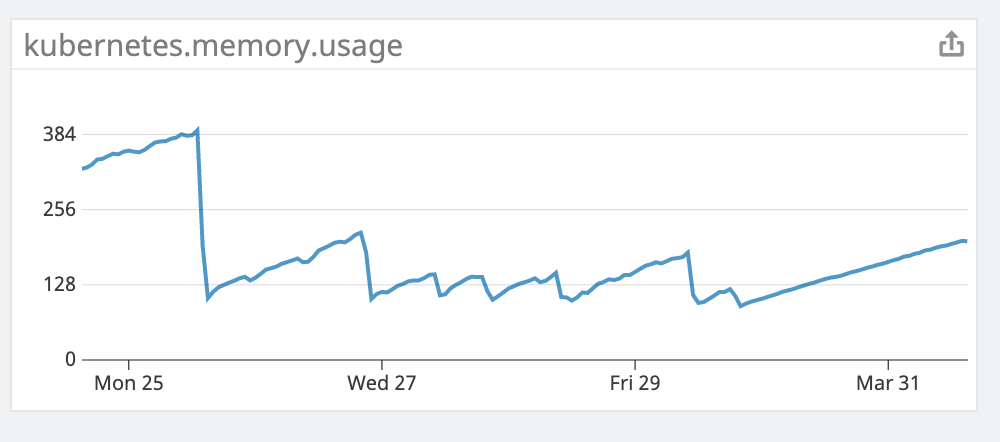
This is a service using the plugins: express, mongo, dns, http client, tcp. Doesn't use any manual instrumentation.
 perryh
on 1 Apr 2019
perryh
on 1 Apr 2019
Btw this service was fine running 0.7. We saw the memory usage growing after upgrading to 0.10.
perryh
on 1 Apr 2019
@perryh Which plugins are used? From the discussions above (and outside of GitHub) it looks like it could be related to the HTTP client integration.
rochdev
on 1 Apr 2019
Yes this particular service uses the HTTP client plugin. The full list is in the comment above.
I manually sent a bunch of requests with apachebench to an endpoint that didn't make HTTP requests and didn't see a spike in memory usage. The other endpoints do and it makes sense.
perryh
on 1 Apr 2019
@perryh Thanks for trying this. I will try to isolate the issue with the http plugin. What options are provided to the http module agent and/or client?
rochdev
on 2 Apr 2019
Yesterday I restarted this service with the http plugin off.
datadogTraceClient.tracer.use('http', false);
Still seeing the memory usage grow over time with http plugin off on node 10.15.3.
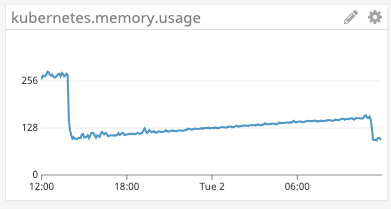
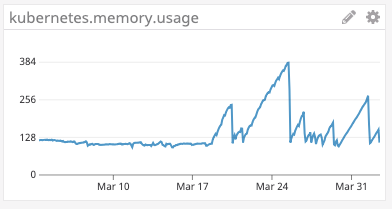
This was the past week with 0.10. We upgraded to node 10.15.3 from node 8 at the end of Friday the 29th.
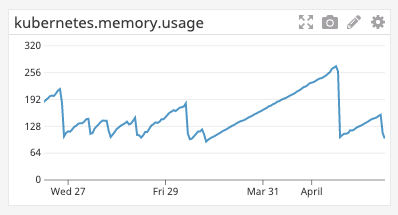
Here is the past month memory usage. We switched from 0.7 to 0.10 on the 18th.
perryh
on 2 Apr 2019
@perryh Are you using Mongoose by any chance?
rochdev
on 3 Apr 2019
No, this service uses the mongodb package. I plan to do more testing soon and get back to you with more findings...
perryh
on 3 Apr 2019
I also want to report a pretty serious memory leak simply using:
const tracer = require('dd-trace').init({
    env: process.env.NODE_ENV
});
Eventually node process would crash with out of memory exception. As soon as I removed dd-trace the memory leak and Node crash went away.
Using require('mongodb') and doing quite a bit of writes a second, between 100 and 1,000 MongoDB writes a second.
If needed, I could start my node process with --inspect and provide further details.
 nodesocket
on 4 Apr 2019
nodesocket
on 4 Apr 2019
I will release a beta version by the end of the week with metrics that should hopefully help pinpoint where the leak comes from.
@nodesocket Do you use any other supported modules from https://docs.datadoghq.com/tracing/languages/nodejs/#integrations?
rochdev
on 4 Apr 2019
@rochdev just the following native:
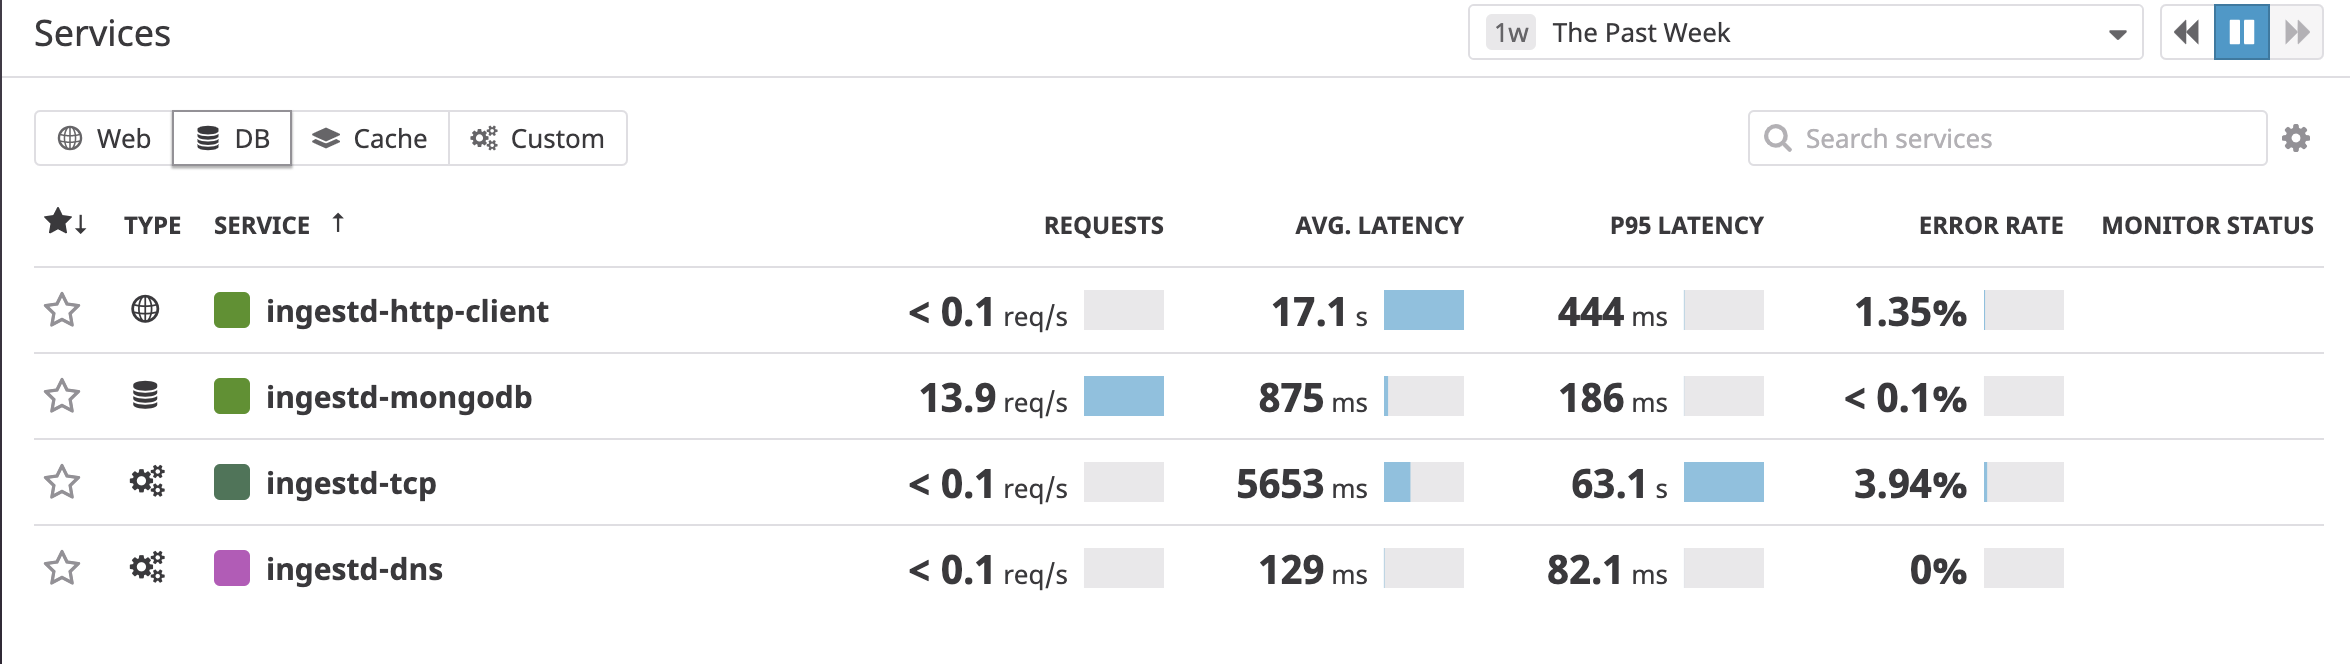
Should have specified, running the latest version of Node.js v10.15.3 and "dd-trace": "0.10.3"
nodesocket
on 4 Apr 2019
not sure if this is helpful (and maybe even completely unrelated), but since dd-trace 0.10.3 there has been exceptions from our application with the message "Premature close" and this backtrace:
/node_modules/dd-trace/src/scope/new/base.js:48:19 in scope.activate
/node_modules/dd-trace/src/scope/new/scope.js:38:14 in Scope._activate
/node_modules/dd-trace/src/scope/new/base.js:13:17 in Scope.activate
/node_modules/dd-trace/src/scope/new/base.js:47:20 in ServerResponse.<anonymous>
It took a month, but we've noticed a memory leak too. We have a 2 apps using the tracer. One had the leak and one didn't. The difference between the apps was the one with the leak was using the mysql integration. After disabling that the leak does not occur. The app experienced the leak using 0.10.0 and 0.10.4. The node version is 10.15.1.
If it would help I could try to get heap dump?
 brandondoran
on 12 Apr 2019
brandondoran
on 12 Apr 2019
It would help. We will also release a new version next week that will have a lot of insights into what is happening in the runtime. I'll keep this thread posted, but it should help determine what is causing the leak.
rochdev
on 12 Apr 2019
I encountered the memory leak quickly, only took a few days before Node.js processes crash out of memory. Not running the mysql integration though, running mongodb integration.
nodesocket
on 13 Apr 2019
Any updates on this memory leak? Just deployed dd-trace 0.10.2 on Node 8 and I'm still seeing a memory leak.
 bjaworski3
on 14 May 2019
bjaworski3
on 14 May 2019
It looks like there is not a single cause of memory leak but multiple. I'm currently working on fixing some of them.
This is what we found so far:
- The span from the
netplugin is never finished if the socket times out. This causes its trace to stay in memory forever. A fix will be in the next release - Older Node versions had an issue where the
destroyhook would never be called for some resources inasync_hooks. Since we rely on this hook to cleanup the context, it was causing a memory leak. This has been fixed in Node^8.15 || ^10.15 || >=12. Updating Node fixes this issue.
We have also added a new Runtime Metrics feature which can help us a lot to pinpoint the source of the leak. The feature is in beta and has to be enabled by us for your account. If you want me to investigate your account specifically using Runtime Metrics, please let me know on our public Slack. My handle is rochdev.
The above is also valid for everyone in this thread. Finding the source(s) of the memory leak is high priority for us, but it's very difficult to find without working directly with users get access to the account, so definitely reach out in Slack if you want to work with us on this.
rochdev
on 14 May 2019
A memory leak in the TCP integration that would impact other integrations has been fixed in 0.11.2, and we have added workarounds for known issues in Node that would cause memory leaks as well in 0.12.0.
I would recommend to anyone in this thread to upgrade the tracer to 0.12.0 and report back if the memory leak is still present or not.
rochdev
on 10 Jun 2019
@rochdev I just enabled the Node.js tracer back in our application running 0.12.0. However I don't see anything listed in APM => Services.
I do however see recent activity in APM => Trace list.


nodesocket
on 11 Jun 2019
@nodesocket If you haven't been using the tracer for a while, the service list was reset. New services might take a few minutes to appear.
rochdev
on 11 Jun 2019
@rochdev been over 15 minutes, should I wait longer or is something wrong?
nodesocket
on 11 Jun 2019
@nodesocket Usually it takes around 5-10 minutes, but we've been experiencing unusual delays today, so it's possible it will take more time. In general if you can see the traces and they have the correct service on them the services should eventually appear.
This delay only exists when a new service is added, which is every service when you weren't previously using the tracer.
rochdev
on 11 Jun 2019
I can confirm a pretty significant memory leak is preset in 0.12.1. We deployed a portion of our cluster with the agent disabled with the following results.

Using the following code
if (process.env.DATADOG_AGENT_HOST) {
  const enabled = Math.random() > 0.5 ? true : false;

  tracer.init({
    hostname: process.env.DATADOG_AGENT_HOST,
    enabled: enabled,
    runtimeMetrics: enabled,
    env: process.env.ENVIRONMENT,
    tags: ['app:name', `environment:${process.env.ENVIRONMENT}`],
    sampleRate: 0.1
    plugins: false,
  });
}
We're using Node 11.15.0 for this trace, but the issue persists on 10.16.0 also.
We've determined that using the noop scope prevents the leak. As such we tried using the async-listener scope which also exhibited the same leak as the default async-hooks scope.
 xzyfer
on 8 Jul 2019
xzyfer
on 8 Jul 2019
@xzyfer At this point I would say there are 2 likely causes for leaks:
There is a pre-existing leak in the application that the tracer is making worse. With the latest version, all memory leaks reported so far were caused by this. We will have an improvement in the next version that will lessen the impact of the tracer in this scenario, but it's still important to find the root cause of the leak.
There is a memory leak in one of our integrations.
In both cases, we would need to take a look at the runtime metrics in your account to confirm what is happening. I would recommend to direct message me on our public Slack (I'm @rochdev) or open a support ticket. You can find the documentation to enable runtime metrics here.
rochdev
on 8 Jul 2019
@rochdev interestingly it was the runtime metrics that pointed us to looking at the APM library itself.

Note that the async resource counter is never decremented until the instance is OOM killed.
There is a memory leak in one of our integrations.
We thought this also so we disabled all plugins and run time metrics just in case.
xzyfer
on 8 Jul 2019
There is a pre-existing leak in the application that the tracer is making worse
After digging deeper into async.resources.by.type I think you may be onto something.
xzyfer
on 8 Jul 2019
This is a very high number of async resources. I have 2 questions that could help narrow down the issue:
- Which async resources have the highest count?
- Is there a high count of unfinished spans on the heap or are they almost all finished?
rochdev
on 8 Jul 2019
- The async resources are predominantly timeouts
- Not sure how exactly to confirm this?
On Tue., 9 Jul. 2019, 12:04 am Roch Devost, notifications@github.com
wrote:
This is a very high number of async resources. I have 2 questions that
could help narrow down the issue:
- Which async resources have the highest count?
- Is there a high count of unfinished spans on the heap or are they
almost all finished?—
You are receiving this because you were mentioned.
Reply to this email directly, view it on GitHub
https://github.com/DataDog/dd-trace-js/issues/402?email_source=notifications&email_token=AAENSWGOBBMFKQ2T65EFTULP6NCP7A5CNFSM4GM4DZOKYY3PNVWWK3TUL52HS4DFVREXG43VMVBW63LNMVXHJKTDN5WW2ZLOORPWSZGODZNF5BI#issuecomment-509238917,
or mute the thread
https://github.com/notifications/unsubscribe-auth/AAENSWH2TWU47DJFJZLQQJLP6NCP7ANCNFSM4GM4DZOA
.
xzyfer
on 8 Jul 2019
- Interesting. In the tracer we only use 2 timers that are instantiated only once per process. Is it possible something in your app would hold a reference to a timer?
- In the graph above in
Heap Spanseach line represent a specific span with its state.
rochdev
on 9 Jul 2019
- We have no timers in our code. The application is an Apollo GraphQL Server with a handful of very simple resolvers.
- They appear to predominately, by orders of magnitude, be finished spans.
xzyfer
on 9 Jul 2019
I think the timeouts Async resource refers to network request timeouts to downstream
xzyfer
on 9 Jul 2019
I've continuing to augment our reporting. The current candidate looks like node-fetch's timeout handling
https://github.com/bitinn/node-fetch/blob/0c2294ec48fa5b84519f8bdd60f4e2672ebd9b06/src/index.js#L88-L93
xzyfer
on 9 Jul 2019
Ultimately it looks like pm2 is the root cause. There is a known memory leak that was recently patched in https://github.com/keymetrics/pm2-io-apm/releases/tag/4.2.2.
Even with this patch applied we're experiencing a leak but much slower than previously.

Left: @pm2/[email protected]
Middle: no pm2
Right: @pm2/[email protected]
xzyfer
on 9 Jul 2019
They appear to predominately, by orders of magnitude, be finished spans.
Perfect, this means that it's not spans holding async resources but the other way around.
Even with this patch applied we're experiencing a leak but much slower than previously.
Does it still seem to be caused by ever increasing async resources?
rochdev
on 9 Jul 2019
Actually I just noticed that the middle line is stable without PM2. This seems to indicate that there is still memory leak in the latest release of PM2 and not in dd-trace. Was that the outcome of your investigation?
rochdev
on 9 Jul 2019
I noticed that the async hooks are being enabled but never disabled. Is this intentional? https://github.com/DataDog/dd-trace-js/blob/master/packages/dd-trace/src/scope/async_hooks.js#L31
I'm seeing memory leaks happen only in my jest test environment (node 8.16, dd-trace 0.13.1, jest 23) when watching for changes; it seems that restarting the tests repeatedly (including dd-trace setup) will eventually cause FATAL ERROR: CALL_AND_RETRY_LAST Allocation failed - JavaScript heap out of memory and the last line of code in the stack trace is related to async hooks Security context: 0x1a91fcd25891 <JSObject>
1: _init [/code/node_modules/dd-trace/packages/dd-trace/src/scope/async_hooks.js:~52] [pc=0x1e881f6f83ee](this=0xc08dc4859a9 <Scope map = 0x3d2e1d02781>,asyncId=1022343,type=0x1b58ae12951 <String[10]: TickObject>,triggerAsyncId=1020161,resource=0x98a3be27f79 <TickObject map = 0x2725aef10e81>)
2: nextTick [internal/process/next_tick.js:~246] [pc=0x1e881f9790a3](this=0x3...
 brian-l
on 31 Jul 2019
brian-l
on 31 Jul 2019
@brian-l This might be because of the way Jest works. For example, if it clears the require cache while the tracer is still active, it will just keep adding new tracers constantly without cleaning up the old one, taking up more and more memory.
This could be addressed by adding a way to enable/disable the tracer at runtime, which could be added after each run for example. This will be available in the coming weeks.
It's possible that it's caused by something else, but in a test environment I would say this is the most likely cause. We will be able to validate this once the functionality to disable lands.
In the meantime, I would recommend to simply disable the tracer in your tests by using the DD_TRACE_ENABLED=false environment variable.
rochdev
on 31 Jul 2019
@brian-l This might be because of the way Jest works. For example, if it clears the require cache while the tracer is still active, it will just keep adding new tracers constantly without cleaning up the old one, taking up more and more memory.
This could be addressed by adding a way to enable/disable the tracer at runtime, which could be added after each run for example. This will be available in the coming weeks.
It's possible that it's caused by something else, but in a test environment I would say this is the most likely cause. We will be able to validate this once the functionality to disable lands.
In the meantime, I would recommend to simply disable the tracer in your tests by using the
DD_TRACE_ENABLED=falseenvironment variable.
that didn't change anything unfortunately, however this investigation has revealed other memory leaks that need to be fixed as well so our issues are not caused by this library as far as I can tell. thanks.
brian-l
on 1 Aug 2019
We've had several reports that the issue is fixed completely, and no new report of memory leaks for several months at this point, so closing this issue.
rochdev
on 2 Oct 2019
We're running dd-trace 0.16.1, and can confirm that there is definitely a memory leak. We tried disabling plugins, but disabling tracing completely is the only thing that stopped our services from running out of memory and crashing.
Should I log a new, separate issue?
 devillexio
on 22 Nov 2019
devillexio
on 22 Nov 2019
@devillexio Please open a new issue. It will make it easier to keep any underlying causes separated.
rochdev
on 22 Nov 2019
@rochdev As requested, I logged #759.
devillexio
on 22 Nov 2019
Related issues
 bojand
·
4Comments
bojand
·
4Comments
 kumaraksi
·
5Comments
kumaraksi
·
5Comments
 Cretezy
·
5Comments
Cretezy
·
5Comments
 TheComfyChair
·
5Comments
TheComfyChair
·
5Comments
 vecerek
·
3Comments
vecerek
·
3Comments
Most helpful comment
We are also experiencing this problem:

All of our dd-trace enabled pods will consume more and more memory until they starve the nodes and are restarted, and then they restart at 0mb and again slowly crawl their way up to GB and GB of leakage.
I took a snapshot of a pod that was around 190mb at the time:

Looks like the datadog scope manager is taking up 60% of the memory here.
Here's our full instrumentation: