Dataverse: Memory leak when dataverse is stressed with GET requests
Our Dataverse was coming to a grinding halt with a CPU load of 400%
The high CPU load seems to be a result of a high memory usage.
Probably the GC kicks in when the memory is getting full.
When glassfish or the whole server is restarted memory usage is back to low.
We have looked in the logs and finally discovered that the site got scraped and someone was firing a GET request every second visiting verse pages with type=file and fq0, fq1 and fq2 parameters.
The scenario to produce leakage has been reduced to a simple GET request on a verse (non- homepage also) every second. If this is done for 10 minutes we get a 200M leak.
WE are running our fork on 4.10.1 on production, but we could reproduce this with the 4.14 war file from IQSS
 PaulBoon
All 34 comments
I was able to reproduce this using v4.15.1, with the dataverse page, dataset page, file landing page. I have not tried others.
In reproducing the problem, it is easier to set the heap very small (1GB) so you can more easily see the growing leak due to relative scale and more quickly fill up memory, causing the full GC, high CPU, and eventual out of memory. The GC selected did not seem to make much of a difference in preventing the ultimate failure.
Notes for reproducing:
- set heap to 1GB for quicker testing and clearer problem behavior
- drive any page to test but known pages are dataverse, dataset, file landing, login (from above note) using 1 second requests like this: watch -n 1 curl -s "http://localhost:8080/dataverse/root" . Note that using a dataset page with multiple files (89 in my case) was many times worse than dataverse page and so quicker to problem.
- observe effect on memory using jconsole, visualvm or a command line tool like jstat:
./jstat -gcutil -h 20 2129 250
S0 S1 E O M CCS YGC YGCT FGC FGCT GCT
0.00 0.00 100.00 99.99 88.87 80.87 459 7.986 716 547.741 555.728
0.00 0.00 99.44 99.99 88.87 80.87 459 7.986 716 548.692 556.679
0.00 0.00 100.00 99.99 88.87 80.87 459 7.986 717 548.692 556.679
0.00 0.00 100.00 99.99 88.87 80.87 459 7.986 717 548.692 556.679
E is the initial Eden memory that maxes out, gets clear with YGCT, and anything not cleared gets moved to O, the old generation memory for long lived objects. What I'm seeing is O slowly fills up until 100% and that triggers a full GC (FGC) and that is stop the world so users will notice a pause. The FGC does free up some small amount of O and the process repeats, though it becomes more frequent. However, I have not been able to cause out of memory. The first FGC happened after 30 mins and it has taken maybe an additional hour until the site has become unresponsive due to the GC. CPU had shown occasional spikes but now is up near 400% (4 threads in GC setting?) .
Update: I was able to eventually cause out of memory, it just took an hour or so of being in that FGC state before it happened.
For reference, see RT ticket, 278526
 kcondon
on 18 Jul 2019
kcondon
on 18 Jul 2019
Hey @PaulBoon! I've queued this for the IQSS team to work on in our next sprint, beginning on Wednesday. Two quick questions:
- Do you plan to do any work in this area and produce a pull request? If so, we'll either wait or coordinate with you. Let me know.
- Is there any additional information that you can provide here that would be helpful?
Thank you again for reporting and troubleshooting this with @kcondon.
 djbrooke
on 22 Jul 2019
djbrooke
on 22 Jul 2019
Hi @djbrooke, Great to hear that you have planned it in your next sprint.
I am still working on my own sprint, with this memory leakage as an incident. My plans are to keep a look at this issue, while working on other stuff before going on holidays. So I don't think I can be of help much right now.
PaulBoon
on 23 Jul 2019
@PaulBoon thanks for opening this issue. Do you have a JMeter script I can add to pull request #6043 that reproduces the memory leak?
 pdurbin
on 23 Jul 2019
pdurbin
on 23 Jul 2019
@pdurbin The 'script' that I used is very simple, but I can put it here so you can have a look. I used apache-jmeter-5.1.1 to produce it.
Dataverse Memory Leak.jmx.zip
PaulBoon
on 24 Jul 2019
Maybe it would be interesting to see if the known Solr leak is involved, by applying the fix and test. But I don't see how it could explain the leaking I saw if I just visited the loginpage every second, or other pages.
To me this suggests that it is something very basic, like primefaces related.
@kcondon discovered that it leaked harder if there where lots of files on a datasetpage, maybe this corresponds to lots of leaking primefaces components?
This one might be interresting: https://github.com/primefaces/primefaces/issues/4849
PaulBoon
on 26 Jul 2019
Interesting. Looks like it was related to the p:autoUpdate component introduced in PrimeFaces 6.2, which we upgraded to in #4220 and released in 4.9.2.
 mheppler
on 26 Jul 2019
mheppler
on 26 Jul 2019
@PaulBoon thanks. As you may have noticed this issue got pulled into our current sprint. I'm on vacation all next week (and the Monday after) but please do continue to comment here with any findings. I agree with you and @mheppler that it could be something fundamental like PrimeFaces.
Do you have any favorite tools for monitoring memory (especially within the JVM) or other resources over time. I need to get up to speed with VisualVM but I'm thinking more of something like Munin or Prometheus.
I'm hacking a bit on getting jstat output into Munin as part of https://github.com/IQSS/dataverse-ansible/issues/91 . I'm also thinking about trying to pull metrics out of Glassfish like I did with asadmin in #2595.
Munin has a lot of plugins that "just work" out of the box. For example, here's a graph having to do with postgres transactions:
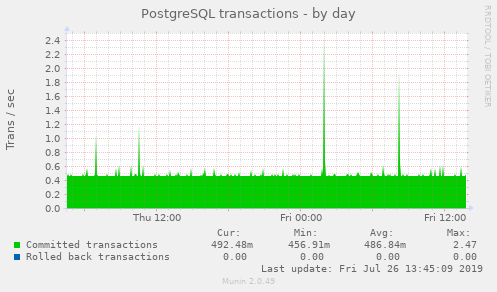
Of course, Munin is a pretty old tool and there are newer things like Prometheus that https://github.com/eclipse/microprofile-metrics supports. I don't have any experience with Prometheus though.
pdurbin
on 26 Jul 2019
I have to report that while I'm definitely seeing some leaking, I'm not observing anything that catastrophic just yet while testing the current dev. branch.
With the latest test above, I have to point out that setting the heap to 1GB is just too tight a constraint; in a sense that our app just needs more than that to be able to run and serve requests continuously.
On a system with a decent amount memory the GC cycle becomes somewhat stable. For example, I haven't been able to kill dvn-vm5 with a pretty heavy overnight bombardment by requests to some resource-intensive dataverse pages; a periodic FGC keeps bringing it down to some sensible number.
Once again, THERE ARE definitely leaks. The after-FGC number keeps growing, even if slowly; and I am seeing steadily growing numbers of (our) entities - Datasets, Dataverses, etc. objects on the stack that are not getting cleared by FGC. I'm still looking for the sources of these.
But it doesn't look like you can kill the app with repeated calls to just the login page in its current form.
I'll post some numbers and more info.
 landreev
on 15 Aug 2019
landreev
on 15 Aug 2019
@landreev The 1GB value was only used to reduce the memory scale to better show the leak behavior, it was not intended to be an actual operational setting. The same leak happens with larger mem settings, though as you've seen, it takes a while to appear. I think Paul Boon was using 8-16GB.
What happens is memory appears to become stable at Old gen around 97-99% full and FGC kicks in and clears a small amount, 1% at best. This allows the app to function for quite a bit longer as FGC increases in frequency until the stop the world nature becomes more prevalent. I observed it took 1/3 of the time to problem state to reach 100% old gen and first FGC, then 2/3 time to problem state before FGC cycle became so frequent it appeared stuck.
I believe you can watch our own productions use of memory and roughly calculate, based on FGC counts and FGCT, when FGC ultimately causes the service to become noticeably unavailable and trigger a bounce.
kcondon
on 15 Aug 2019
I know.
All I meant was, giving the system less memory than it needs to run is just not an informative test.
landreev
on 15 Aug 2019
The autoupdate issue (referenced above) is an interesting lead.
(and it is something our command line tests are NOT testing at all)
landreev
on 15 Aug 2019
OK, won't argue (any more) but the app functioned just fine at 1GB for loading dv and ds pages on an empty db. It is easy enough to increase to 2GB or 4GB. All I'm saying is it is not an invalid test. Peace out!
kcondon
on 15 Aug 2019
Hmm. There is a growing number of javax.faces.component.StateHolderSaver instances (mentioned in the autoupdate issue) that are not garbage-collected, even with testing page loads on the command line.
landreev
on 15 Aug 2019
To be clear, that leak in the PrimeFaces autoUpdate is not our biggest problem. It's a tiny object (24 bytes!); it's just that the person who reported the bug has a pretty unique application case - thousands of users, all keeping active sessions open for hours, with pages refreshing continuously via autoupdate; so in the end they get enough of the copies of these 24 byte classes to eat up all their memory.
We have all sorts of other things eating up our memory here...
landreev
on 16 Aug 2019
OK, I found a way to completely eliminate the leaks, at least in the pages I have tested (Dataverse page, specifically): set the session timeout to 1 minute. Then it sets into a cycle where each FGC brings oldgen allocation back to nothing.
The bad news is we can't run the app with 1 minute sessions. But, seriously, this is still super important because it proves that the leaks are simply allocated classes that are scoped to the lifetime of the user session.
It's not immediately clear why, because all of our page beans are ViewScoped... There's not much that is SessionScoped, other than DataverseSession itself. So basically all we need to do is figure out how to untie whatever entities that a page has created from the session past the life of the page view.
landreev
on 16 Aug 2019
A brief update: tested one simple optimization approach: we can go through our ViewScoped beans and select the ones that don't really need to be so; i.e. only use view scope on the beans that are actually needed to facilitate dynamic/ajax updates, and make the rest request scoped.
So for the dataverse page, I tried making SearchIncludeFragment RequestScoped, leaving the main page bean ViewScoped.
This appears to be improving things measurably (will add more details tomorrow).
(This is a proof of concept only, not a ready fix - but still.)
landreev
on 20 Aug 2019
The observable results of the experiment, as described above:
after 8K loads of a specific dataverse page the share of the oldgen memory occupied by the objects unrecoverable by full garbage collection reaches 10% of the total.
Previously, without the change above, the same number of loads resulted in the 30% of og being hogged. (the session lifespan is set to the default 24 hours; it takes well below that to run the 8K page loads - meaning none of the sessions have started expiring yet)
This looks like a 3X easy improvement... The comparison is not entirely accurate though - since I had to disable that extra ajax pass (that activates the thumbnails and some other cosmetic features once the main load of the pages completes) in order to make the bean RequestScoped; so the page is doing a little less now. So an accurate comparison is to run it against a build with the ajax pass similarly disabled, but the bean still ViewScoped (running now).
But whatever the final ratio is going to be, the very fact that this approach is working can be confirmed - for example, by looking at the number of instantiated Dataset classes on the stack (the datasets are loaded inside the search include fragment). During the control run, the number is growing, unaffected by full garbage collections. With the change applied, it stays low.
landreev
on 20 Aug 2019
(I have edited the comment above; the part about the extra ajax pass was crazy talk - since the original test involved accessing the page with a single GET request via curl, so no ajax functionality was being tested).
So yes, this simple one line fix does make the page 3 times less of a long term memory hog (but a few changes still need to be made to the page, in order to make the thumbnails appear without the ajax pass).
Also, working on a prototype to test limiting the lifespan of __anonymous__ user sessions (as discussed during the tech talk yesterday).
landreev
on 21 Aug 2019
The httpSession.setMaxInactiveInterval(...) on login solution works, btw.
landreev
on 22 Aug 2019
@landreev great stuff and I really appreciated the brain dump at tech hours.
Yesterday and standup I mentioned that while I think jconsole and jstat are cool and valuable, I'm interested in automating the process of collecting and displaying metrics about JVM memory use, etc, over time. It turns out @pmauduit has experience monitoring Java applications with JMX using a combination of collectd, Prometheus, and Grafana and he and I made great progress today over at https://github.com/IQSS/dataverse-ansible/issues/99 . This a little more on topic at #5977 (Better Detection of Memory Leaks/Usage) I believe, but I'm mentioning it here because this is the issue that's in the sprint and to follow up more specifically on what I was trying to express at standup yesterday.
pdurbin
on 23 Aug 2019
Thanks @landreev
I have been away for three weeks and missed all tech talks, so possibly I am a bit confused, but if it is just the lifespan of anonymous user sessions that is causing the problem, then it is actually not a memory leak after all is it?
PaulBoon
on 26 Aug 2019
@PaulBoon well, not just anonymous user sessions but all sessions. The "session-timeout" is 1440 minutes or 24 hours: https://github.com/IQSS/dataverse/blob/v4.15.1/src/main/webapp/WEB-INF/web.xml#L135 . You're welcome to play around with this to see if you observe any differences. But yes, as you say, our current thinking is that there is no known memory leak. Resources are being consumed and not freed until after sessions expire. It's promising that setMaxInactiveInterval works. I'm not sure what our solution will be. You're certain welcome to continue playing around and making suggestions. :smile: Welcome back! :smile:
pdurbin
on 26 Aug 2019
Ok, unless there is a reason for an anonymous user to have a session, this might be set at a 0 second timeout then.
PaulBoon
on 26 Aug 2019
Before ruling out memory leaks completely, I would like to see confirmation that all memory comes back when we wait for 24 hours after stopping with the get requests and sessions have expired.
PaulBoon
on 27 Aug 2019
@PaulBoon makes sense.
Today after standup (about 11:30am local time) I started hitting the Dataverse homepage every two seconds with curl to see what the fancy new Prometheus/Grafana graphs would look like. I thought maybe Dataverse would die but it's been about 7 hours and it hasn't died yet. Here's a screenshot from Grafana:
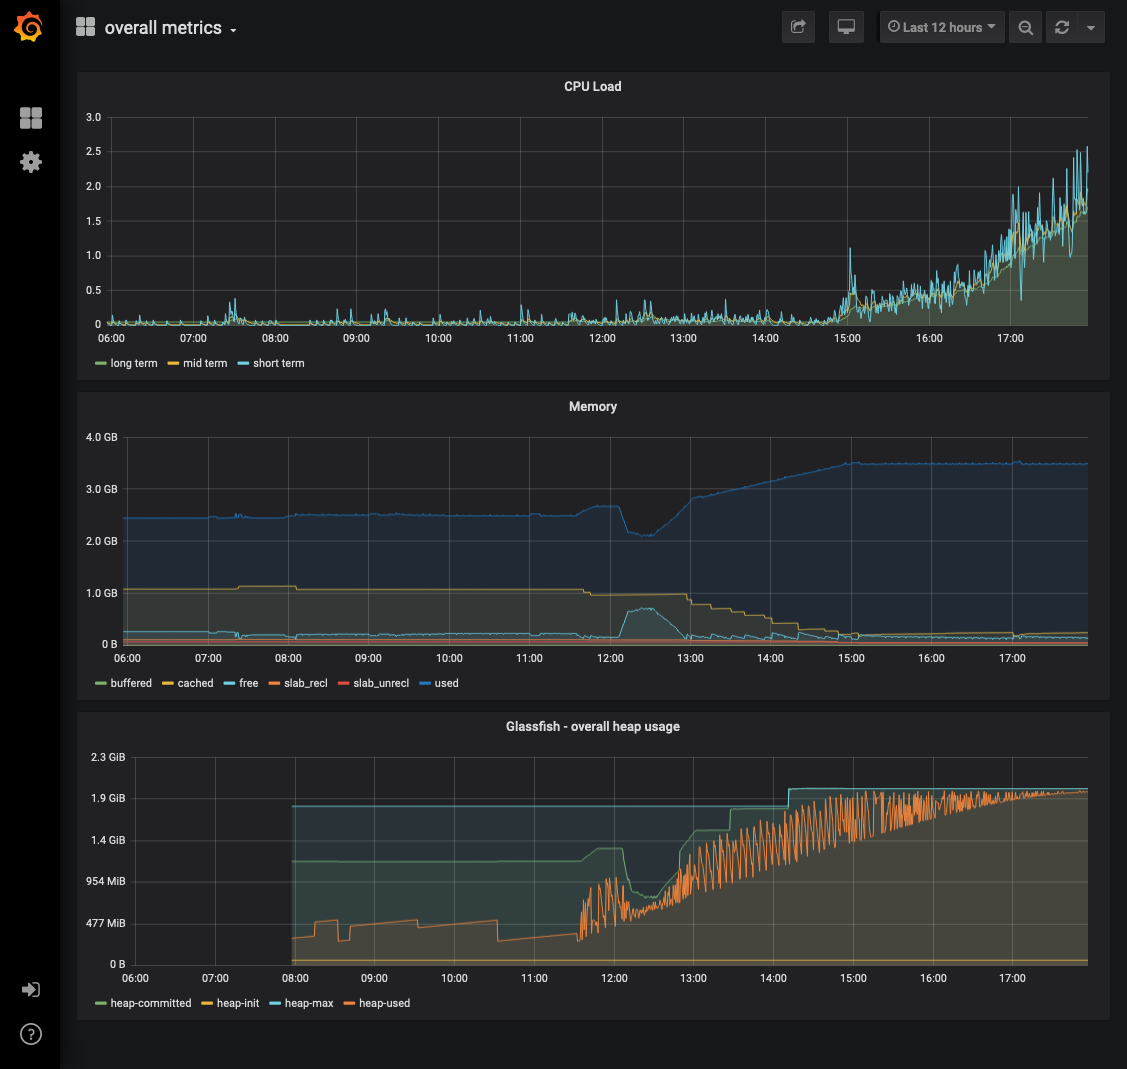
pdurbin
on 28 Aug 2019
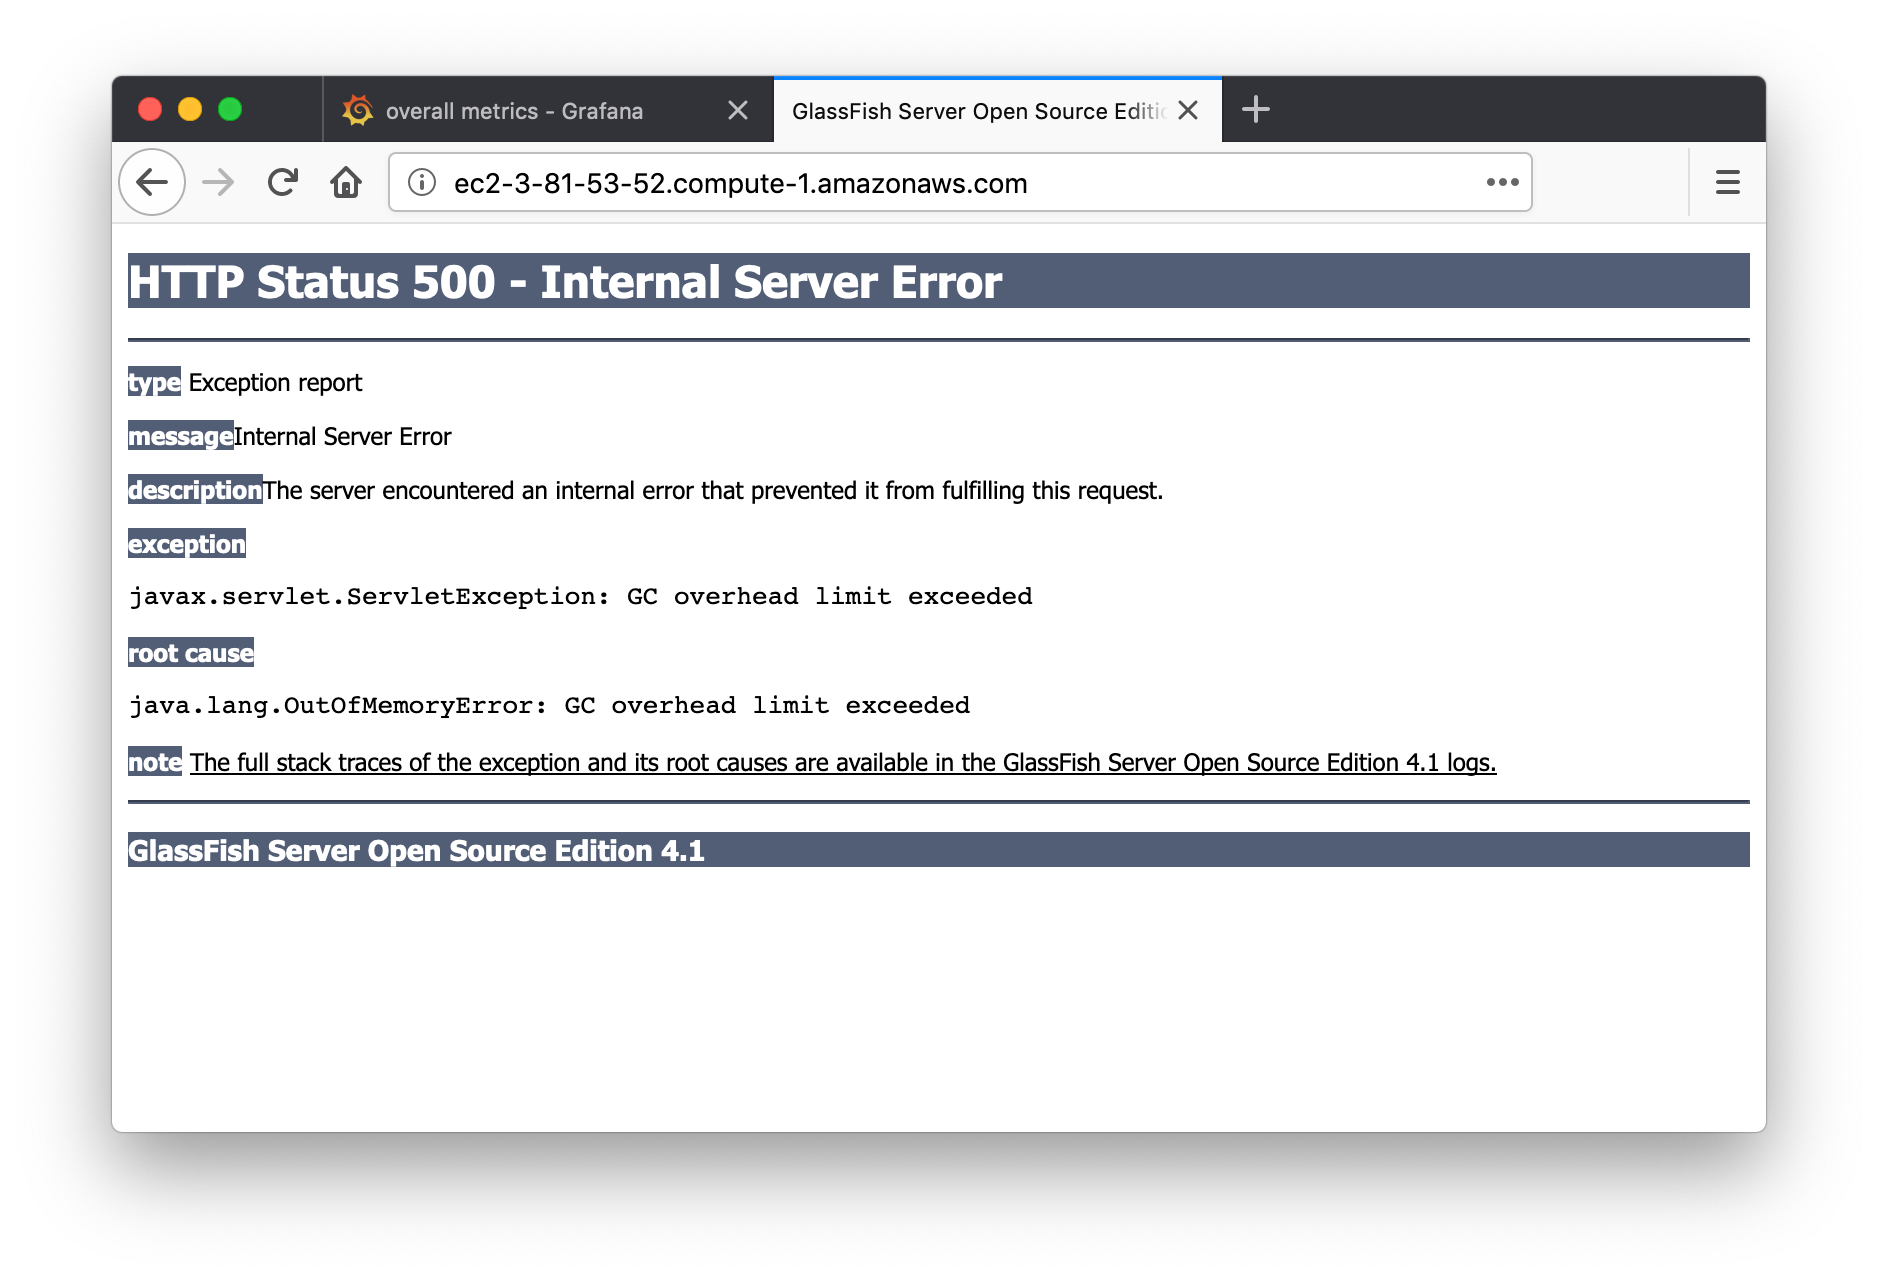
I thought maybe Dataverse would die but it's been about 7 hours and it hasn't died yet.
I just biked home and that was enough time for Dataverse to die, sadly. When you try to go to the home page you see "java.lang.OutOfMemoryError: GC overhead limit exceeded" like this:
The graph is nearly identical to the one I posted 40 minutes ago but her it is anyway:
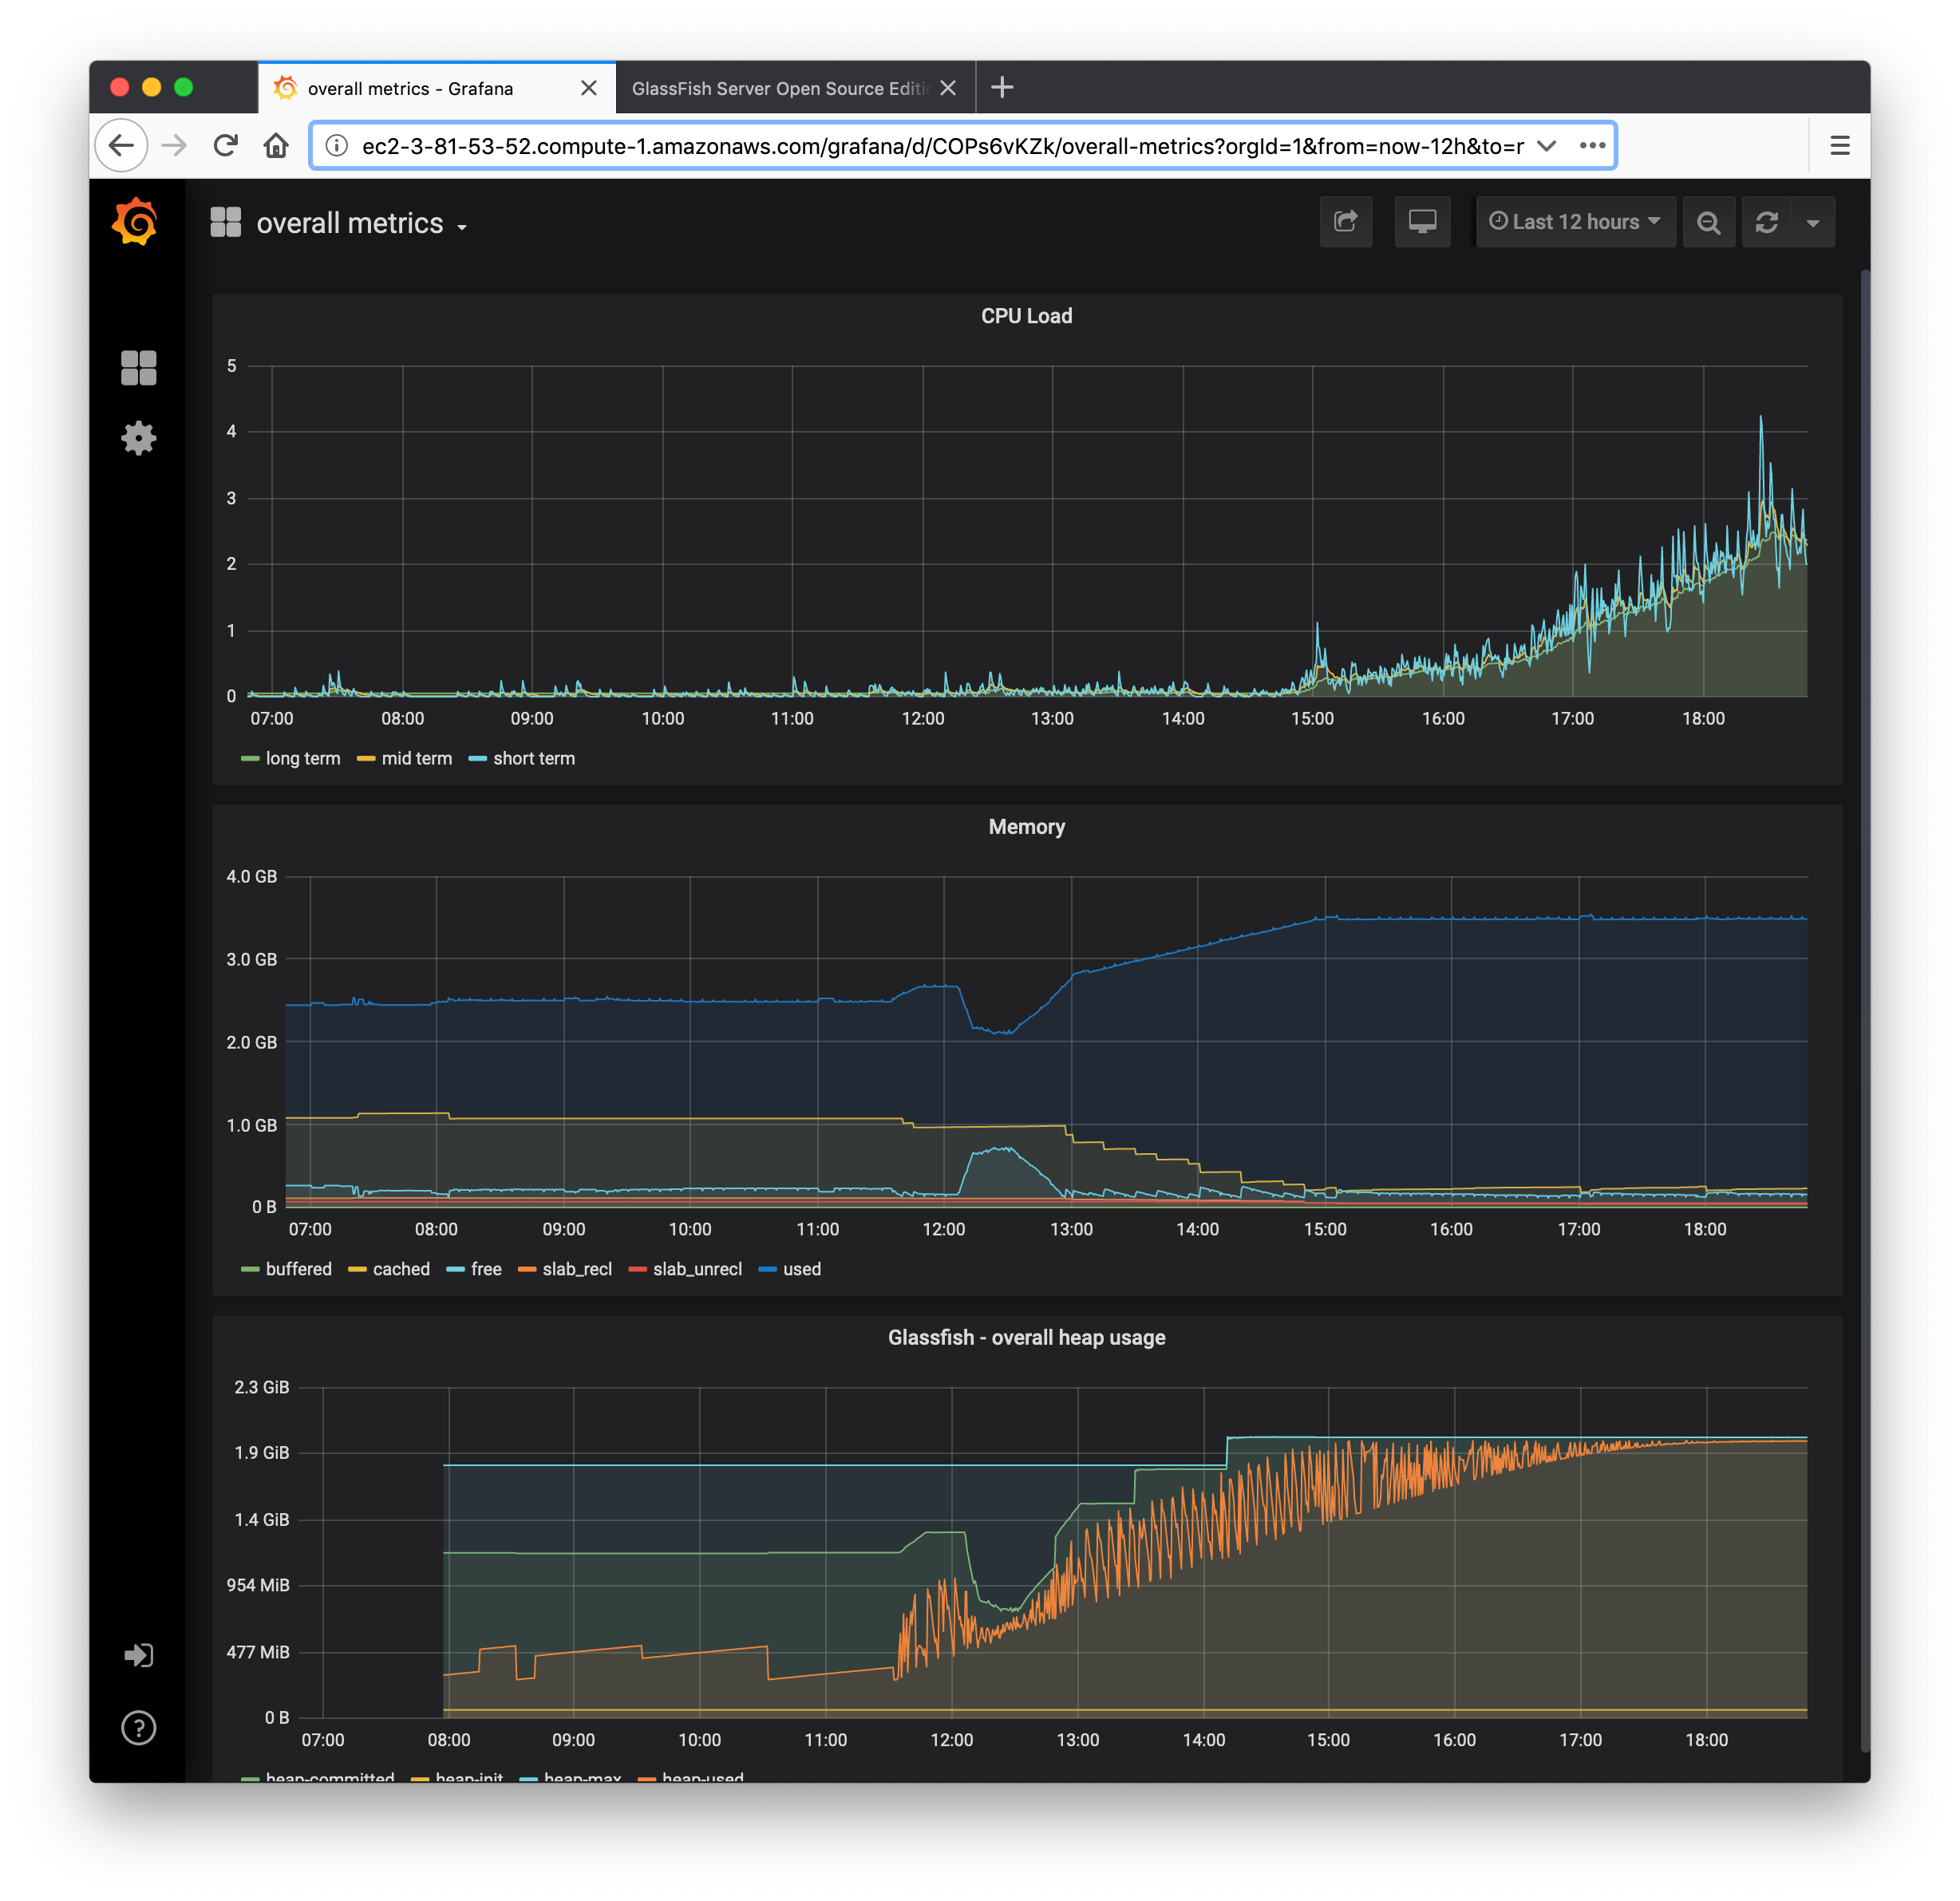
pdurbin
on 28 Aug 2019
About this OOMError, do you have a memory dump generated somewhere, so that one could analyze the content of the heap ?
 pmauduit
on 28 Aug 2019
pmauduit
on 28 Aug 2019
@PaulBoon
I was away for a few days myself.
but if it is just the lifespan of anonymous user sessions that is causing the problem, then it is actually not a memory leak after all is it?
There most likely are "real" memory leaks in the application as well; both in the pages and the APIs. But the absolute bulk of the stack growth that you see when stressing the dataverse page with anonymous GETs, that's actually crashing the system, is definitely the objects scoped to the lifetime of the session. This can be verified experimentally. By setting the timeout to something very low. And/or leaving it set to a high value, stressing the system, then waiting for the sessions to expire and confirming that full GC frees most of the memory in the oldgen.
Anonymous sessions are indeed the worst offenders. Or, to be precise, accessing the site without the session, repeatedly - i.e., from a script/the command line, etc., without re-submitting the jsession cookie - is particularly wasteful. Because each GET creates a new session. (so, running "curl http://localhost:8080/dataverse" on the command line 1000 times is about 1000X worse than reloading the page 1000 times in the browser, yes)
Luckily, an easy but very effective improvement is to reduce the lifespan of an anonymous session. In practice, we are going to achieve this by reducing the default session timeout (in web.xml); then increasing it to some (configurable) value whenever we log a user in.
landreev
on 30 Aug 2019
While these are not "leaks" technically, they kind of are, in a sense that this is to a large degree unintentional.
Most of our beans are ViewScoped, not SessionScoped. They don't have to stay alive for the duration of the session. Views can be destroyed programmatically. It's not trivial, determining when it is safe to kill a view - but we don't even try, we just let them sit there. (there are situations when we DO want to keep a view alive. A user actively editing a dataset should be able to take a break, and be able to keep editing it, and we want all the dynamic/ajax things on the page to keep working, etc.)
But some things clearly don't even need to be ViewScoped. For example, in the dataverse page, it appears that one of its backing beans, that's responsible for roughly 2/3 of the memory allocation, can be safely switched to RequestScoped - and than whatever memory it has allocated is guaranteed to be cleared by the next garbage collection run.
I'll be making a pull request shortly. It's going to be a combination of the solutions outlined above, plus some extra info for the dev. guide. There are no plans for it to fix ALL the memory leaks in the application; but it will seriously improve the situation, and provide the blueprint for applying the scope techniques to other pages.
landreev
on 30 Aug 2019
I backported the commit from @landreev https://github.com/IQSS/dataverse/commit/ee28be67da35fa204adcb28e7b07e9625830c774 into our DANS-KNAW 4.10.1 version and it works as expected.
When issuing GET requests on the homepage every second, memory consumption still goes up, but comes back after GC. Also a GC makes memory come back to the initial low consumption level when the request are stopped for more then ten minutes (the default anonymous session timeout).
PaulBoon
on 9 Sep 2019
@PaulBoon that's fantastic news! Thanks for testing! As an optimization, you might also be interested in 51e2f65 to destroy sessions on logout. You got the main commit but the second commit is also in the same pull request (#6143).
pdurbin
on 9 Sep 2019
I would prefer anonymous access to be without a session (stateless), especially for data landing pages that might be scraped (also by Google?).
Even though this issue is closed I guess that this is not the case yet and I do hope that the effort to make pages 'sessionless' will somehow continue.
PaulBoon
on 11 Sep 2019
@PaulBoon can you please create a fresh issue about this? I feel like #3254 is related and maybe 2814f8b
pdurbin
on 11 Sep 2019
Related issues
 bsilverstein
·
3Comments
bsilverstein
·
3Comments
 BPeuch
·
4Comments
BPeuch
·
4Comments
 jggautier
·
4Comments
jggautier
·
4Comments
 matthew-a-dunlap
·
4Comments
matthew-a-dunlap
·
4Comments
 poikilotherm
·
4Comments
poikilotherm
·
4Comments
Most helpful comment
Maybe it would be interesting to see if the known Solr leak is involved, by applying the fix and test. But I don't see how it could explain the leaking I saw if I just visited the loginpage every second, or other pages.
To me this suggests that it is something very basic, like primefaces related.
@kcondon discovered that it leaked harder if there where lots of files on a datasetpage, maybe this corresponds to lots of leaking primefaces components?
This one might be interresting: https://github.com/primefaces/primefaces/issues/4849