Datadog-agent: Datadog agent crashes constantly when running as DaemonSet on GKE
Describe what happened:
On all our GKE clusters, the DaemonSet's pods restart constantly due to failed liveness probes.
Cluster example one:
> kubectl get all

NAME                      READY   STATUS    RESTARTS   AGE
pod/datadog-agent-2w2md   1/1     Running   284        3d
pod/datadog-agent-2wmh8   1/1     Running   32         3d
pod/datadog-agent-47q5k   1/1     Running   211        3d
pod/datadog-agent-8qfx8   1/1     Running   20         3d
pod/datadog-agent-9r8h7   1/1     Running   76         3d
pod/datadog-agent-hfwt9   1/1     Running   23         3d
pod/datadog-agent-klmpd   1/1     Running   131        3d
pod/datadog-agent-kmh64   1/1     Running   6          3d
pod/datadog-agent-mrmvs   1/1     Running   5          3d
pod/datadog-agent-wlshk   1/1     Running   7          3d
pod/datadog-agent-xgvfx   1/1     Running   2          3d

NAME                           DESIRED   CURRENT   READY   UP-TO-DATE   AVAILABLE   NODE SELECTOR   AGE
daemonset.apps/datadog-agent   11        11        11      0            11          <none>          91d

> kubectl describe pod datadog-agent-2w2md
...
Events:
  Type     Reason          Age                    From                                         Message
  ----     ------          ----                   ----                                         -------
  Normal   SandboxChanged  15m (x2 over 4h41m)    kubelet, gke-harness-pool-yin-2f5f1c84-wtw2  Pod sandbox changed, it will be killed and re-created.
  Warning  Unhealthy       15m (x75 over 3d11h)   kubelet, gke-harness-pool-yin-2f5f1c84-wtw2  Liveness probe failed:
  Normal   Killing         15m (x2 over 4h41m)    kubelet, gke-harness-pool-yin-2f5f1c84-wtw2  Killing container with id docker://datadog-agent:Need to kill Pod
  Warning  Unhealthy       15m                    kubelet, gke-harness-pool-yin-2f5f1c84-wtw2  Liveness probe failed: rpc error: code = 2 desc = oci runtime error: exec failed: container "34cc7e7898f8d5278f0c86788e3dc1347b039f9998563b7eda2629604c6c5a3b" does not exist
  Normal   Pulling         15m (x284 over 3d20h)  kubelet, gke-harness-pool-yin-2f5f1c84-wtw2  pulling image "datadog/agent:latest"
  Normal   Pulled          15m (x284 over 3d20h)  kubelet, gke-harness-pool-yin-2f5f1c84-wtw2  Successfully pulled image "datadog/agent:latest"
  Normal   Created         15m (x284 over 3d20h)  kubelet, gke-harness-pool-yin-2f5f1c84-wtw2  Created container
  Normal   Started         15m (x284 over 3d20h)  kubelet, gke-harness-pool-yin-2f5f1c84-wtw2  Started container
  Warning  Unhealthy       15m (x265 over 3d20h)  kubelet, gke-harness-pool-yin-2f5f1c84-wtw2  Liveness probe failed: Agent health: FAIL
=== 1 healthy components ===
healthcheck
=== 15 unhealthy components ===
ad-config-provider-docker, ad-config-provider-kubernetes, ad-dockerprovider, ad-kubeletlistener, ad-servicelistening, aggregator, collector-queue, dogstatsd-main, forwarder, logs-agent, metadata-agent_checks, metadata-host, metadata-resources, tagger, tagger-docker
Error: found 15 unhealthy components
  Normal  Killing  15m (x91 over 3d20h)  kubelet, gke-harness-pool-yin-2f5f1c84-wtw2  Killing container with id docker://datadog-agent:Container failed liveness probe.. Container will be killed and recreated.
Cluster example two:
> kubectl get all

NAME                      READY   STATUS    RESTARTS   AGE
pod/datadog-agent-7nr4m   1/1     Running   10         3d
pod/datadog-agent-8p52s   1/1     Running   3          3d
pod/datadog-agent-9kgpn   1/1     Running   8          3d
pod/datadog-agent-fq5zf   1/1     Running   77         3d
pod/datadog-agent-hhp2n   1/1     Running   67         3d

NAME                           DESIRED   CURRENT   READY   UP-TO-DATE   AVAILABLE   NODE SELECTOR   AGE
daemonset.apps/datadog-agent   5         5         5       5            5           <none>          68d

> kubectl describe pod datadog-agent-fq5zf
...
Events:
  Type     Reason     Age   From                                                     Message
  ----     ------     ----  ----                                                     -------
  Warning  Unhealthy  27m   kubelet, gke-harness-private-default-pool-6921567a-w87h  Liveness probe failed: Could not reach agent: Get https://localhost:5001/agent/status/health: EOF
Make sure the agent is running before requesting the status and contact support if you continue having issues.
Error: Get https://localhost:5001/agent/status/health: EOF
  Warning  Unhealthy  27m (x34 over 3d19h)  kubelet, gke-harness-private-default-pool-6921567a-w87h  Liveness probe failed: Could not reach agent: Get https://localhost:5001/agent/status/health: dial tcp [::1]:5001: connect: connection refused
Make sure the agent is running before requesting the status and contact support if you continue having issues.
Error: Get https://localhost:5001/agent/status/health: dial tcp [::1]:5001: connect: connection refused
  Normal   Pulling    26m (x78 over 3d20h)  kubelet, gke-harness-private-default-pool-6921567a-w87h  pulling image "datadog/agent:latest"
  Normal   Created    26m (x78 over 3d20h)  kubelet, gke-harness-private-default-pool-6921567a-w87h  Created container
  Normal   Started    26m (x78 over 3d20h)  kubelet, gke-harness-private-default-pool-6921567a-w87h  Started container
  Normal   Killing    26m (x31 over 2d9h)   kubelet, gke-harness-private-default-pool-6921567a-w87h  Killing container with id docker://datadog-agent:Container failed liveness probe.. Container will be killed and recreated.
  Normal   Pulled     26m (x78 over 3d20h)  kubelet, gke-harness-private-default-pool-6921567a-w87h  Successfully pulled image "datadog/agent:latest"
  Warning  Unhealthy  26m (x79 over 3d20h)  kubelet, gke-harness-private-default-pool-6921567a-w87h  Liveness probe failed: Agent health: FAIL
=== 1 healthy components ===
healthcheck
=== 15 unhealthy components ===
ad-config-provider-docker, ad-config-provider-kubernetes, ad-dockerprovider, ad-kubeletlistener, ad-servicelistening, aggregator, collector-queue, dogstatsd-main, forwarder, logs-agent, metadata-agent_checks, metadata-host, metadata-resources, tagger, tagger-docker
Error: found 15 unhealthy components
Describe what you expected:
Expected 0 restarts on all pods.
Steps to reproduce the issue:
Run the DaemonSet on any GKE cluster.
Additional environment details (Operating System, Cloud provider, etc):
This behavior happens on any GKE cluster - we use essentially all the defaults (Container-Optimized OS, n1-standard-8, autoscaling, etc.)
 jacob-hd
All 10 comments
Also, for what its worth, our DaemonSet is configured via your documentation like so:
> kubectl get daemonset.apps/datadog-agent -o yaml
apiVersion: apps/v1
kind: DaemonSet
metadata:
annotations:
...
spec:
revisionHistoryLimit: 10
selector:
matchLabels:
app: datadog-agent
template:
metadata:
creationTimestamp: null
labels:
app: datadog-agent
name: datadog-agent
spec:
containers:
- env:
- name: DD_API_KEY
valueFrom:
secretKeyRef:
key: DD_API_KEY
name: datadog-secret
- name: DD_PROCESS_AGENT_ENABLED
value: "true"
- name: DD_LOGS_ENABLED
value: "true"
- name: DD_APM_ENABLED
value: "true"
- name: DD_APM_NON_LOCAL_TRAFFIC
value: "true"
- name: DD_CHECKS_TAG_CARDINALITY
value: orchestrator
- name: DD_LOGS_CONFIG_CONTAINER_COLLECT_ALL
value: "true"
- name: DD_APM_IGNORE_RESOURCES
value: GET .*(health|ready),GET /api/liveness,GET status.*
- name: DD_AC_EXCLUDE
value: <REDACTED>
- name: DD_APM_ANALYZED_SPANS
value: <REDACTED>
- name: DD_KUBERNETES_KUBELET_HOST
valueFrom:
fieldRef:
apiVersion: v1
fieldPath: status.hostIP
- name: DD_COLLECT_KUBERNETES_EVENTS
value: "true"
- name: DD_LEADER_ELECTION
value: "true"
- name: KUBERNETES
value: "true"
image: datadog/agent:latest
imagePullPolicy: Always
livenessProbe:
exec:
command:
- ./probe.sh
failureThreshold: 3
initialDelaySeconds: 15
periodSeconds: 5
successThreshold: 1
timeoutSeconds: 1
name: datadog-agent
ports:
- containerPort: 8125
hostPort: 8125
name: dogstatsdport
protocol: UDP
- containerPort: 8126
hostPort: 8126
name: traceport
protocol: TCP
resources:
limits:
cpu: 200m
memory: 256Mi
requests:
cpu: 200m
memory: 256Mi
terminationMessagePath: /dev/termination-log
terminationMessagePolicy: File
volumeMounts:
- mountPath: /var/run/docker.sock
name: dockersocket
- mountPath: /host/proc
name: procdir
readOnly: true
- mountPath: /host/sys/fs/cgroup
name: cgroups
readOnly: true
dnsPolicy: ClusterFirst
restartPolicy: Always
schedulerName: default-scheduler
securityContext: {}
serviceAccount: datadog-agent
serviceAccountName: datadog-agent
terminationGracePeriodSeconds: 30
volumes:
- hostPath:
path: /var/run/docker.sock
type: ""
name: dockersocket
- hostPath:
path: /proc
type: ""
name: procdir
- hostPath:
path: /sys/fs/cgroup
type: ""
name: cgroups
updateStrategy:
rollingUpdate:
maxUnavailable: 1
type: OnDelete
status:
currentNumberScheduled: 11
desiredNumberScheduled: 11
numberAvailable: 11
numberMisscheduled: 0
numberReady: 11
observedGeneration: 66
Not really sure what I'm looking for logs-wise, but this might be helpful:
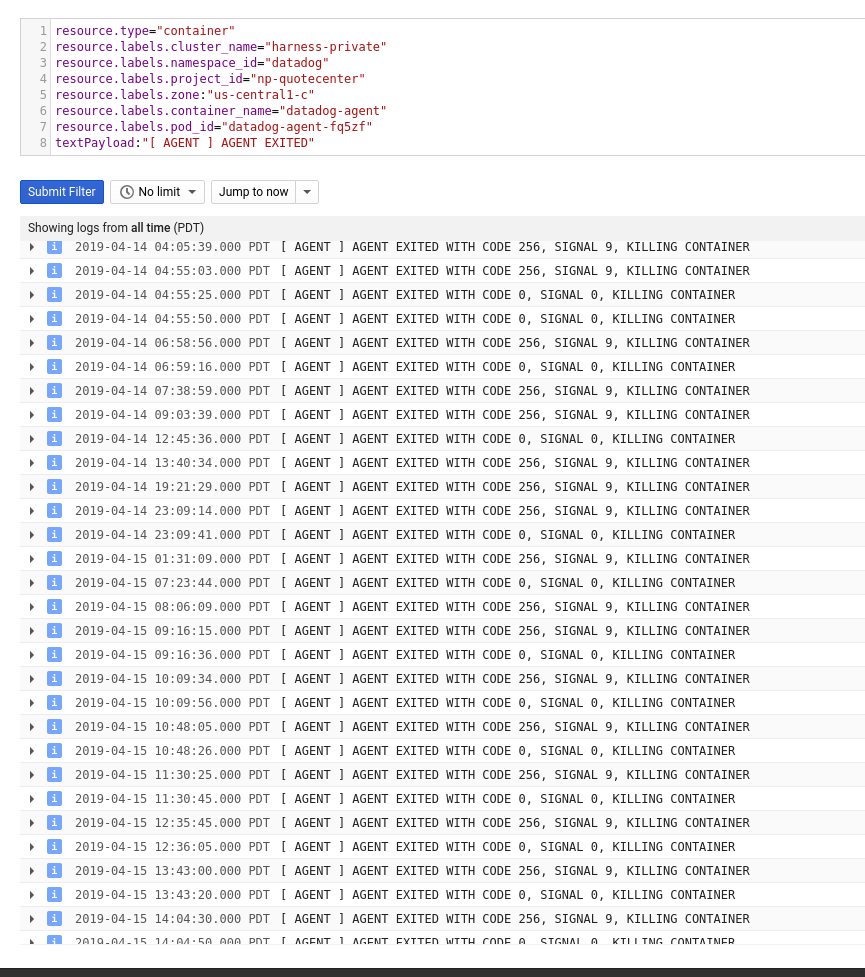
Let me know if I can alter this query in any way to help get insight from pod logs.
jacob-hd
on 16 Apr 2019
Hey @jacob-hd ,
Thanks for reaching out here and for the details. At first glance, I'm not seeing anything that would cause the agent to be killed and restarted. Firstly, could you try allowing some leniency within the liveness probe? Possibly increasing initialDelaySeconds and timeoutSeconds? If this doesn't fix things, are there any events that might shine some more light into this in your Event Stream - possibly queryingOOM or KILL under Docker or Kubernetes events for these particular nodes or the agent image name?
I'd advise opening a new support ticket with a flare attached if you haven't already so our team can start investigating. Thanks!
 DylanLovesCoffee
on 16 Apr 2019
DylanLovesCoffee
on 16 Apr 2019
Opened ticket:
https://help.datadoghq.com/hc/en-us/requests/217384
...but the flare failed:
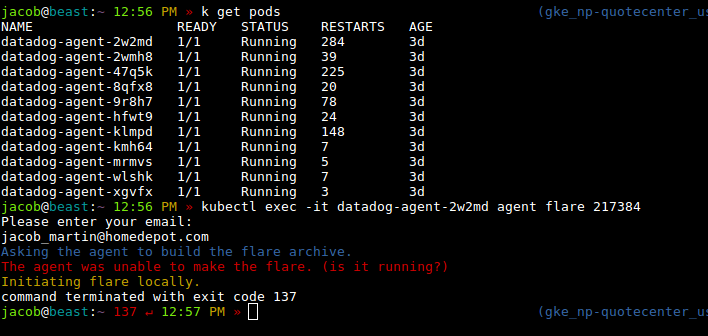
jacob-hd
on 16 Apr 2019
Thanks for opening the ticket! It's likely failing due to the high number restarts and we're catching the container when it's down. We can attempt to send a flare from an agent that's not restarting as frequently, or disabling liveness probe altogether so a flare can be sent. If we do the latter, we'll want to make sure that we enable liveness probe once again or else the container won't be restarted when it's unhealthy.
DylanLovesCoffee
on 16 Apr 2019
We also got the OOM event, we had to crank up the memory from default 256Mi to 512Mi to get it to stop restarting (running DaemonSet Agent in AWS EKS).
resources:
    requests:
      cpu: 200m
      memory: 512Mi
    limits:
      cpu: 200m
      memory: 512Mi
 softstuff
on 23 May 2019
softstuff
on 23 May 2019
+1
 savithruml
on 28 Jun 2019
savithruml
on 28 Jun 2019
this fix to me:
livenessProbe:
exec:
command:
- ./probe.sh
failureThreshold: 3
initialDelaySeconds: 30
periodSeconds: 5
successThreshold: 1
timeoutSeconds: 5
resources:
limits:
cpu: 200m
memory: 512Mi
requests:
cpu: 200m
memory: 256Mi
 thiagolsfortunato
on 4 Mar 2020
thiagolsfortunato
on 4 Mar 2020
The memory and CPU limits will likely vary depending on the size of your clusters and what processes are enabled on the agent (log collection, traces, etc). I'd recommend playing with those values if you're seeing the agent pod get terminated with a reason OOM or Error (can be checked with a kubectl describe <pod>. Closing this one out, but happy to investigate specific cases via a support ticket.
DylanLovesCoffee
on 2 Apr 2020
@softstuff we had to increase memory requirements too - wondering why the agent uses so much memory?
We are running default collections.
 benileo
on 6 May 2020
benileo
on 6 May 2020
Related issues
 oussemos
·
5Comments
oussemos
·
5Comments
 ralmsdeveloper
·
4Comments
ralmsdeveloper
·
4Comments
 agosto-calvinbehling
·
3Comments
agosto-calvinbehling
·
3Comments
 pvalsecc
·
5Comments
pvalsecc
·
5Comments
 amlwwalker
·
5Comments
amlwwalker
·
5Comments
Most helpful comment
We also got the OOM event, we had to crank up the memory from default 256Mi to 512Mi to get it to stop restarting (running DaemonSet Agent in AWS EKS).
resources:
    requests:
      cpu: 200m
      memory: 512Mi
    limits:
      cpu: 200m
      memory: 512Mi