Dask-cuda: [PTDS] Different memory allocation/free behavior with increased threads per worker
I am profiling FFT operations using 2 and 4 threads per worker with PTDS enabled (#517), and am interested in the behavior surrounding CUDA API calls to cudaFree. My code:
import cupy
import dask.array as da
import nvtx
import rmm
from dask.distributed import Client, wait
from dask_cuda import LocalCUDACluster

def main():

    cluster = LocalCUDACluster(n_workers=2, threads_per_worker=2, rmm_pool_size="15GB") # threads_per_worker=4
    client = Client(cluster)
    client.run(cupy.cuda.set_allocator, rmm.rmm_cupy_allocator)

    rs = da.random.RandomState(RandomState=cupy.random.RandomState)
    x = rs.random(size=(10000, 10000), chunks=(1000, 10000))

    with nvtx.annotate("fft op", color="purple"):
        da.fft.fft(x).compute()

if __name__ == "__main__":
    main()
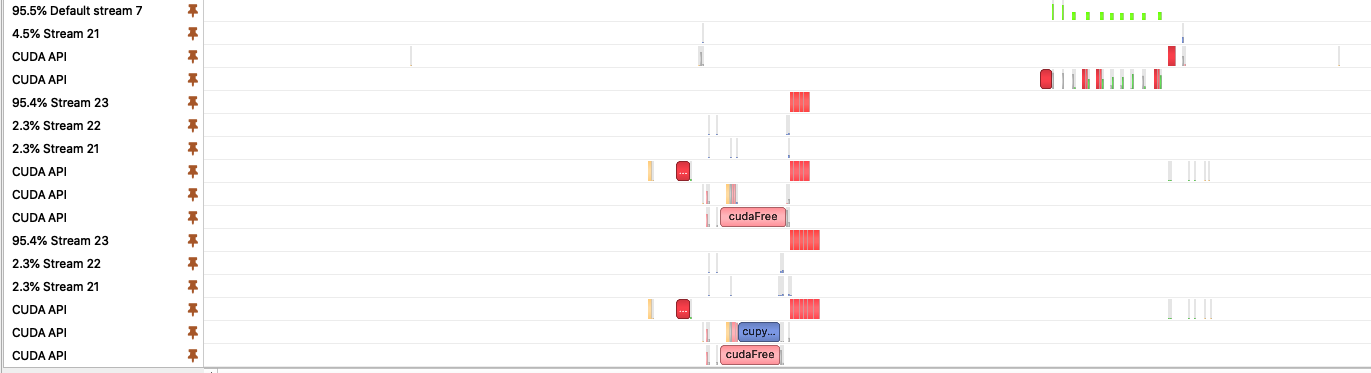
nsys profile (focusing on streams and CUDA API calls) for 2 threads per worker:
4 threads per worker:
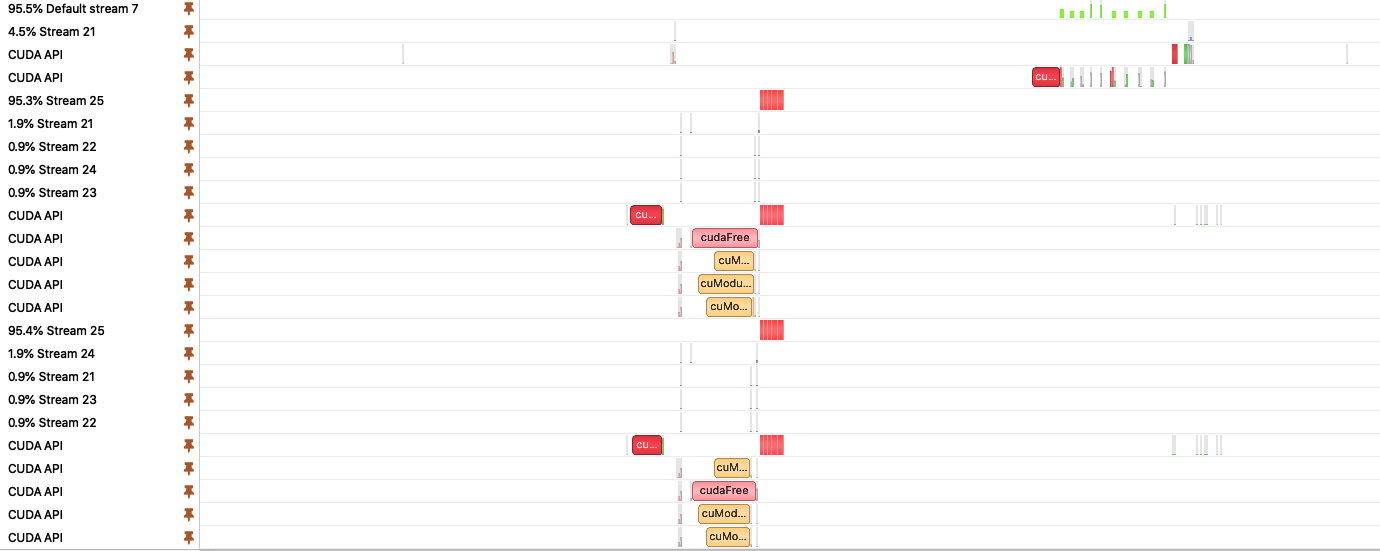
Some questions:
- Why is
cuModuleLoadData(gold) called by N-1 of the threads' default streams during the bigcudaFreecall, and why does this take much longer with 4 threads than 2? - Regardless of thread count, there are some additional small memory allocations/frees that are called before the script terminates - does this have something to do with clean up? (some screenshots of this happening with 4 threads)


cc @quasiben
 charlesbluca
All 22 comments
cudaFree(0) is a common operation to be run at the beginning of an application to ensure the CUDA context is initialized, and that is a normal but time consuming operation. You can ignore that beginning because it's going to be part of every CUDA application.
The memory allocations at the end are probably part of cuFFT internal management. If you zoom in more, you'll be able to see what those kernels are called to give you a hint of where exactly they're coming from, and hopefully investigate from that point. Some CUDA libraries may have internal management (e.g., for the creation of a cuFFT plan) that requires synchronicity to other streams, so they end up executing on the default stream. I believe it could be a similar case with memory management, they need some internal memory that cannot be allocated via RMM/CuPy memory manager simply because that library won't know of their existence.
 pentschev
on 18 Feb 2021
pentschev
on 18 Feb 2021
With RMM enabled should we still expect the cuFF memory allocation ?
 quasiben
on 18 Feb 2021
quasiben
on 18 Feb 2021
With RMM enabled should we still expect the cuFF memory allocation ?
As I said above, if this is internal cuFFT management, yes, it doesn't know of RMM. I'm not saying that is indeed what's happening, it would require taking a better look at what those kernels really are.
pentschev
on 18 Feb 2021
The thread these memory allocation calls are made from has the initial NVTX trace:

Not sure if that's confirmation that these allocs are for cuFFT management.
Any insights on the cuModuleLoadData calls? With the context that the long cudaFree(0) call is to initialize the CUDA context, I'm interested in why the initializing operations of the other threads look so different between 2 and 4 threads per worker.
charlesbluca
on 19 Feb 2021
Not sure if that's confirmation that these allocs are for cuFFT management.
You would need to zoom in even more and really look at those kernels there, based on their names they may provide us more insight about what they're supposed to be doing.
Any insights on the
cuModuleLoadDatacalls? With the context that the longcudaFree(0)call is to initialize the CUDA context, I'm interested in why the initializing operations of the other threads look so different between 2 and 4 threads per worker.
I'm not sure what you mean by saying it looks so different, to me they're very similar, only the time spent differs. In any case, that step doesn't matter at all in our timings, we don't start our benchmark clocks before initialization has completed.
pentschev
on 19 Feb 2021
Maybe it’s worth calling .persist() on the Dask Array before going into the NVTX block. Perhaps this will address the points Peter raised (though feel free to correct me Peter)
 jakirkham
on 19 Feb 2021
jakirkham
on 19 Feb 2021
Also may be worth .persist() on the result in the NVTX block instead of .compute() and then using distributed.wait(...) on the persisted result. This should avoid sending the result back to the Client, which may effect the benchmark due to the associated communication overhead
jakirkham
on 19 Feb 2021
That's a very good point John. The call to compute() above brings the result back to the client process. The RMM pool is only set for the cluster (i.e., workers), thus when result is brought back to the client, memory to hold that must be allocated. Calling persist() instead (as John mentioned above) will most likely resolve that, and that's generally the way Dask is used with GPUs.
I noticed the reason why @charlesbluca was possibly misled into using compute() is due to its use in https://github.com/rapidsai/dask-cuda/blob/branch-0.19/dask_cuda/benchmarks/local_cupy.py, I'll file a PR shortly to fix that.
pentschev
on 19 Feb 2021
I opened #537 to fix what I mentioned just above.
pentschev
on 19 Feb 2021
Thanks for the advice @jakirkham and @pentschev, I will try this out with wait(...) + persist() and check out the profiles.
You would need to zoom in even more and really look at those kernels there, based on their names they may provide us more insight about what they're supposed to be doing.
Checking the kernel launches around and after the memory allocation, they are calls to cupy_copy__complex128_complex128.
I'm not sure what you mean by saying it looks so different, to me they're very similar, only the time spent differs. In any case, that step doesn't matter at all in our timings, we don't start our benchmark clocks before initialization has completed.
I was focused on the difference in time spent, but it's good to know those steps aren't too important within the benchmarking process.
charlesbluca
on 19 Feb 2021
After making some adjustments, I'm now trying out benchmarks using a CUDA cluster with NVLink enabled, and a larger RMM pool size:
 cluster = LocalCUDACluster(local_directory="/raid/charlesb/tmp/dask",
      n_workers=2,
      threads_per_worker=2,
      protocol="ucx",
      interface=interface,
      enable_tcp_over_ucx=True,
      enable_infiniband=False,
      enable_nvlink=True,
      rmm_pool_size="30GB"
      )
After switching to wait(...) and persist(), it looks like we no longer have the memory allocations associated with fetching the result to client:

I'm going to check out other operations to see if there are other cases of internal management executing on default stream.
charlesbluca
on 19 Feb 2021
It might also be worth trying some very simple things where we don't have to worry as much about how other libraries allocate or manage memory (referring to cuFFT plan creation for example). Maybe something like doing a.sum(axis=0) where the shape and chunk sizes for axis 0 are the same, but the chunking along another axis 1 is some fraction of the length of that axis. This should give us something where we are parallelizing summation (without worrying about tree reductions across chunks) and hopefully give us a clearer idea if things are working. Though if there are other reasons we are interested in FFTs or if this is something you have already tried, please ignore.
jakirkham
on 20 Feb 2021
Good suggestion! Tried this out with 3.2 GB arrays with 4 chunks along axis 1 with 2 threads per worker:

And 4 threads per workers:

In both cases, the workers only had 2 threads each.
Talking to @quasiben earlier, he thought it could be interesting to check out if any operations have internal management that leads to execution on the default stream - I did some profiles related to that as well, and actually didn't see this occur with FFT, which may indicate that the execution on default stream from before was the result of me calling compute().
charlesbluca
on 20 Feb 2021
Thanks for testing that out. Looks nice! Curious what the load/unload things are doing. Loading compiled CUDA kernels?
Yeah that makes sense. We currently synchronize on the default stream before sending/receiving data with UCX, which would come up with .compute() as the result would be shipped back to the Client. IDK if this is something Peter played with changing in the PTDS work
jakirkham
on 20 Feb 2021
I'm also interested in the module load/unloads, as it seems to result in staggered calls to cupy_sum_with_dtype with 2 threads per worker but not 4.
After profiling several operations with 2 threads per worker using NVLink, I found that a few still had some host-device transfers, mostly near the beginning and end of the operations; some examples of this:


SVD had these transfers take place in the middle of the operation:

There were also some device-device transfers, although that might be more expected:


Finally, I noticed that for a majority of the operations, the streams weren't taking on tasks evenly - usually, one stream would handle 60-80%, with the remaining stream(s) handling the remainder (with some exclusively handling device-host transfers). Based on this, and with the knowledge that some operations might have better performance at high thread counts with smaller chunk sizes, I will begin profiling smaller chunk sizes + higher thread counts to see if I can draw any conclusions relating to performance.
charlesbluca
on 22 Feb 2021
I'm also interested in the module load/unloads, as it seems to result in staggered calls to cupy_sum_with_dtype with 2 threads per worker but not 4.
Module load/unload is used by CuPy to load cached kernels. This is why it's recommended to have a "warmup run" with CuPy before any benchmark. In our benchmarks I usually ignore the first run, as it's noticeably lengthier than all others, because that's when CuPy loads/compiles kernels, UCX maps memory between processes, etc.
After profiling several operations with 2 threads per worker using NVLink, I found that a few still had some host-device transfers, mostly near the beginning and end of the operations; some examples of this:
This is expected, NVLink is slower than transferring over PCIe for very small sizes, which is in the range of 16KB/32KB IIRC. This can be controlled by UCX_RNDV_THRESH, but we can usually rely on UCX's default.
There were also some device-device transfers, although that might be more expected:
PtoP means between two devices, which is very much expected with Dask.
Finally, I noticed that for a majority of the operations, the streams weren't taking on tasks evenly - usually, one stream would handle 60-80%, with the remaining stream(s) handling the remainder (with some exclusively handling device-host transfers).
This is influenced by how Dask balances the workload. Each thread is a Dask worker in this case, thus a stream has 1<->1 mapping to a Dask thread. A better balancing can only be achieved by improving how Dask balances its work, which is probably not straightforward to control (if not even undesirable). Also note that having too many streams is unlikely to have any effect on GPU parallelism since the GPU is also limited by physical resources (registers, shared memory, CUDA cores, etc.). When one of the GPU resources is at its maximum, the driver can't have more kernels being processed on the same GPU until one of the running kernels finishes. In this case, it may still be that we get some better performance because there's scheduling work on the CPU happening for other threads (workers), but not because of concurrent work on the GPU.
Also notice that a GPU can have 3 operations overlapping at the exact same time (see How to Overlap Data Transfers in CUDA C/C++
for more details and nice images), as long as each is on a different stream:
- Host-to-Device copy;
- Kernel(s) execution (limited to the available GPU resources);
- Device-to-Host copy.
I'm not sure if P2P can overlap with all those above or if they're treated as H2D/D2D.
pentschev
on 23 Feb 2021
Thanks for sharing that resource! I will adjust my scripts to do a second run after the "warm up" so we can see how module load/unloads and ucxpy traces look. Good to know about UCX_RNDV_THRESH - I'll stick with the default for now, but that could be something interesting to play around with in the future. I'll also check out Dask performance reports of these runs if we want to know more about how and why the tasks are being distributed across threads.
Each thread is a Dask worker in this case, thus a stream has 1<->1 mapping to a Dask thread.
For some operations (sum, SVD), this didn't seem to be the case - there were more streams than threads, typically used for transfers. Is it safe to say that each Dask thread has a distinct "working" stream (for primarily computational kernel calls), and then they might share additional streams for communication?
charlesbluca
on 23 Feb 2021
For some operations (sum, SVD), this didn't seem to be the case - there were more streams than threads, typically used for transfers. Is it safe to say that each Dask thread has a distinct "working" stream (for primarily computational kernel calls), and then they might share additional streams for communication?
Dask actually has a different thread to do communication, thus enabling PTDS implies a new stream for that.
pentschev
on 23 Feb 2021
Does UCX have its own streams as well?
jakirkham
on 23 Feb 2021
Does UCX have its own streams as well?
Well reminded, yes, it does too, However, only for CUDA IPC (NVLink). By default it has a maximum of 16 streams, configurable by UCX_CUDA_IPC_MAX_STREAMS.
pentschev
on 23 Feb 2021
This issue has been labeled inactive-30d due to no recent activity in the past 30 days. Please close this issue if no further response or action is needed. Otherwise, please respond with a comment indicating any updates or changes to the original issue and/or confirm this issue still needs to be addressed. This issue will be labeled inactive-90d if there is no activity in the next 60 days.
![github-actions[bot] picture](https://avatars.githubusercontent.com/in/15368?v=4&s=40) github-actions[bot]
on 25 Mar 2021
github-actions[bot]
on 25 Mar 2021
I'm going to close this, as we've generally kept discussion around the benchmarks consolidated in #517.
charlesbluca
on 26 Mar 2021
Related issues
jakirkham
·
11Comments
 daxiongshu
·
7Comments
quasiben
·
7Comments
charlesbluca
·
3Comments
daxiongshu
·
7Comments
quasiben
·
7Comments
charlesbluca
·
3Comments
 beckernick
·
10Comments
beckernick
·
10Comments
Most helpful comment
Module load/unload is used by CuPy to load cached kernels. This is why it's recommended to have a "warmup run" with CuPy before any benchmark. In our benchmarks I usually ignore the first run, as it's noticeably lengthier than all others, because that's when CuPy loads/compiles kernels, UCX maps memory between processes, etc.
This is expected, NVLink is slower than transferring over PCIe for very small sizes, which is in the range of 16KB/32KB IIRC. This can be controlled by
UCX_RNDV_THRESH, but we can usually rely on UCX's default.PtoP means between two devices, which is very much expected with Dask.
This is influenced by how Dask balances the workload. Each thread is a Dask worker in this case, thus a stream has 1<->1 mapping to a Dask thread. A better balancing can only be achieved by improving how Dask balances its work, which is probably not straightforward to control (if not even undesirable). Also note that having too many streams is unlikely to have any effect on GPU parallelism since the GPU is also limited by physical resources (registers, shared memory, CUDA cores, etc.). When one of the GPU resources is at its maximum, the driver can't have more kernels being processed on the same GPU until one of the running kernels finishes. In this case, it may still be that we get some better performance because there's scheduling work on the CPU happening for other threads (workers), but not because of concurrent work on the GPU.
Also notice that a GPU can have 3 operations overlapping at the exact same time (see How to Overlap Data Transfers in CUDA C/C++
for more details and nice images), as long as each is on a different stream:
I'm not sure if P2P can overlap with all those above or if they're treated as H2D/D2D.