With https://github.com/cupy/cupy/pull/4322 merged in we can begin profiling/benchmarking performance of more workers per GPU.
Setup
- Build latest cupy
python -m pip install . - CUPY_CUDA_PER_THREAD_DEFAULT_STREAM=1 dask-cuda-worker --nthreads=2
- Use at least 4 GPUs
- test
nthreads: 1, 2, 4, 8, 32`
Test Operations
- sum
- mean
- svd
- Matrix Multiply
- Array Slicing
- transpose + sum: (x + x.T).sum()
Note @pentschev previously tested these operations on a single GPU:
- https://github.com/pentschev/pybench/blob/89d65a6c418a1fee39d447bd11b8a999835b74a9/pybench/benchmarks/benchmark_array.py
- https://github.com/pentschev/pybench/blob/master/examples/plot_array_example.ipynb
Example of CuPy with Dask
import cupy
import dask.array as da

rs = da.random.RandomState(RandomState=cupy.random.RandomState)
x = rs.normal(10, 1, size=(500000, 500000), chunks=(10000, 10000))
x.sum().compute()
cc @charlesbluca
 quasiben
All 53 comments
We've also used adding a matrix with it's transpose as a communication benchmark. Could be reasonable here to show the communication overhead goes to 0 while still computing work in parallel
 jakirkham
on 8 Feb 2021
jakirkham
on 8 Feb 2021
That's a good idea @jakirkham . I updated the test operations
quasiben
on 8 Feb 2021
Thanks for writing this up @quasiben!
Some questions:
- Would this benchmark be better suited as a reproducible script, a one-off notebook with some plots to reflect the results, or both? Seems like it might be leaning towards notebook since the number of GPUs is flexible.
- Could pybench be applicable in any way towards putting this together, or does it serve as more of an example in implementing the tests?
 charlesbluca
on 9 Feb 2021
charlesbluca
on 9 Feb 2021
Would this benchmark be better suited as a reproducible script, a one-off notebook with some plots to reflect the results, or both? Seems like it might be leaning towards notebook since the number of GPUs is flexible.
Generally, yes! Some of these operations are already built in here:
https://github.com/rapidsai/dask-cuda/blob/branch-0.18/dask_cuda/benchmarks/local_cupy.py
Could pybench be applicable in any way towards putting this together, or does it serve as more of an example in implementing the tests?
Probably. Extending pybench seems like a reasonable way to automate running many of these operations. Much of the tests in the dask-cuda benchmark suite have nice output for testing a set of parameters be we don't have additional tooling for varying those parameters automatically. This would be very beneficial especially if plotting was also automated!
I also think doing a bit of a dive on some of these operations with a manual setup would be useful. We could use tools like pynvtx and confirm kernels are launching on multiple threads.
quasiben
on 9 Feb 2021
After touching base with @pentschev, I think it may be easier to extend local_cupy.py with the additional test operations we want since it already takes in GPU count and nthreads as input - although I'm not too sure how to go about parametrizing the tests with pytest-benchmark.
For plotting pybench already has some tools for that, although @pentschev mentioned the process of generating the plots in his example notebook took some toil, so not sure how easy it would be to automate for wider use cases. I think a good start for now would be outputting benchmarking results in JSON that could be parsed by pybench's plotting utils, which could either be done:
- Somewhere in the implementation of
local_cupy.py - By pytest-benchmark using the
--benchmark-json=PATHoption
charlesbluca
on 9 Feb 2021
Made a fork with some additional operations for testing and an argument to output JSON of the results:
Some more thought may need to go into device sync and warm up as in pybench, but for now I'll try this out and see if there are noticeable results.
charlesbluca
on 11 Feb 2021
Looks great, when you're ready, be sure to open a PR! 😄
 pentschev
on 12 Feb 2021
pentschev
on 12 Feb 2021
Done! #524
From benchmarks using 4 GPUs and 1, 2, 4, 8 threads, there wasn't been a remarkable difference in performance; a plot of these results:
I'm going to scale back the number of GPUs and check out what the Nsys profile and Dask performance reports look like.
charlesbluca
on 12 Feb 2021
Interesting. It might be worth comparing notes with Peter to make sure things are configured correctly.
Couple questions. Were you able to see multiple streams in use ( https://github.com/cupy/cupy/pull/4322#issuecomment-733648815 )? Also are using the changes from PR ( https://github.com/cupy/cupy/pull/4322 ) (note this is not in a CuPy release yet)?
jakirkham
on 12 Feb 2021
IIRC, I was only able to see significant difference on transpose sum, and besides the CuPy PTDS support, I also needed https://github.com/rapidsai/rmm/pull/633 _and_ UCX. Could you try those out as well @charlesbluca ?
pentschev
on 12 Feb 2021
Sure! I'll run the benchmarks again and see how it looks.
charlesbluca
on 12 Feb 2021
It turns out the initial runs I did on TCP didn't have CUPY_CUDA_PER_THREAD_DEFAULT_STREAM=1 set - I ran both TCP and UCX tests again after fixing that and the results are significantly different:
In particular, it looks like mean, sum, and transpose sum have some noticeable speed up. Some observations:
- It looks like most speed up tends to plateau at 2-4 threads, either running at the same speed when bumping up to 8 threads per worker or slower.
- Mean on UCX runs slower at 8 threads than 4, while it generally stays the same on TCP for this jump
- The same can be observed in reverse when looking at sum.
- For some operations, TCP is faster than UCX (sum using 4 threads); not sure if this is an unexpected result.
charlesbluca
on 12 Feb 2021
It might be worth creating larger data and/or using smaller chunks to see if this continues to hold up.
jakirkham
on 12 Feb 2021
I forgot to mention, for UCX you should pass also --ucx-net-devices auto when running on a DGX-1. This will ensure each GPU utilizes the correct InfiniBand interface, which dramatically changes results for the right type of transfers. Could you also try running with that argument @charlesbluca ?
pentschev
on 12 Feb 2021
Sure! Currently running them now - I'll update the notebook once it finishes.
I'll also play around with array/chunk size, any insight on how the size of the second array in SVD should scale?
Also are there any good examples of comparative bar plots that have more than one independent variable? I'm trying to think about the best way to show the impact of changing array size and thread count in one plot.
charlesbluca
on 13 Feb 2021
Updated the notebook; looks like the main difference with auto is that mean generally scales better, and slice runs faster regardless of thread count.
charlesbluca
on 13 Feb 2021
@charlesbluca as we discussed on our standup meeting last Friday, we also need to ensure UCX synchronizes on PTDS-only, rather than the default stream. Sorry for forgetting about this earlier, but could you try running the UCX benchmarks again with https://github.com/pentschev/distributed/tree/ptds-support ?
pentschev
on 15 Feb 2021
Sure! Do I have to specify any options in the Dask configuration?
charlesbluca
on 16 Feb 2021
No, right now it will rely on your environment variables: https://github.com/pentschev/distributed/blob/c1cf54c6fc584efbc423ad0b49608817deb08d88/distributed/comm/ucx.py#L46-L49
We may change that in the future though.
pentschev
on 16 Feb 2021
Thanks for the clarification! Right now, I am trying out some different parameters for array/chunk size; currently, I'm thinking for a holistic test of any single operation, we should try:
Array sizes (may need some smaller sizes to run for array multiplication):
- 20,000
- 40,000
- 80,000
Chunk sizes:
- 1/8 of array size (64 chunks)
- 1/4 of array size (16 chunks)
- 1/2 of array size (4 chunks)
Second size (SVD only)
- 10% of array size
- 20% of array size
- 40% of array size
We could also play around with GPU count to see if that has discernible impact.
charlesbluca
on 16 Feb 2021
I ended up using this testing suite for one operation (sum) and got some pretty strange results:
In particular, we can see that the results aren't consistent with what was observed before with array/chunk size 40,000/10,000 - not sure if this is related to running all of these tests in short succession. For reference, here are the Dask profiles for this operation with 1 and 2 threads per worker (2 threads should be faster but was not):
charlesbluca
on 16 Feb 2021
It looks like the results from before had something to do with generating the Dask performance report - removing that argument gave me results similar to the earliest benchmarks:
Playing around with array/chunk size, some interesting observations:
- The overall array size seems to have an impact on what thread count is optimal - this can be seen when comparing the 20000/5000, 40000/10000, and 80000/20000 runs.
- The smallest chunk size (64 chunks) had the best scaling performance, seeing improvements up to 16-32 threads per worker in all cases.
- The largest chunk size (4 chunks) saw no improvement from increased thread count.
I'm interested in if the smaller chunk size / larger thread count would continue scaling, although it might be impractical to have more than 32 threads per worker.
charlesbluca
on 17 Feb 2021
I think the different results when generating performance reports could have something to do with device synchronization not being done:
Is there any reason device sync isn't being done when we opt for a performance report?
charlesbluca
on 17 Feb 2021
I don't think so. Sounds like a bug (thanks for finding that btw 😄). Would you like to submit a PR?
jakirkham
on 17 Feb 2021
As John mentioned, this is indeed a bug. Could you submit a PR for that when you have a chance?
pentschev
on 17 Feb 2021
Looks like this is PR ( https://github.com/rapidsai/dask-cuda/pull/533 )
jakirkham
on 17 Feb 2021
Generated some plots of a couple operations using fixed 10000 size arrays, but varying chunk size and thread count:
It looks like mean, sum, and transpose sum see some performance boosts with smaller chunk sizes and high thread counts, while dot product and array slicing seem to suffer from the smaller chunk size, and see better performance with a larger chunk size and smaller thread count.
From here, I will profile this suite of operations and check out how these factors impact the way tasks are divided among streams.
charlesbluca
on 22 Feb 2021
Yeah I think that basically makes sense. To summarize we need the number of chunks along a dimension to be large enough to saturate the available streams to see a performance improvement.
jakirkham
on 23 Feb 2021
After doing some profiling with size 10000 arrays with varying chunk sizes on 2 devices, some observations:
Summary:
- Sum and mean seem to perform best when # of chunks = # of total worker threads
- FFT and array slicing don't seem to rely much on concurrent streams - might be better with big chunk size + 1 thread per worker
- SVD and dot product both have a lot of host-device communication with small chunk sizes, faster to keep a large chunk size with less threads
- SVD runs more computational kernels on one device than the other(s)
- Transpose sum also had a lot of host-device communication but was faster with small chunk sizes, worked similarly well with 1-4 threads per worker but not as well past that
As in the above plots, mean and sum seem to have the most substantial performance boosts when using small chunks (in my case, 64) and large thread per worker (TPW) counts (32). This produces a lot of UCX communication which takes up a majority of the operation time:
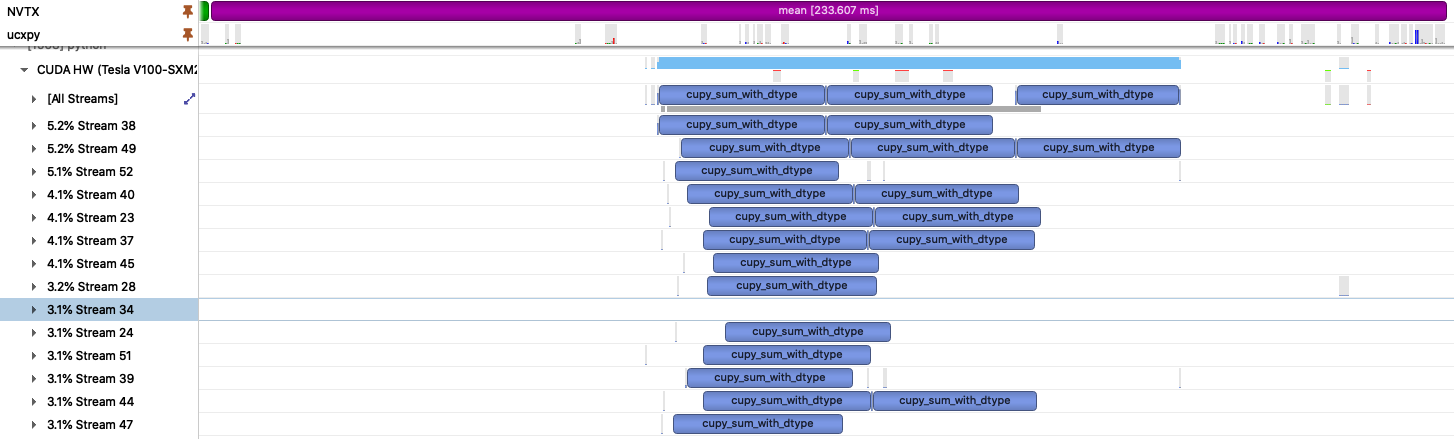
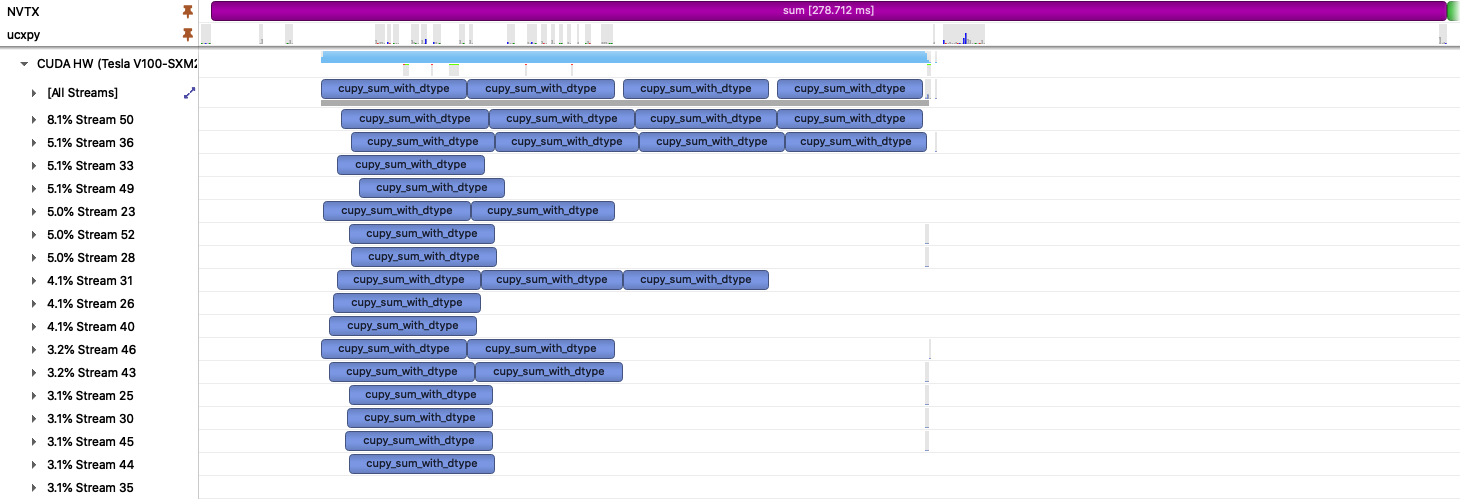
It seems like an ideal ratio of chunks to total threads is 1:1 (that is, # chunks = TPW * # devices); if there are more chunks than total threads, we don't see operations running in parallel nearly as much, and if there are more threads than chunks, we see several streams are generally unused for the majority of the operation.
Other operations, like FFT and array slicing, don't seem to have much impact from scaling TPW; in the case of FFT, this seems to be because kernels are not running in parallel on stream (4 and 8 TPW, with 16 and 64 chunks, respectively):


While array slicing seems to primarily rely upon UCX communication, with seemingly nothing happening in the streams during the operation:

In both cases, I found that a large chunk size and 1 TPW had the best performance (though I'm not really sure if TPW matters much for slicing here).
For dot product and SVD, a smaller chunk size results in more host-device communication that runs slower on with low TPW (64 chunks, 1 TPW):


In both cases, setting a higher TPW (8 or 16) improved performance, but in general it was faster to use a large chunk size with 1 TPW (4 chunks), which significantly reduced host-device communication:


I also noticed that SVD tends to run the majority of its computational kernels on one device; not sure how that would change if I tried this on a different number.
Transpose sum also had increased host-device communication with a smaller chunk size, although here I also saw better performance regardless of TPW. It doesn't seem like TPW has a large impact on performance under 8, but at 8 and above it begins to get worse. Not sure if this has to do with the fact that there is a limit of 3 computational kernels running in parallel (4 vs. 8 TPW):


charlesbluca
on 24 Feb 2021
As in the above plots, mean and sum seem to have the most substantial performance boosts when using small chunks (in my case, 64) and large thread per worker (TPW) counts (32). This produces a lot of UCX communication which takes up a majority of the operation time:
How are you reaching the conclusion that UCX communication takes majority of time? To me it seems that UCX is taking small amounts with big gaps, and cupy_sum_with_dtype is in fact taking most of the time.
Other operations, like FFT and array slicing, don't seem to have much impact from scaling TPW; in the case of FFT, this seems to be because kernels are not running in parallel on stream (4 and 8 TPW, with 16 and 64 chunks, respectively):
Not unexpected, FFT kernels will most likely saturate the whole GPU, thus no other kernels can be run concurrently.
While array slicing seems to primarily rely upon UCX communication, with seemingly nothing happening in the streams during the operation:
Seems like not many kernels are executed then, just transferring the slices around.
In both cases, I found that a large chunk size and 1 TPW had the best performance (though I'm not really sure if TPW matters much for slicing here).
If we're bound by communication, it makes sense that less threads per worker (resulting in less communication) will have better performance. Increasing the total number of transfers usually comes with the decrease in each message size, which is often _very_ inefficient.
For dot product and SVD, a smaller chunk size results in more host-device communication that runs slower on with low TPW (64 chunks, 1 TPW):
...
In both cases, setting a higher TPW (8 or 16) improved performance, but in general it was faster to use a large chunk size with 1 TPW (4 chunks), which significantly reduced host-device communication:
Also not unexpected. cuBLAS, cuSOLVER, cuFFT, et al., are usually _very well optimized_ to run as a single-kernel, and usually the larger the data the better.
I also noticed that SVD tends to run the majority of its computational kernels on one device; not sure how that would change if I tried this on a different number.
That's the last step, right? That usually occurs on a graph computation when the last step merges all results together, which is the case for many Dask algorithms, there isn't much we can do other than working on more efficient parallelization (assuming that's possible).
Transpose sum also had increased host-device communication with a smaller chunk size, although here I also saw better performance regardless of TPW. It doesn't seem like TPW has a large impact on performance under 8, but at 8 and above it begins to get worse. Not sure if this has to do with the fact that there is a limit of 3 computational kernels running in parallel (4 vs. 8 TPW):
Seems similar to results I've seen earlier. 3 kernels of those kernels is probably what it takes to saturate the GPU w.r.t. its resources, so we won't gain much going beyond for that reason.
pentschev
on 24 Feb 2021
How are you reaching the conclusion that UCX communication takes majority of time? To me it seems that UCX is taking small amounts with big gaps, and cupy_sum_with_dtype is in fact taking most of the time.
Good point! To revise - UCX (along with host-device) communication is increased with the the smaller chunks / higher threads per worker, and a large part of the operation is spent outside of cupy_sum_with_dtype doing communication.
FFT kernels will most likely saturate the whole GPU
Is there any way I can check the resource usage of kernels (relative to the GPU) in Nsight Systems?
Increasing the total number of transfers usually comes with the decrease in each message size, which is often very inefficient.
UCX is slower for very small files, right? Would it be worth it to try array slicing without UCX to see its performance relying on host-device communication? I imagine this falls out of the scope of PTDS testing.
That's the last step, right?
Not really sure - there are a lot of kernel calls whose functions aren't immediately clear to me, specifically several cuds_*, gem*, labrd_*, ... calls.
charlesbluca
on 25 Feb 2021
That's the last step, right?
Not really sure - there are a lot of kernel calls whose functions aren't immediately clear to me, specifically several
cuds_*,gem*,labrd_*, ... calls.
The last two were originally defined as part of the BLAS and LAPACK APIs. So in this case would be cuBLAS and cuSOLVER IIUC. My guess is the former is something specific to cuSOLVER, but don't recognize it (maybe Peter does).
jakirkham
on 25 Feb 2021
Good point! To revise - UCX (along with host-device) communication is increased with the the smaller chunks / higher threads per worker, and a large part of the operation is spent outside of cupy_sum_with_dtype doing communication.
But in the image you posted that didn't seem to be the case. However, if you have smaller chunks, there will be indeed more chunks be transferred around, so not surprised by that either.
Is there any way I can check the resource usage of kernels (relative to the GPU) in Nsight Systems?
In Nsight Systems, no. You can do that with Nsight Compute, but that would mean profiling each kernel individually, I'm not even sure how we would do that with Dask given it launches thousands of kernels in a single run.
UCX is slower for very small files, right? Would it be worth it to try array slicing without UCX to see its performance relying on host-device communication? I imagine this falls out of the scope of PTDS testing.
I think we don't need to do that. Most of our intended use cases will use UCX to speed up transfers, so I'm not sure how useful it is to know "TCP is slightly faster for this one particular use case".
Not really sure - there are a lot of kernel calls whose functions aren't immediately clear to me, specifically several cuds_, gem, labrd_*, ... calls.
Yes, but I'm asking about your statement "SVD tends to run the majority of its computational kernels on one device", is that majority the last step of the benchmark workflow chronologically? Note that each run will repeat the same steps, so it's probably easier to identify if you run a single time, or if you visually split the entire profile in N (where N in the number of runs) parts where there's a clear repeating pattern.
pentschev
on 25 Feb 2021
I can testify that each SVD call launches many small kernels and incurs a few h2d/d2h transfers. I was working on CuPy's batched SVD support (cupy/cupy#4628, which essentially is a C loop calling gesvd over all matrices), and I was puzzled by the performance I saw, so I also did a quick benchmark. Below the red stripe is 1 gesvd call:
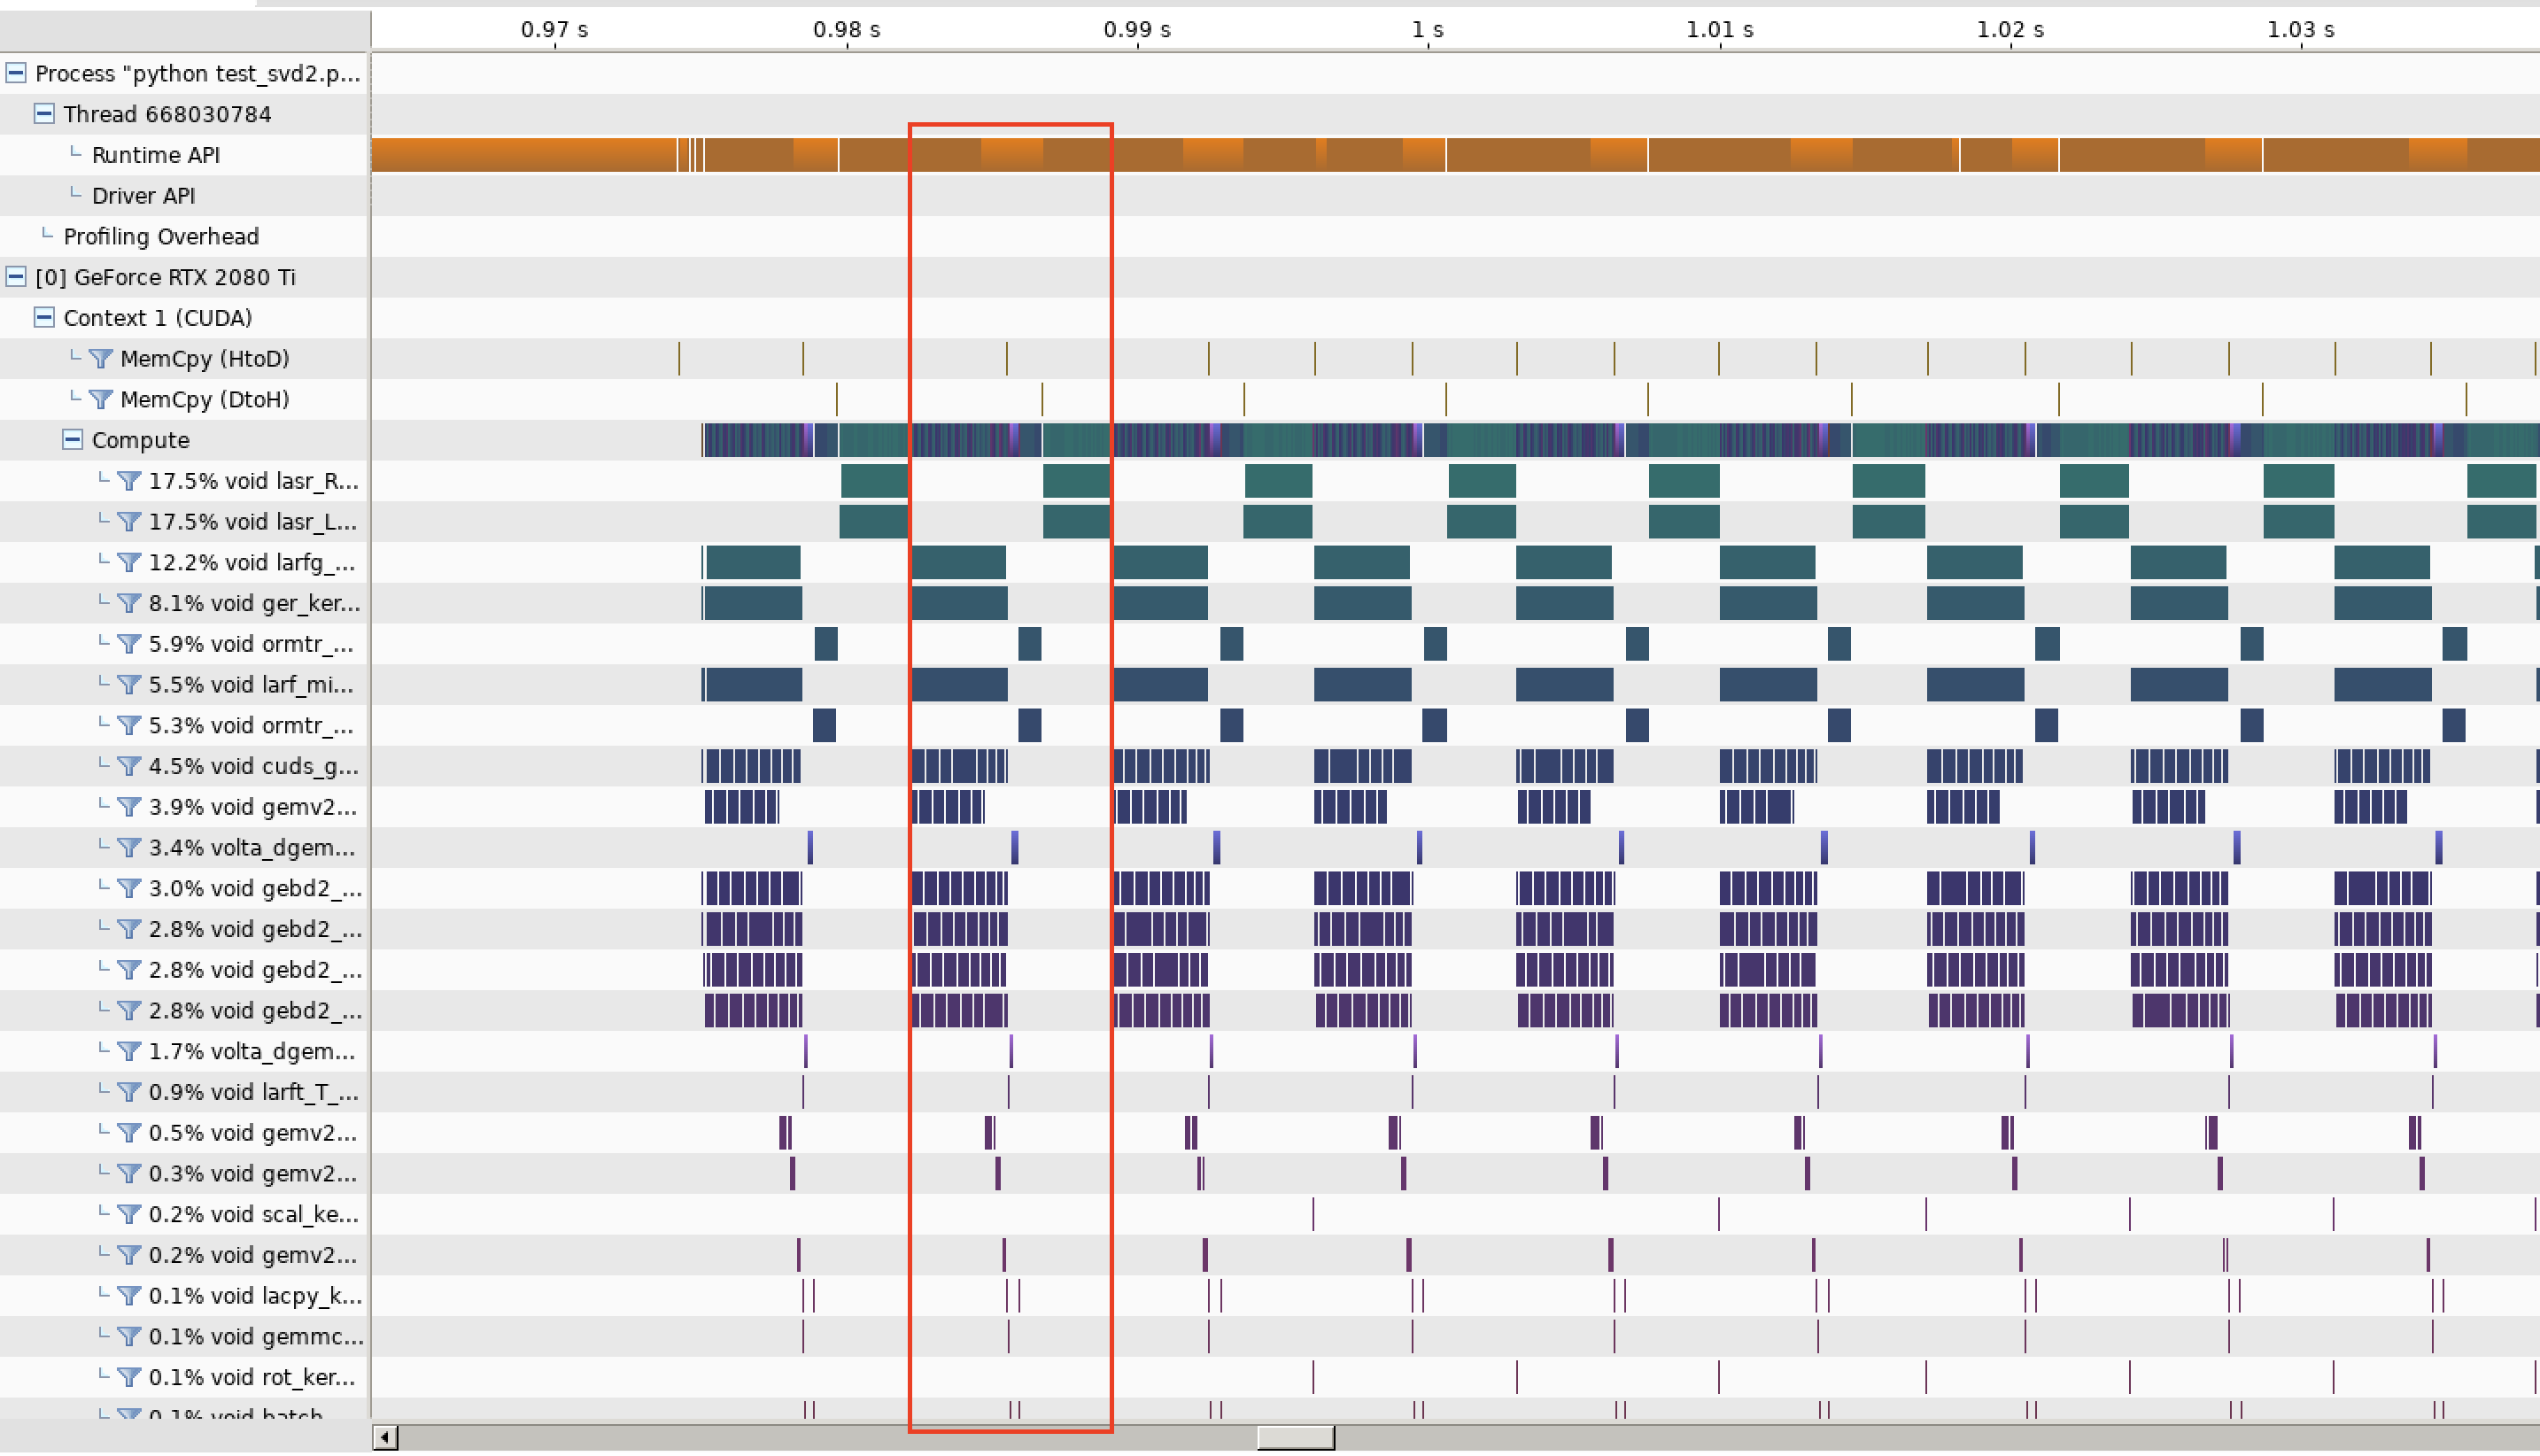
In addition, it's currently not possible to parallelize batched SVD via overlapping streams. When working on cupy/cupy#4731 I tried a small stream pool (only 4 streams) and it slows thing down. From a quick visual I think all kernels are effectively serialized, likely because of lack of hardware resource to overlap these small kernels.
 leofang
on 25 Feb 2021
leofang
on 25 Feb 2021
is that majority the last step of the benchmark workflow chronologically?
Ah I see what you're saying - no, it looks like the computations are sandwiched between some host-device communication executed on both GPUs:

Looks like something is sent to one device, processed in some way, and then a result is sent back? There are some additional calls to cupy_sum_with_dtype in the selected region on one GPU, could that be the merging of results?
Note that each run will repeat the same steps, so it's probably easier to identify if you run a single time, or if you visually split the entire profile in N (where N in the number of runs) parts where there's a clear repeating pattern.
Zooming out to see the behavior of all the SVD runs, it looks like the choice of which GPU will run this series of computations varies, and isn't always the same:

charlesbluca
on 25 Feb 2021
@jakirkham mentioned it would also be interesting to benchmark operations that are more typical to DataFrames. This is to gauge what perf improvements to aim for in those operations. Here are some examples:
import cupy
import dask.array as da

rs = da.random.RandomState(RandomState=cupy.random.RandomState)

col_a = rs.normal(10, 1, size=(500000,), chunks=(10000,))
col_b = rs.normal(10, 1, size=(500000,), chunks=(10000,))
idxs = rs.randint(0, len(col_a), size=(1000000,), chunks=(10000,))

col_a + col_b   # binary operations
col_a[col_b > 0]   # boolean masking
col_a[idxs]  # gather
 shwina
on 8 Mar 2021
shwina
on 8 Mar 2021
FYI: boolean masking is likely not a great use case as it forces synchronization because the output size is dependent on the number of True values.
 kkraus14
on 8 Mar 2021
kkraus14
on 8 Mar 2021
Thanks for the examples @shwina! Currently adding these to the local CuPy benchmark operations, as well as some NVTX annotations which should make them easier to profile.
While working on that, I noticed that the benchmarks don't initialize an RMM pool with the user-specified size, always defaulting to 50% of total GPU memory:
Is this what we want for the benchmarks?
charlesbluca
on 9 Mar 2021
We can do both. Since this is using CuPy and it has its own memory pool, it should work fine either way.
jakirkham
on 9 Mar 2021
We can do both. Since this is using CuPy and it has its own memory pool, it should work fine either way.
We actually replace CuPy's memory pool for these benchmarks: https://github.com/rapidsai/dask-cuda/blob/e72d776645ee3ee7e1672f73c9c043731cf401d5/dask_cuda/benchmarks/utils.py#L251
Is this what we want for the benchmarks?
By default using RMM's default is a good balance, so I'd say yes. You can specify --rmm-pool-size if you want a different size when running.
EDIT: If you're asking about these benchmarks in particular, you can specify 90-95% of the GPU's total memory to prevent any further allocations.
pentschev
on 9 Mar 2021
What I meant to say is that in the benchmark code itself, it looks like --rmm-pool-size is not actually being used when supplied - I think that if that were the case, args.rmm_pool_size would be getting supplied to client.run(setup_memory_pool, ...).
charlesbluca
on 9 Mar 2021
Sounds like a bug. Would you like to do a PR to fix that?
jakirkham
on 9 Mar 2021
Sure! Is it okay if I roll this into a larger PR with the additional operations + NVTX traces?
charlesbluca
on 9 Mar 2021
Sure, I don't think there's much rush for this right. And thanks for catching that @charlesbluca !
pentschev
on 9 Mar 2021
No problem! Opened up PR #548.
charlesbluca
on 9 Mar 2021
Ran some benchmarks with column sum and gather; in general it looks like performance is better with a larger chunk size, though increased threads don't seem to have a consistent impact:


For sum, there is a spike in performance at the largest chunk size

This is surprising to me, as it seems like from the Nsys profiles there aren't too many kernel calls happening here, mostly UCX communication:

charlesbluca
on 15 Mar 2021
It might be worth trying this benchmark without a mask to see how it compares
jakirkham
on 15 Mar 2021
Sure, what would the code look like running this without a mask?
charlesbluca
on 15 Mar 2021
Sorry scratch that
What are the chunk sizes here? How many chunks are we using?
jakirkham
on 15 Mar 2021
Chunk sizes are 31250, 62500, 125000, and 250000, so 16, 8, 4, and 2 chunks on the sliced array and 32, 16, 8, 4 chunks on the index array, respectively.
charlesbluca
on 15 Mar 2021
Thanks for #553 @jakirkham!
Column masking behaves similarly to column sum:


Main difference in the profiles (125000 vs 250000) being that there's a lot more space between the kernel calls and UCX communication:


Also looks like there's some PtoP copies happening only for the larger chunk size? Highlighted where that's happening.
charlesbluca
on 16 Mar 2021
Also looks like there's some PtoP copies happening only for the larger chunk size? Highlighted where that's happening.
As I wrote in https://github.com/rapidsai/dask-cuda/issues/536#issuecomment-783743913, this is probably due to UCX_RNDV_THRESH.
pentschev
on 16 Mar 2021
This issue has been labeled inactive-30d due to no recent activity in the past 30 days. Please close this issue if no further response or action is needed. Otherwise, please respond with a comment indicating any updates or changes to the original issue and/or confirm this issue still needs to be addressed. This issue will be labeled inactive-90d if there is no activity in the next 60 days.
![github-actions[bot] picture](https://avatars.githubusercontent.com/in/15368?v=4&s=40) github-actions[bot]
on 15 Apr 2021
github-actions[bot]
on 15 Apr 2021
Related issues
 beckernick
·
10Comments
beckernick
·
10Comments
 lmeyerov
·
6Comments
lmeyerov
·
6Comments
 pradghos
·
11Comments
charlesbluca
·
3Comments
pradghos
·
11Comments
charlesbluca
·
3Comments
 vfdev-5
·
6Comments
vfdev-5
·
6Comments
Most helpful comment
As I wrote in https://github.com/rapidsai/dask-cuda/issues/536#issuecomment-783743913, this is probably due to
UCX_RNDV_THRESH.