Dashboard: Pipelineruns in Tekton dashboard show incorrect status for each step
Expected behavior
When running a pipelinerun in Tekton dashboard, the status for each step run in the pipelinerun should report correctly
Actual behavior
Tekton dashboard does not report status for the steps in a pipelinerun correctly
For example, in Kabanero 0.9.0-rc.2, run pipeline nodejs-express-build-deploy-pl in Tekton dashboard. It failed at step image-digest-exporter-pndfj and other steps showed as Not run as following
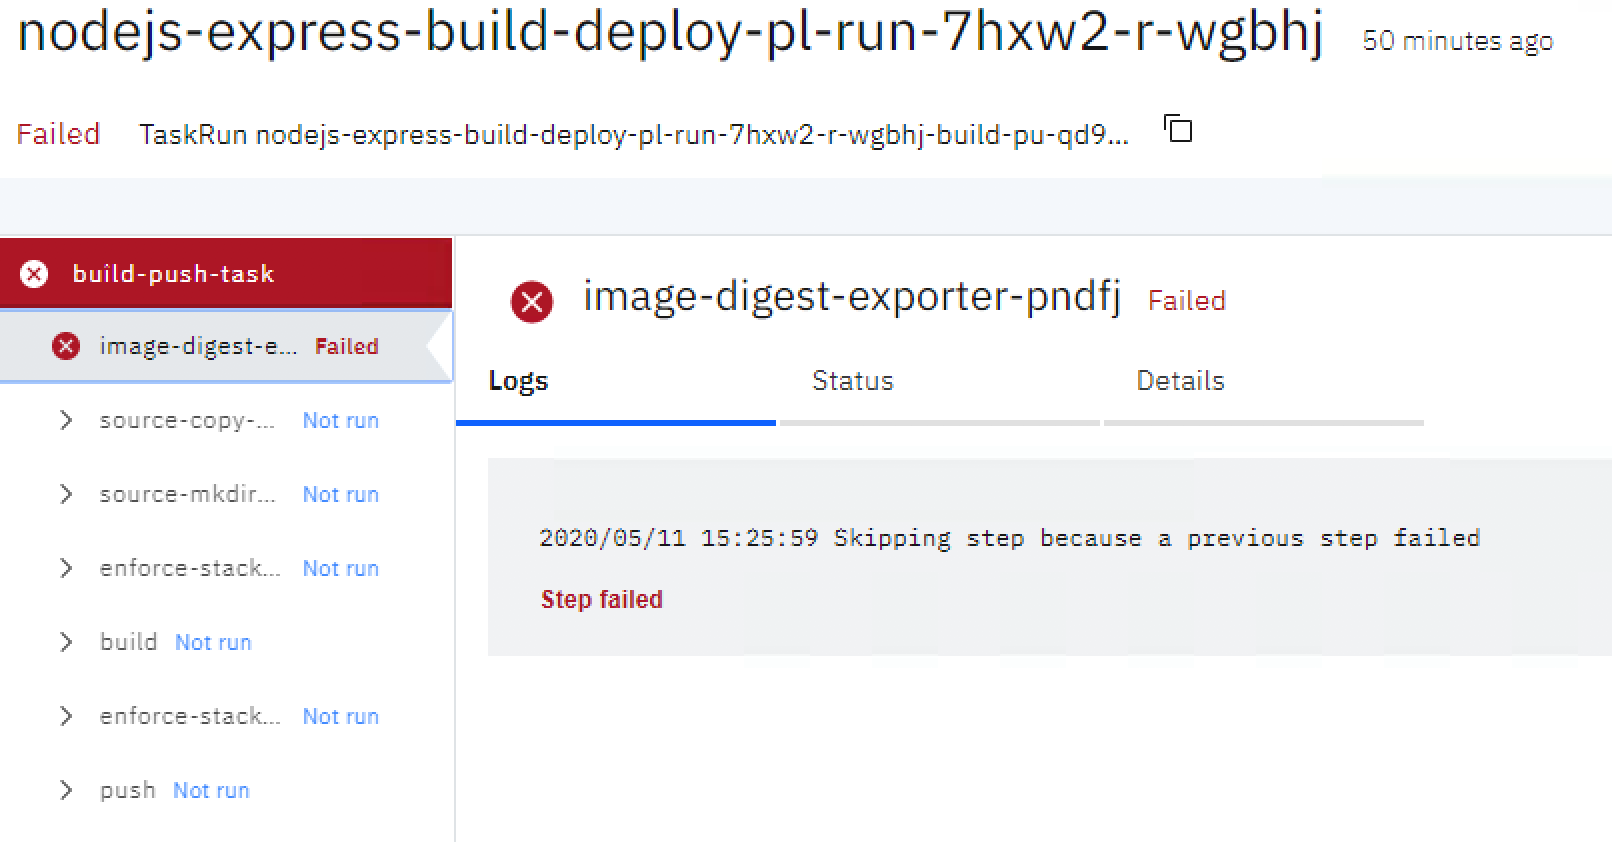
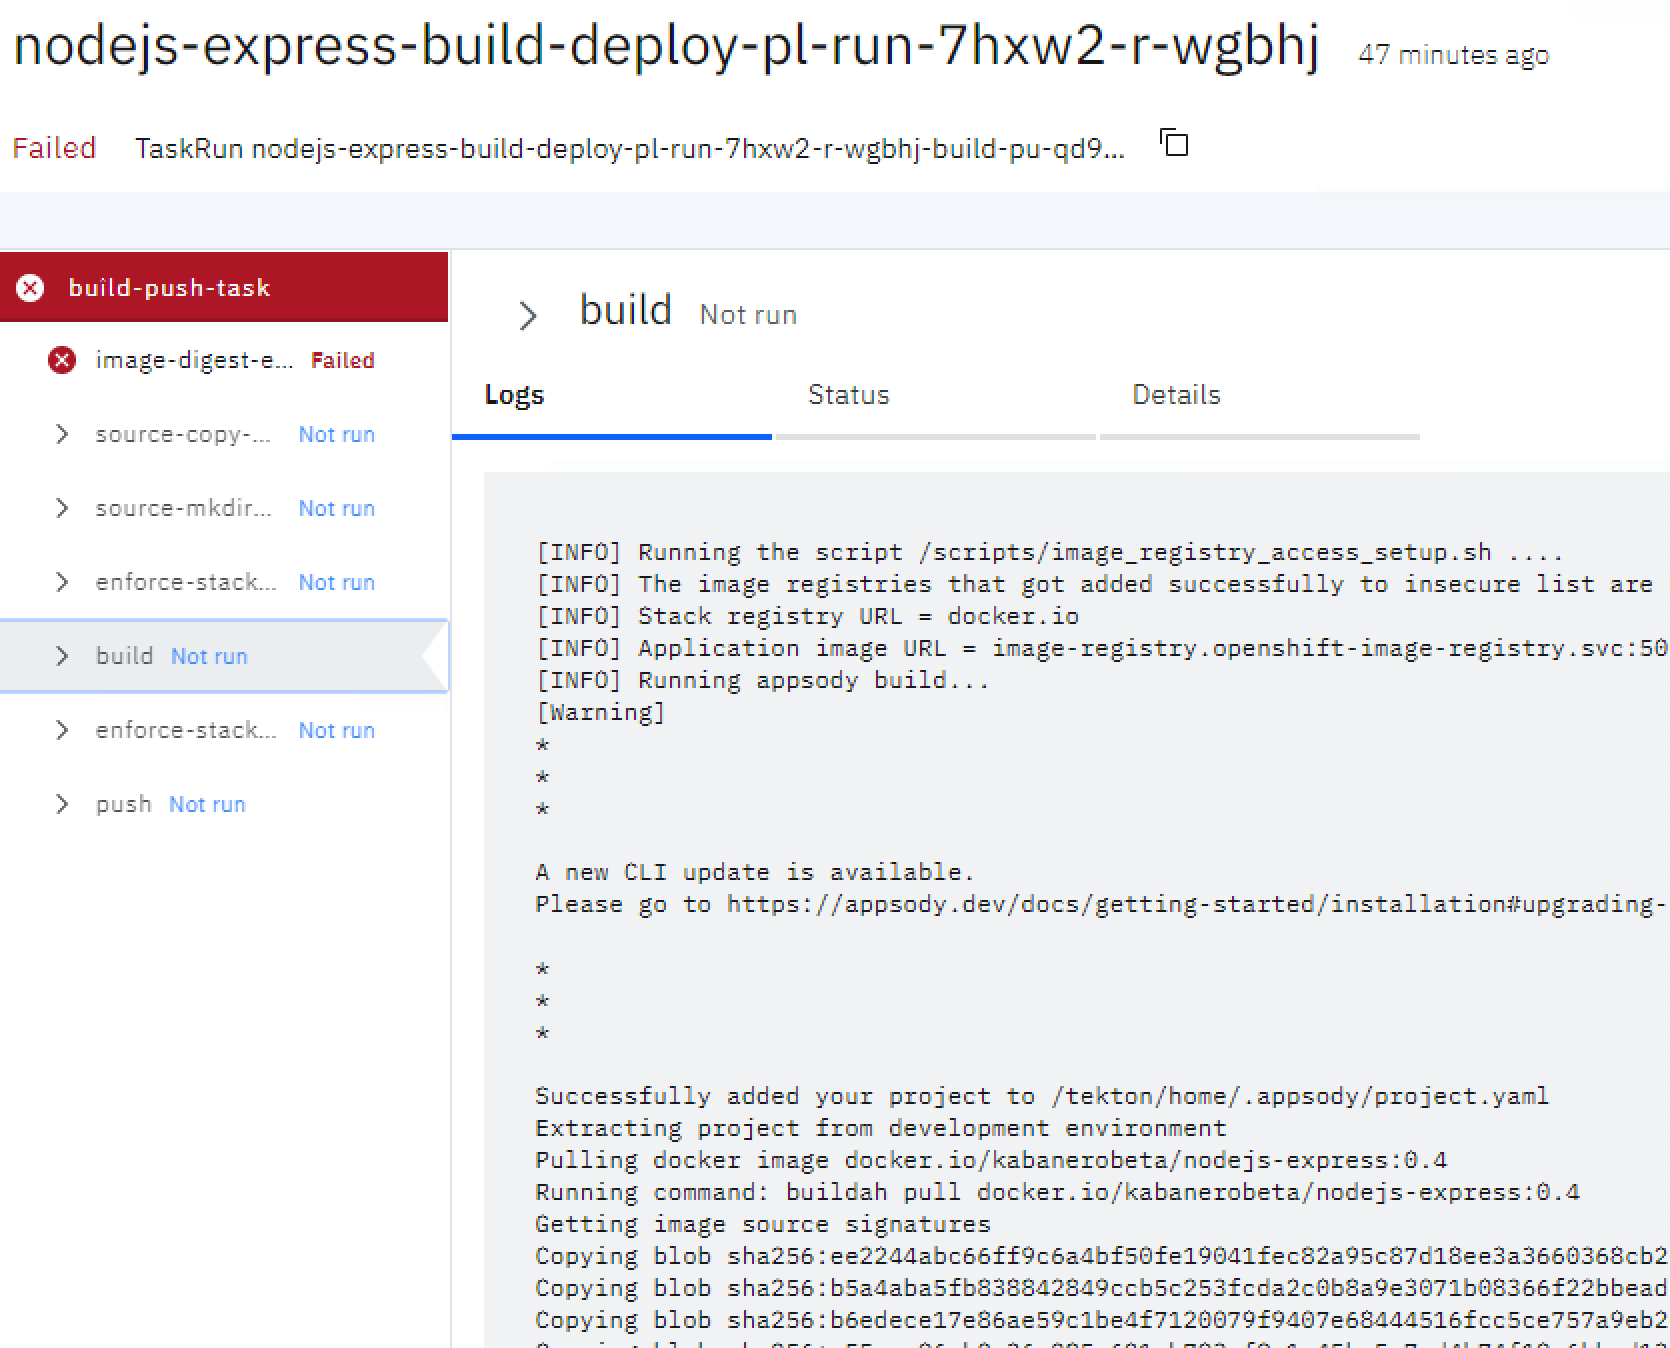
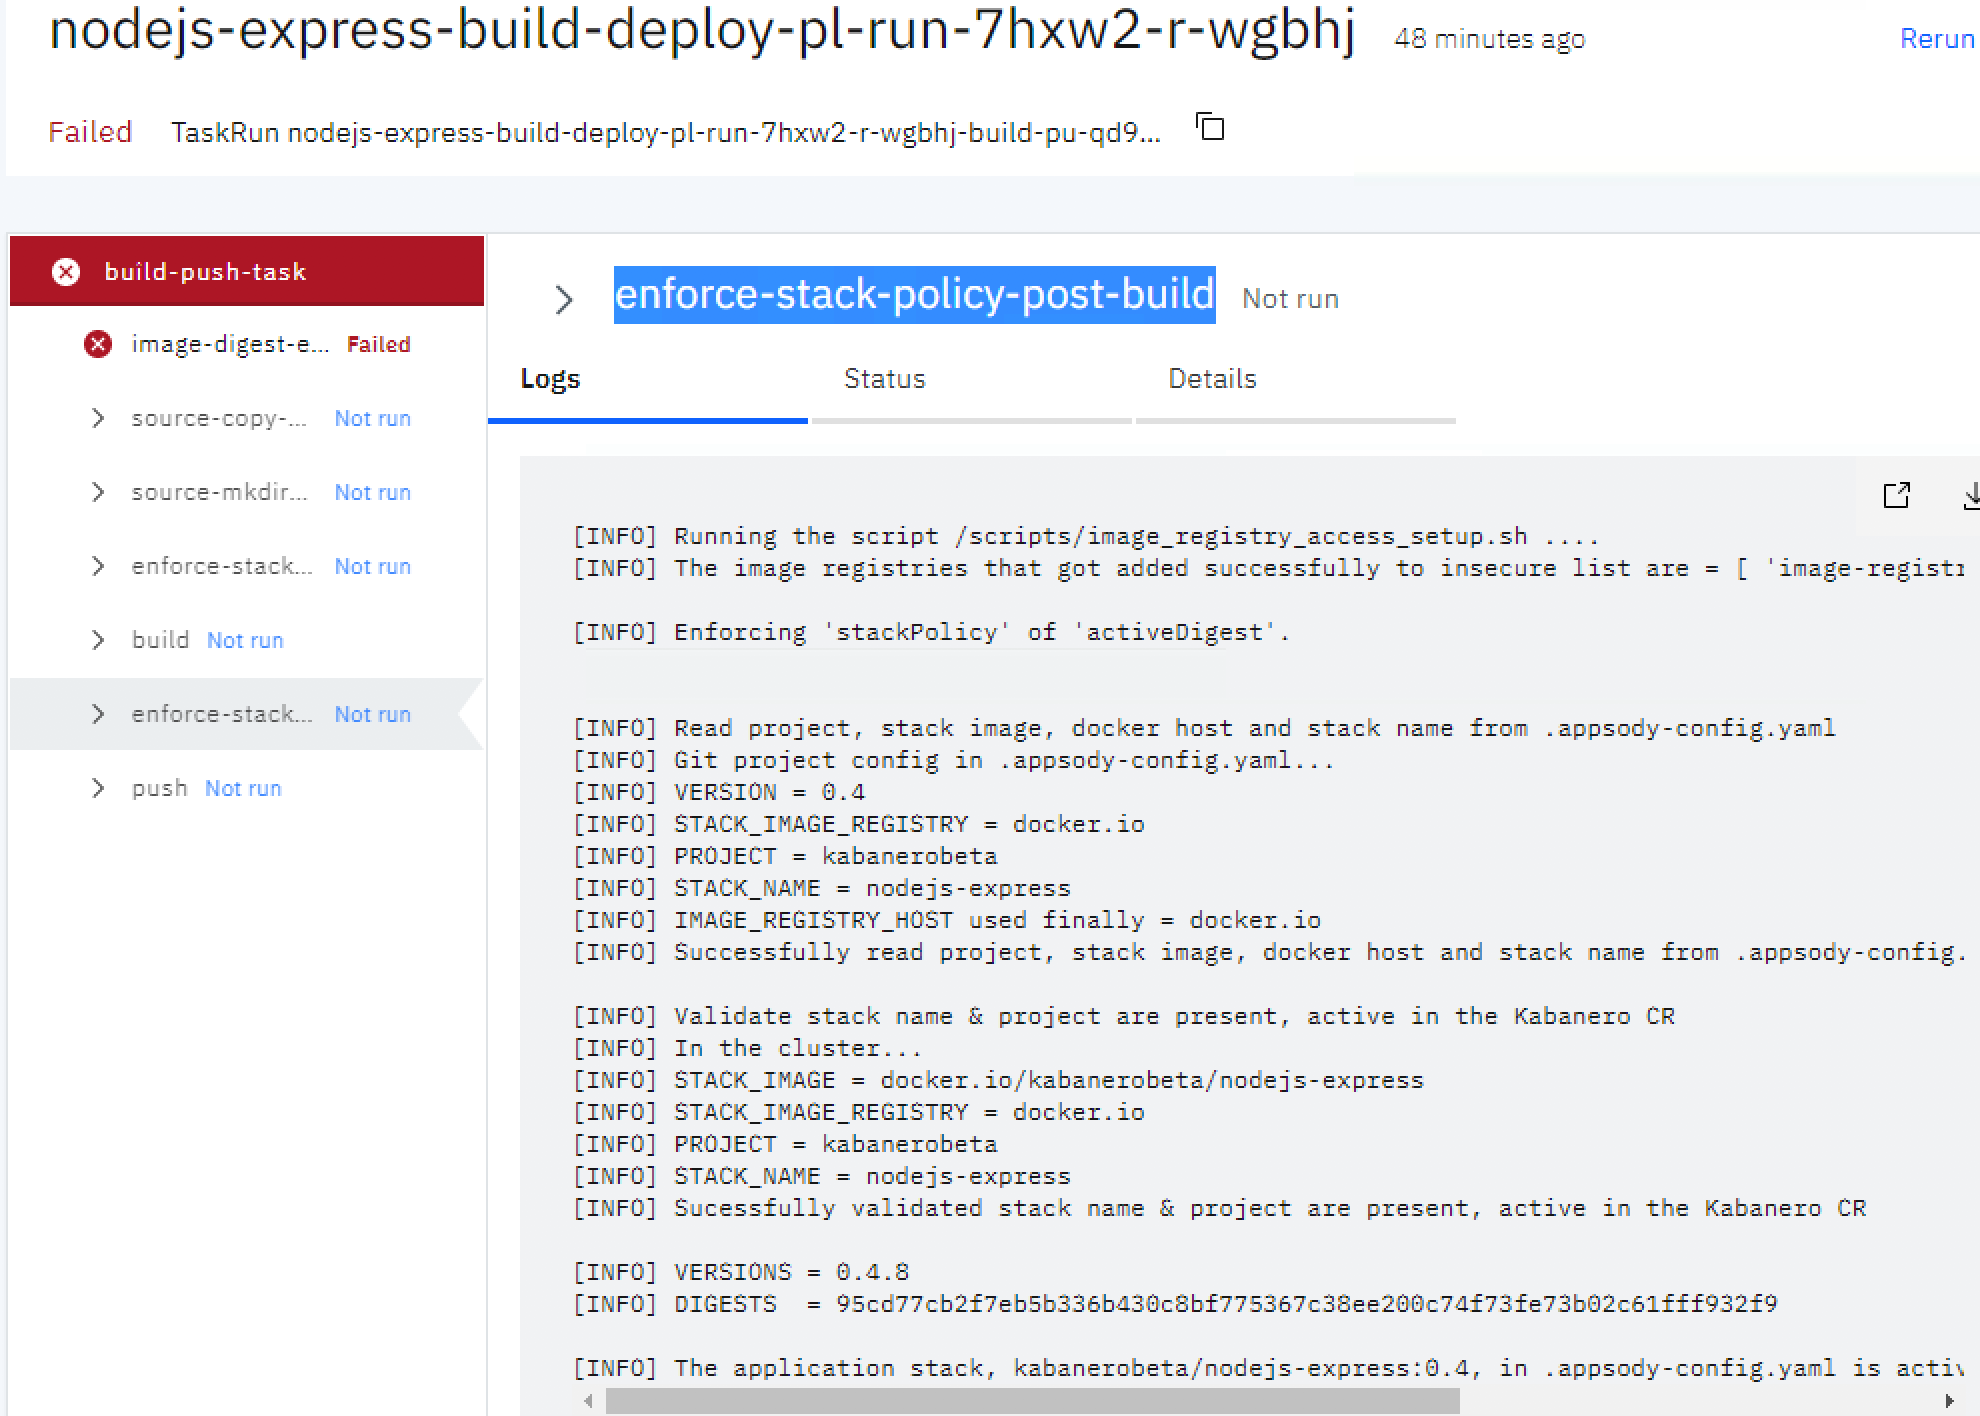
But I looked into each step, I see that it successfully ran steps enforce-stack-policy-pre-build, build, enforce-stack-policy-post-build, and failed onpush step.
So the steps that ran successfully should show as Completed and the push step should show as Failed and the rest of the steps should be Not run
The followings are the screenshots for the steps that ran successfully, but they showed as Not run

- The
pushstep is actually failed with error, but it showed asNot runinstead of Failed

Steps to reproduce the problem
- Create a webhook for nodejs express app with pipeline nodejs-express-build-deploy-pl from the Tekton dashboard. Use OpenShift internal registry (e.g. _image-registry.openshift-image-registry.svc:5000/svt-project2_)
- Make a small change in the app git repo to trigger the pipelinerun.
Environment
Kubernetes Platform: OPC 4.4.3
Tekton Pipelines version: tekton.version: v0.11.3
Tekton Triggers version:
Tekton Dashboard version:
Image ID: gcr.io/tekton-releases/github.com/tektoncd/dashboard/cmd/dashboard@sha256:3b4dc45de5ae0e741099018afe3e1108cb93f70aa24138456be03d9fde677269
Additional Info
This problem was found when pushing the image to internal registry and it failed with error 500
error pushing image "image-registry.openshift-image-registry.svc:5000/svt-project2/radcl-njsexpress-app:3d38ec4eea3c14cd93e68771319804f7fea86035" to "docker://image-registry.openshift-image-registry.svc:5000/svt-project2/radcl-njsexpress-app:3d38ec4eea3c14cd93e68771319804f7fea86035": error copying layers and metadata from "containers-storage:[overlay@/var/lib/containers/storage+/var/run/containers/storage:overlay.imagestore=/var/lib/shared,overlay.mount_program=/usr/bin/fuse-overlayfs,overlay.mountopt=nodev,metacopy=on]image-registry.openshift-image-registry.svc:5000/svt-project2/radcl-njsexpress-app:3d38ec4eea3c14cd93e68771319804f7fea86035" to "docker://image-registry.openshift-image-registry.svc:5000/svt-project2/radcl-njsexpress-app:3d38ec4eea3c14cd93e68771319804f7fea86035": Error writing manifest: Error uploading manifest 3d38ec4eea3c14cd93e68771319804f7fea86035 to image-registry.openshift-image-registry.svc:5000/svt-project2/radcl-njsexpress-app: received unexpected HTTP status: 500 Internal Server Error
 tam512
All 14 comments
I was able to recreate this in my cluster (manually creating a PipelineRun for https://developer.ibm.com/tutorials/tekton-triggers-101/ and sending the image to an incorrect registry address). It fails at the image-digest-exporter "step", which I think is created as part of the image PipelineResource.
I wasn't able to quite figure out the cause (and I think I'll need some help from someone else), but in my case I found that the TaskTree which shows all the "real" steps from the Task that started, and also the error step from the PipelineResource, but none of the successful steps from the PipelineResources. The PipelineRunContainer (parent of the TaskTree) has all of the steps.
I think that when the PipelineRunContainer creates the TaskTree, it filters and re-orders the steps. The error step is put first in the array as part of that process, which might not be correct (or at least, it might lead to this behavior).
The updateUnexecutedSteps function in utils assigns all of steps "after" the error step blank status and reason fields. The statusLabel() function in the Step seems to have the "Not run" status as a default, so that's what it displays to the user.
(Sorry if that's too many details without solving the problem, just wanted to post where I got on it today)
 JustinKuli
on 12 May 2020
JustinKuli
on 12 May 2020
The error step is put first in the array as part of that process, which might not be correct (or at least, it might lead to this behavior).
This is the cause alright. Due to issues in earlier pipeline versions (order of step status was unreliable) we had to order the steps ourselves in the dashboard and ran into a number of 'interesting' cases. Tekton Pipeline actually marks unexecuted steps as failed, so we override that as you've found to display them as 'Not run'. This works fine in most cases, but in this specific scenario it's the init step created for a PipelineResource image output (step-image-digest-exporter) that's failing. Since the failed init step gets added to the front of the list (wrong order in this case), all other steps are marked as not run.
There have been a number of changes in pipeline recently to address ordering issues, see for example https://github.com/tektoncd/pipeline/pull/2429 and https://github.com/tektoncd/pipeline/pull/2431. We should test against the latest release to see if there are any remaining ordering issues and whether we can remove our workaround.
 AlanGreene
on 12 May 2020
AlanGreene
on 12 May 2020
/assign
~I don't think I have permissions to assign myself, but I will be working on this.~ Robot works 👍
JustinKuli
on 12 May 2020
Finally traced back to where the steps were changing, and with a very small tweak I improved things in my case (still need to reproduce the original situation, since it was slightly different).
Change (1 line): https://github.com/JustinKuli/dashboard/commit/711bde37e5087a4dcc19daf4557e7fb119eb9a1f
Before:
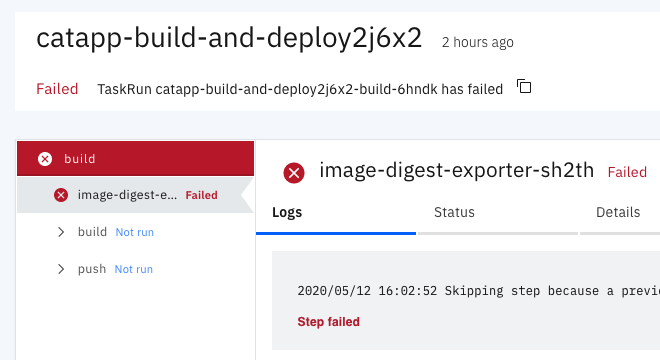
After:
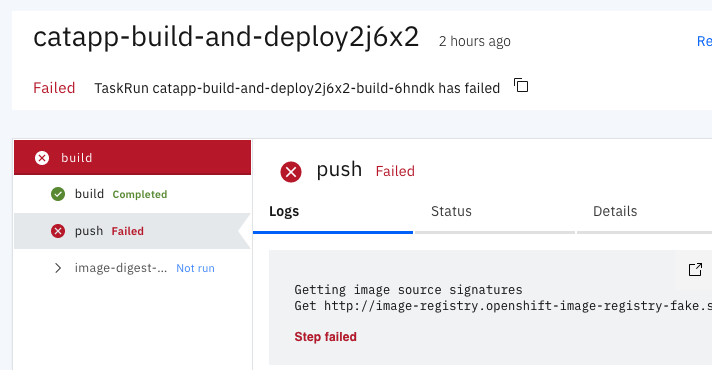
@AlanGreene, I still have to do tests and another recreate, but do you think just switching the order of this array will cause any other problems?
JustinKuli
on 12 May 2020
Yeah we'll end up with the same issue for most (all?) other init step failures where they'll be displayed at the end of the list even though they ran first and other steps will be marked as complete even though they didn't actually run. That was the original issue reported last year that we were attempting to work around by sorting etc. See https://github.com/tektoncd/dashboard/pull/653 and related issues.
AlanGreene
on 12 May 2020
Ok, so steps like "git-source" need to be at the front of the array when they fail, but this "image-digest" step needs to be at the end. Combining them all into "init steps" seems to be part of the issue.
Just to confirm, putting in a bad git source with my fix gives this (which is not desired):
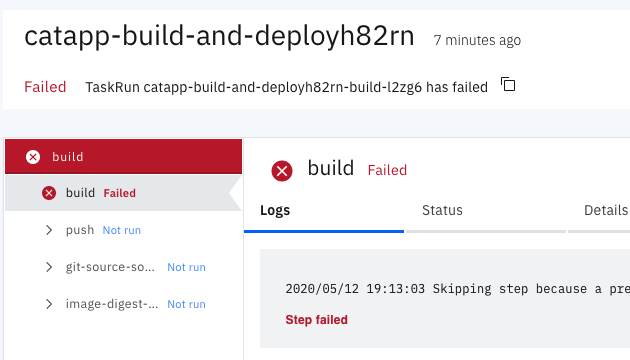
JustinKuli
on 12 May 2020
Right, that's it exactly. Ideally we would just use the order provided in the status if it's reliable now given the recent changes in Pipeline 0.12 or possibly master...
AlanGreene
on 12 May 2020
I haven't checked Pipelines 0.12, because I don't think Kabanero is planning to take that release.
Part of the issue is the the updateUnexecutedSteps function: currently if functions by labelling the "first" error step to be Failed and all later steps to be Not Run. That would be correct if the steps were in perfect order, but they are not (currently all "init" or injected steps are placed first). I tried modifying this function to only update the errorIndex if the step is a "regular" step (not one injected by PipelineResources or other things), but that wasn't much better. I got the correct behavior for the "regular" completed steps, but most skipped injected steps show up as failed.
I considered trying to re-sort the steps based on their terminated.finishedAt timestamps, but I don't think that's reliable. Skipped steps are likely to terminate at the same time as the failing step, not strictly later. For example in the original issue, the build step fails, and causes the image-digest step to be skipped. But they both might have the same "finishedAt" timestamp, and it's not possible without additional information to determine which was actually failed and which was skipped.
I think ordering the steps can be improved, and so can the updateUnexecutedSteps function. With that, we will see fewer of these issues, but I think there will be at least two situations where we will have "incorrect" labels:
- If multiple injected steps have errors (so they either Failed or Not Run) and finish at the same time, we can't determine the correct order between them. I think labelling them all as Failed would be better than incorrectly labelling any of them as Not Run.
- If an injected step finishes with an error at the same time as a regular step finishes with an error, we can't determine the order between them. I think we can ensure that the first regular step gets labelled as Failed, which will be better than incorrectly labelling it as Not Run.
Basically, I think we can get to a point where no steps are incorrectly labelled as Not Run, but we will possibly have more steps incorrectly labelled as Failed. For "regular" steps, we can limit the number of mislabels to 1, but for injected steps I don't think we can really limit the mislabels.
JustinKuli
on 13 May 2020
I'll look at the state of things in Pipeline 0.12 today.
JustinKuli
on 13 May 2020
It doesn't seem resolved in Pipeline 0.12 based on my tests.
https://github.com/tektoncd/pipeline/issues/2029 is related, and when that is resolved we might be able to use it. The issue is summarized well there:
pkg/pod/status.go does sort the container status by finish time (State.Terminated.FinishedAt) to try to find the first failure. However this field has a resolution of seconds. In my experiments the steps that are skipped usually finish in the same second as the step that failed. This defeats the intention of the sort.
https://github.com/tektoncd/pipeline/pull/2455 seems like a good possibility for fixing it, but I haven't checked it myself yet.
I realized that the step logs might provide a reliable way to determine if the step was skipped: they would always say Skipping step because a previous step failed. So I'm trying to get that information into the step list now.
JustinKuli
on 14 May 2020
Got the logs into the right place and made some progress here:
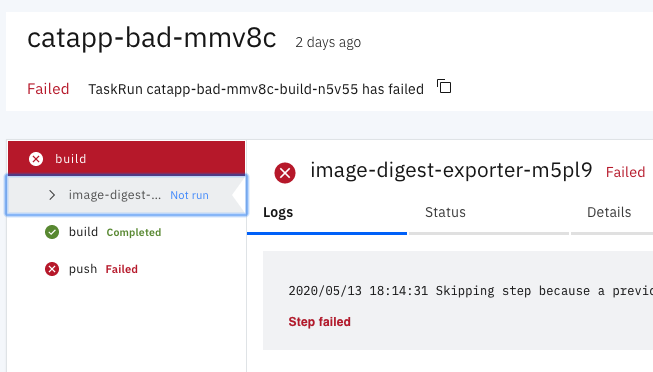
JustinKuli
on 15 May 2020
/reopen
The improved sorting logic in #1394 should improve the experience here. By sorting the injected steps into the "normal" steps (as opposed to lumping them at the top), fewer should be incorrectly labelled. A simple example of the improvement is here: https://github.com/tektoncd/dashboard/pull/1394#issuecomment-631072056
The fix is a bit limited by the information returned from pipeline. These "injected" steps aren't sorted into the steps list by the order they will be executed in, and it sounds like that's might be an unchanging part of that API now:
(From https://github.com/tektoncd/pipeline/blob/master/api_compatibility_policy.md#what-is-the-api):
The structure of the CRDs including the spec and status sections, as well as:
The ordering of the steps within the status
JustinKuli
on 21 May 2020
@JustinKuli: You can't reopen an issue/PR unless you authored it or you are a collaborator.
In response to this:
/reopen
The improved sorting logic in #1394 should improve the experience here. By sorting the injected steps into the "normal" steps (as opposed to lumping them at the top), fewer should be incorrectly labelled. A simple example of the improvement is here: https://github.com/tektoncd/dashboard/pull/1394#issuecomment-631072056
The fix is a bit limited by the information returned from
pipeline. These "injected" steps aren't sorted into the steps list by the order they will be executed in, and it sounds like that's might be an unchanging part of that API now:(From https://github.com/tektoncd/pipeline/blob/master/api_compatibility_policy.md#what-is-the-api):
The structure of the CRDs including the spec and status sections, as well as:
The ordering of the steps within the status
Instructions for interacting with me using PR comments are available here. If you have questions or suggestions related to my behavior, please file an issue against the kubernetes/test-infra repository.
 tekton-robot
on 21 May 2020
tekton-robot
on 21 May 2020
Since this issue was found during testing of Kabanero, I think we can reopen this until it gets into a release that project can use.
As an extra note, the improvement is still not perfect. To re-sort them, we rely on timestamps from pipeline, which are currently only down to the second. So a failing step and a skipped step might appear to run at the same time, and we can't determine which one actually failed and which one was skipped.
https://github.com/tektoncd/pipeline/pull/2455 increases the precision of one of the timestamps to milliseconds, and was just merged in pipeline (so it's not even in a release there yet). I expect that if the dashboard runs on a cluster with a newer version of pipeline the behavior here should be improved again since the likelihood of ties will decrease. But that doesn't help Kabanero any time soon.
JustinKuli
on 21 May 2020
Related issues
 alan-ghelardi
·
5Comments
AlanGreene
·
5Comments
AlanGreene
·
6Comments
alan-ghelardi
·
5Comments
AlanGreene
·
5Comments
AlanGreene
·
6Comments
 sm43
·
4Comments
AlanGreene
·
4Comments
sm43
·
4Comments
AlanGreene
·
4Comments