Dashboard: Hi CPU usage on 1.10.1 Kubernetes Dashboard
Environment
Installation method:
Kubernetes version: 1.11.7
Dashboard version: 1.10.1
Operating system: Windows 10
Browser: Google Chrome - latest version
Steps to reproduce
- Go into Pods for namespace having 50 pods
- Api is getting back results in 70ms
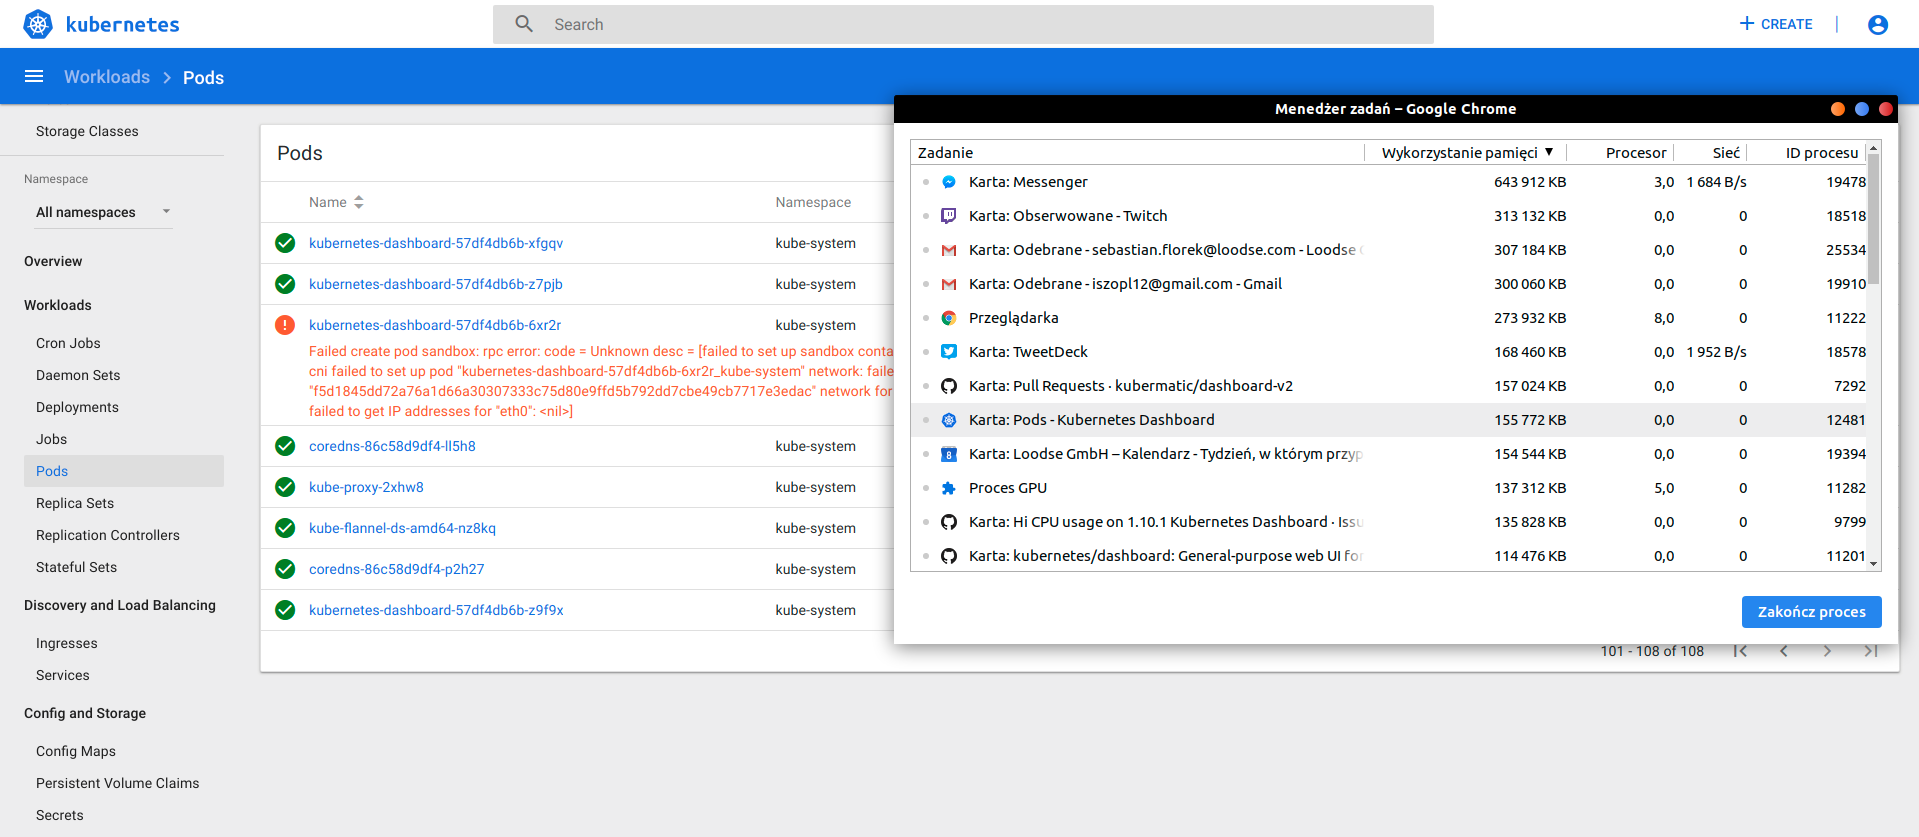
- Front end acts very slow in rendering giving 100% of CPU usage
Here is the picture from Chrome task manager.

Machine specs
Intel Core i7-7500U
16 gb ddr4
just to know that this is not slow machine to work on in general
Expected result
To have faster load of pages
 vasicvuk
All 8 comments
I am not sure how exactly your workflow looks like, but I don't see any issues with pod list view. Even having over 100 pods is not an issue.
PS. I am also using latest Chrome.
 floreks
on 8 Mar 2019
floreks
on 8 Mar 2019
@floreks Your screenshot shows the rendered page. Mine was taken during the rendering. During the rendering it uses from 60 to 190 CPU % on Chrome which quite a value.
Switch a little bit between pods and jobs and you will get the High CPU load.
Also the animations during the loading are very slow and the whole experience feels little blocked
vasicvuk
on 8 Mar 2019
I am not sure what to expect here. This is normal that to get something rendered ASAP, browser will allow all the resources available to render something. Such short spikes are normal and can be seen on most pages (gmail, github, etc.). Also the CPU value in Chrome Task Manager scales to your logical cores, so in your cases it would be 2 cores * 4 threads per core. Up to 800%. I have tested Dashboard on clusters with hundreds of resources and did not experience such slowdowns.
You could check if our head image, that is based on angular 7 and optimized will work better.
It can be accessed on: http://localhost:8001/api/v1/namespaces/kube-system/services/https:kubernetes-dashboard-head:/proxy/ if you are using kubectl proxy.
floreks
on 21 Mar 2019
Issues go stale after 90d of inactivity.
Mark the issue as fresh with /remove-lifecycle stale.
Stale issues rot after an additional 30d of inactivity and eventually close.
If this issue is safe to close now please do so with /close.
Send feedback to sig-testing, kubernetes/test-infra and/or fejta.
/lifecycle stale
 fejta-bot
on 2 Jul 2019
fejta-bot
on 2 Jul 2019
/close
floreks
on 3 Jul 2019
@floreks: Closing this issue.
In response to this:
/close
Instructions for interacting with me using PR comments are available here. If you have questions or suggestions related to my behavior, please file an issue against the kubernetes/test-infra repository.
 k8s-ci-robot
on 3 Jul 2019
k8s-ci-robot
on 3 Jul 2019
I tested Dashboard based on Angular 7 and it seems that it works better.
I really dont understand why the performance of current version is so bad specially when rendering Overview screen of some namespace.
vasicvuk
on 3 Jul 2019
New version is optimized better and rewritten from scratch. Some things work differently and it better handles async download of resources.
floreks
on 3 Jul 2019
Related issues
 wu105
·
3Comments
wu105
·
3Comments
 lukmanulhakimd
·
4Comments
lukmanulhakimd
·
4Comments
 Eddman
·
4Comments
Eddman
·
4Comments
 pavankjadda
·
3Comments
pavankjadda
·
3Comments
 kairen
·
4Comments
kairen
·
4Comments