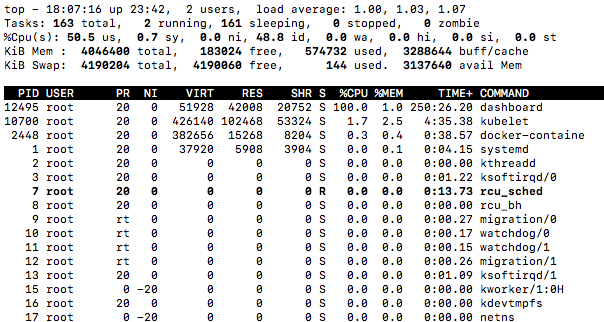
Dashboard: Dashboard is using 100% CPU
Environment
Dashboard version: 1.7
Kubernetes version: 1.7.6
Operating system: Ubuntu 16.04 LTS
Steps to reproduce
- Use docker 17.06.0-ce, use
sudo iptables -P FORWARD ACCEPTto fix network problem - Install Kubernetes on Ubuntu 16.04 using kubeadm by following the official tutorial
- Add heapster
- Add Dashboard with the command from the github page
- Give admin permissions to the dashboard
- Wait 1-2 hours
Observed result
CPU usage reported by top command is 100% on the dashboard process. Dashboard is still working and it is quick as well.
Expected result
Dashboard CPU usage is in a normal range, a lot lower than this.
Comments
I'm running docker 17.06.0-ce, I know it is not supported but I have a very similar installation with the same docker version and Kubernetes 1.7.3 using the then available Dashboard HEAD (1.7 was not yet out), and it is running totally fine. I have already reset the whole cluster with kubeadm reset, redeployed dashboard multiple times, no use, the same thing happened. Dashboard logs show no sign of problem.
 Timester
All 14 comments
Hi,
Same thing on coreos and kubernetes 1.7.6.
 aruhier
on 24 Sep 2017
aruhier
on 24 Sep 2017
Interesting. We have to add debug and profiling options to dashboard. We need goroutines stacktraces to find out the cause. My dashboard is running for a few days already without any issues.
 floreks
on 24 Sep 2017
floreks
on 24 Sep 2017
meet the same problem on Ubuntu 16.04.3 LTS, docker 17.03ce, kubernetes 1.7.6, dashboard 1.7.0
top - 16:32:36 up 7 days,  1:48,  1 user,  load average: 1.28, 1.12, 1.10
Tasks: 162 total,   1 running, 160 sleeping,   0 stopped,   1 zombie
%Cpu(s): 51.0 us,  1.0 sy,  0.0 ni, 48.0 id,  0.0 wa,  0.0 hi,  0.0 si,  0.0 st
KiB Mem :  4046496 total,   198984 free,   500984 used,  3346528 buff/cache
KiB Swap:  4190716 total,  4190112 free,      604 used.  3164284 avail Mem

  PID USER      PR  NI    VIRT    RES    SHR S  %CPU %MEM     TIME+ COMMAND
  596 root      20   0   51928  41372  20560 S  99.0  1.0   1487:06 dashboard
 7520 root      20   0  403632 104444  53764 S   3.0  2.6 185:22.55 kubelet
15097 root      20   0  962924  67156  26164 S   1.0  1.7  53:45.85 dockerd
 7820 root      20   0  304120  27232  13908 S   0.3  0.7   0:19.75 snapd
15351 root      20   0   55812  37504  27700 S   0.3  0.9  18:30.78 kube-proxy
16527 root      20   0  436928  52028  13224 S   0.3  1.3   6:16.42 weaver
    1 root      20   0   38360   6632   4200 S   0.0  0.2   0:13.57 systemd
    2 root      20   0       0      0      0 S   0.0  0.0   0:00.04 kthreadd
    3 root      20   0       0      0      0 S   0.0  0.0   0:10.84 ksoftirqd/0
And dashboard seems work ok: no restart since it launching:
kube-system kubernetes-dashboard-3217454043-qtwj9 1/1 Running 0 1d 10.40.0.5 ubuntu-k8s-2
and the log of dashboard pod also seems ok, no dead loop:
om=2000000000&offsetTo=2000000100&referenceLineNum=0&referenceTimestamp=newest request from 10.32.0.1:36460: {}
2017/09/27 08:30:24 [2017-09-27T08:30:24Z] Outcoming response to 10.32.0.1:36460 with 200 status code
2017/09/27 08:30:30 [2017-09-27T08:30:30Z] Incoming HTTP/2.0 GET /api/v1/log/kube-system/kubernetes-dashboard-3217454043-qtwj9/kubernetes-dashboard?logFilePosition=beginning&offsetFrom=-2000000100&offsetTo=-2000000000&referenceLineNum=0&referenceTimestamp=oldest request from 10.32.0.1:36460: {}
2017/09/27 08:30:30 [2017-09-27T08:30:30Z] Outcoming response to 10.32.0.1:36460 with 200 status code
2017/09/27 08:30:33 [2017-09-27T08:30:33Z] Incoming HTTP/2.0 GET /api/v1/log/kube-system/kubernetes-dashboard-3217454043-qtwj9/kubernetes-dashboard?logFilePosition=end&offsetFrom=2000000000&offsetTo=2000000100&referenceLineNum=0&referenceTimestamp=newest request from 10.32.0.1:36460: {}
2017/09/27 08:30:33 [2017-09-27T08:30:33Z] Outcoming response to 10.32.0.1:36460 with 200 status code
 bigwhite
on 27 Sep 2017
bigwhite
on 27 Sep 2017
I was able to reproduce it. Will take a closer look soon.
floreks
on 27 Sep 2017
I will confirm later, but it seems to not happen with kubernetes 1.8.0.
Edit: my bad, still happening
aruhier
on 30 Sep 2017
I can confirm the same on Kubernetes 1.8 with Dashboard 1.7. It does not happen directly however. mine came after it standing idle over the weekend. nothing strange in the default logs
 roffe
on 2 Oct 2017
roffe
on 2 Oct 2017
Most probably it is not related to kubernetes itself. I am profiling it right know and hopefully will find the cause.
floreks
on 2 Oct 2017
Ok, I think I have found the cause. We will do a 1.7.1 release after fixing this issue.
floreks
on 2 Oct 2017
@floreks fast as lightning. Thank you for the good work!
roffe
on 2 Oct 2017
Thanks. We are trying our best :smile:
floreks
on 2 Oct 2017
Check out v1.7.1 release. Should be free of this bug. :)
floreks
on 2 Oct 2017
@floreks I can confirm it fixed my issues—thanks for this!
 lseelenbinder
on 2 Oct 2017
lseelenbinder
on 2 Oct 2017
Thank you!
Timester
on 3 Oct 2017
Was there a regression here for 1.10.0? After updating, dashboard is pegging CPUs again. Will try to investigate next time I have some spare time
 erulabs
on 17 Apr 2018
erulabs
on 17 Apr 2018
Related issues
 dzoeteman
·
4Comments
dzoeteman
·
4Comments
 eloyekunle
·
3Comments
eloyekunle
·
3Comments
 Eddman
·
4Comments
Eddman
·
4Comments
 andrei-dascalu
·
3Comments
andrei-dascalu
·
3Comments
 lukmanulhakimd
·
4Comments
lukmanulhakimd
·
4Comments
Most helpful comment
I was able to reproduce it. Will take a closer look soon.