Dashboard: Dashboard 404s on stylesheets & scripts
Environment
I'm running a K8s cluster on a CentOS7 vagrant VM. The VM has a hostnetwork adapter and the cluster is installed with kubeadm
Dashboard version: (Container version) gcr.io/google_containers/kubernetes-dashboard-amd64@sha256:2c4421ed80358a0ee97b44357b6cd6dc09be6ccc27dfe9d50c9bfc39a760e5fe
Kubernetes version:

Client Version: version.Info{Major:"1", Minor:"7", GitVersion:"v1.7.5", GitCommit:"17d7182a7ccbb167074be7a87f0a68bd00d58d97", GitTreeState:"clean", BuildDate:"2017-08-31T09:14:02Z", GoVersion:"go1.8.3", Compiler:"gc", Platform:"linux/amd64"}
Server Version: version.Info{Major:"1", Minor:"7", GitVersion:"v1.7.6", GitCommit:"4bc5e7f9a6c25dc4c03d4d656f2cefd21540e28c", GitTreeState:"clean", BuildDate:"2017-09-14T06:36:08Z", GoVersion:"go1.8.3", Compiler:"gc", Platform:"linux/amd64"}

Operating system: CentOS7
Node.js version: ?
Go version: ?
Steps to reproduce
- Installed a cluster using
kubeadmon CentOS7 - Run
kubectl create -f https://git.io/kube-dashboard kubectl proxy --address=<routable-IP> --port=<PORT> --accept-hosts="^*$"
Observed result
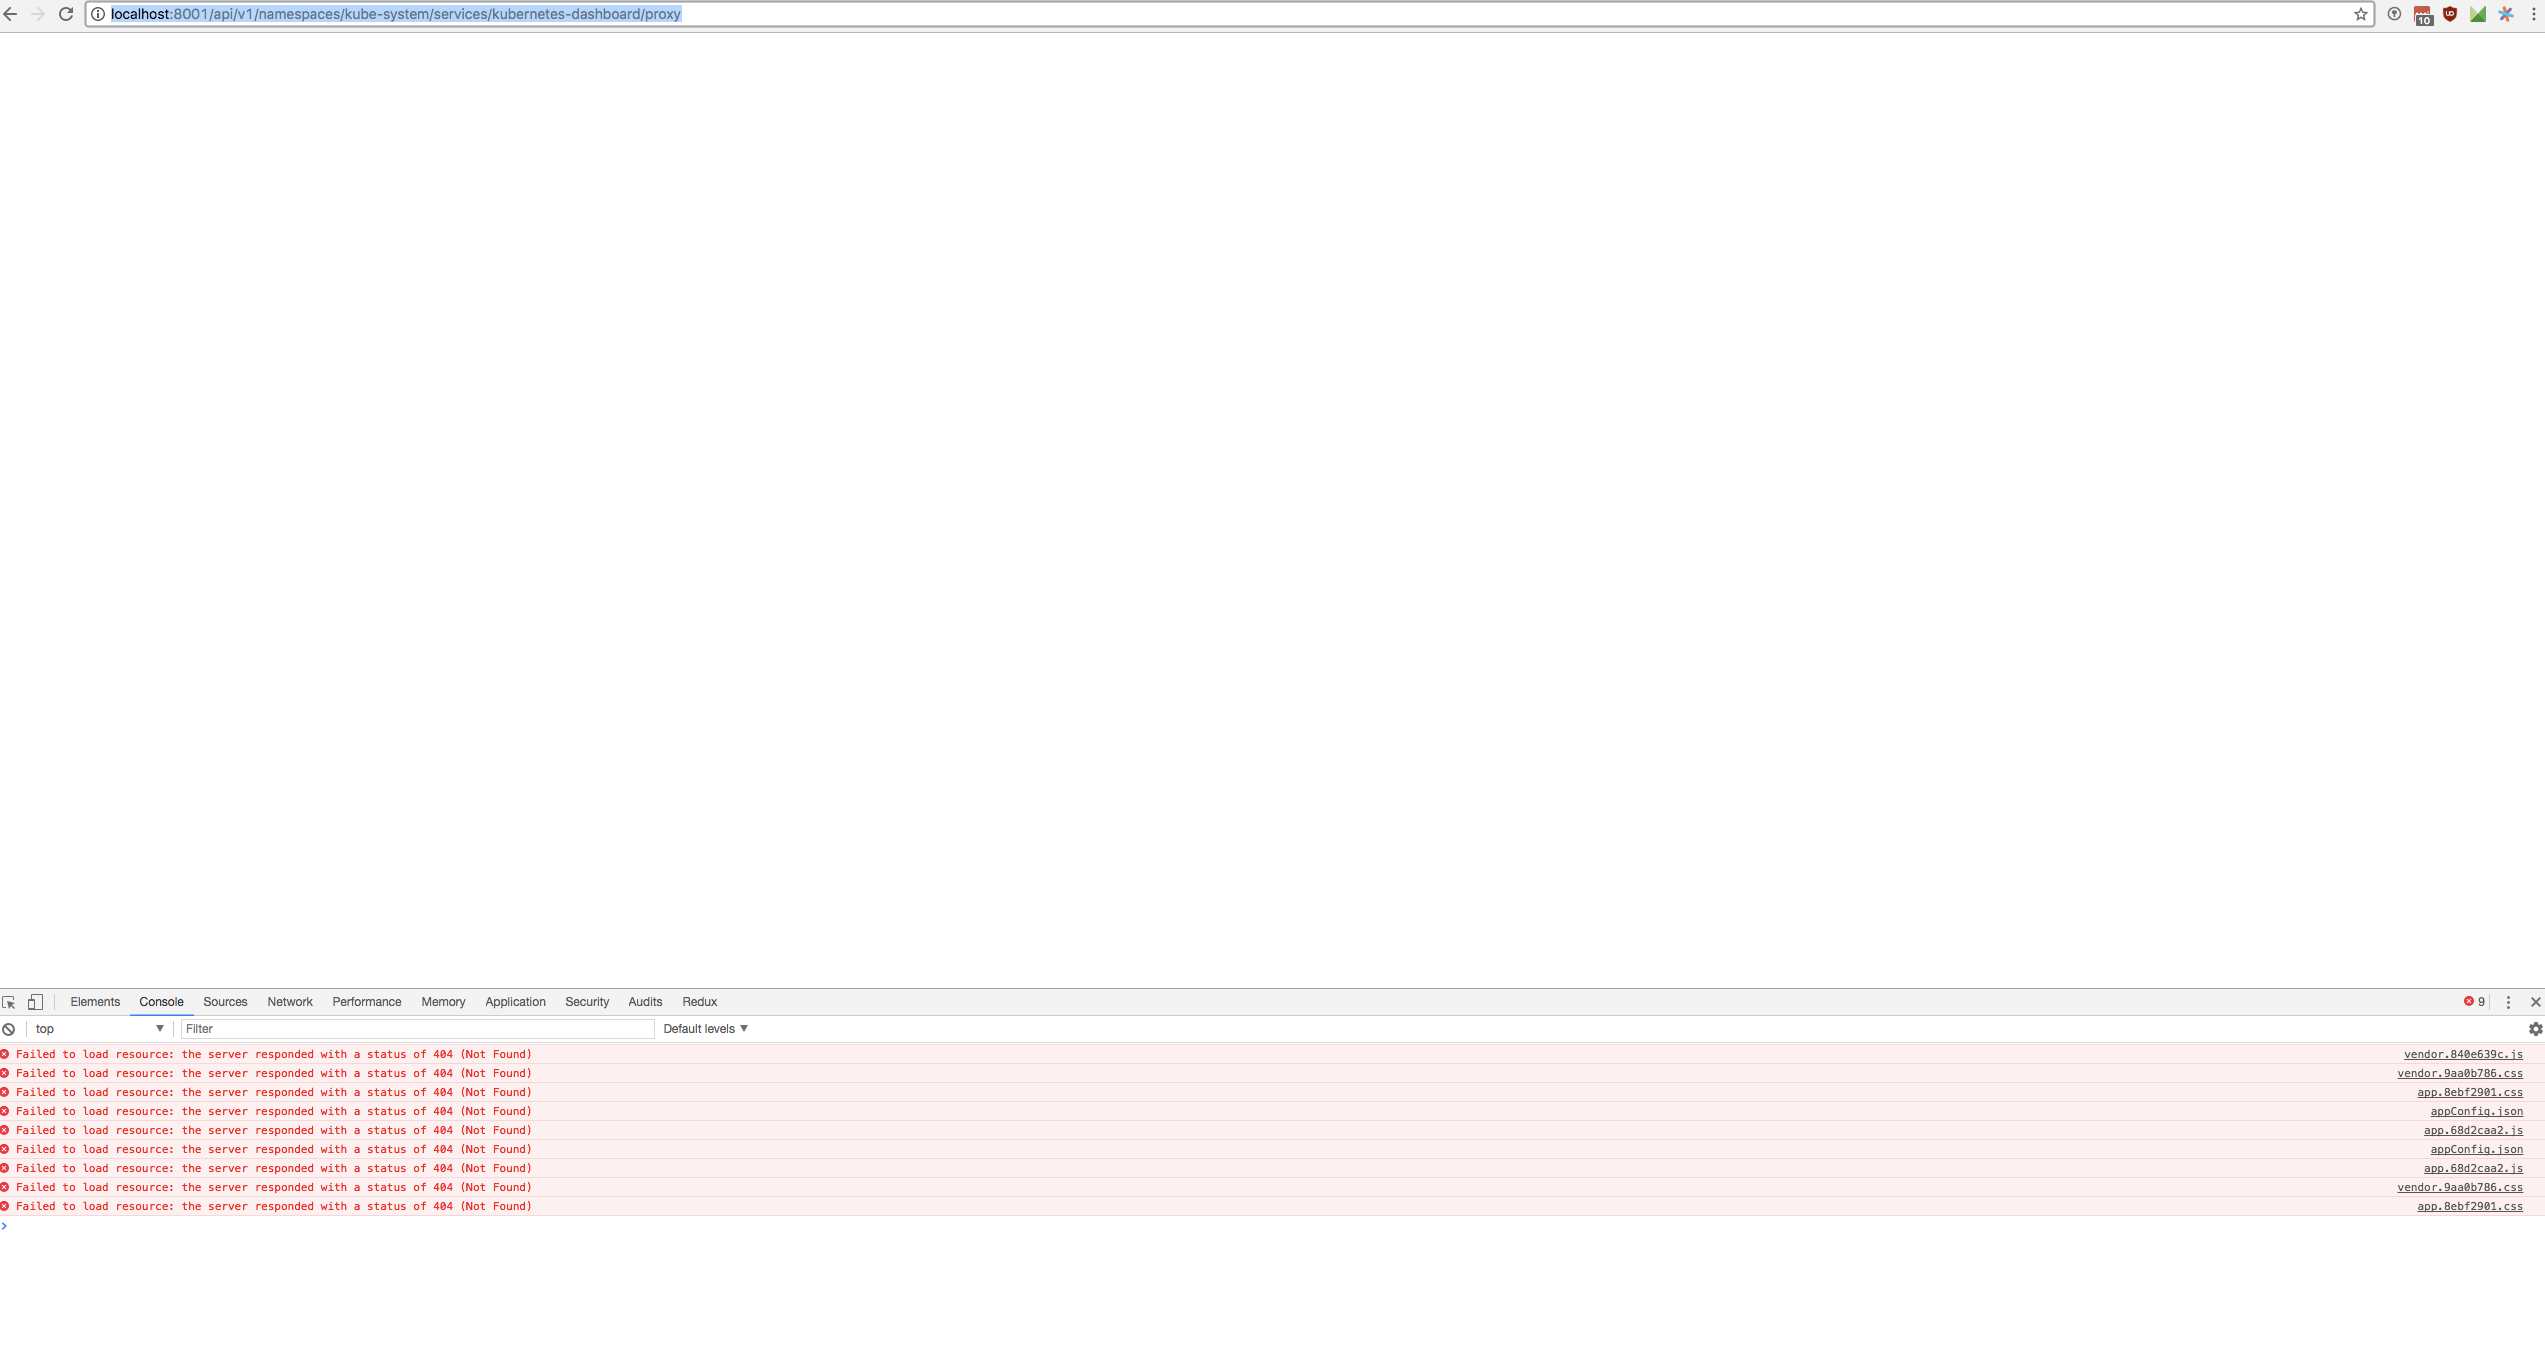
Going to the dashboard in a browser I see a white screen.
Opening chrome's dev console I see a bunch of 404s
GET https://<IP>/api/v1/namespaces/kube-system/services/kubernetes-dashboard/static/vendor.9aa0b786.css
proxy:1 GET https://<IP>/api/v1/namespaces/kube-system/services/kubernetes-dashboard/static/app.8ebf2901.css
proxy:5 GET https://<IP>/api/v1/namespaces/kube-system/services/kubernetes-dashboard/api/appConfig.json
proxy:5 GET https://<IP>/api/v1/namespaces/kube-system/services/kubernetes-dashboard/static/app.68d2caa2.js
proxy:5 GET https://<IP>/api/v1/namespaces/kube-system/services/kubernetes-dashboard/static/vendor.840e639c.js
proxy:5 GET https://<IP>/api/v1/namespaces/kube-system/services/kubernetes-dashboard/api/appConfig.json
proxy:5 GET https://<IP>/api/v1/namespaces/kube-system/services/kubernetes-dashboard/static/app.68d2caa2.js
Going to one of those links I see.
{
  "kind": "Status",
  "apiVersion": "v1",
  "metadata": {},
  "status": "Failure",
  "message": "the server could not find the requested resource",
  "reason": "NotFound",
  "details": {},
  "code": 404
}
kube-dashboard container logs
kubectl logs kubernetes-dashboard-3313488171-6v53b -n kube-system
Using HTTP port: 8443
Using in-cluster config to connect to apiserver
Using service account token for csrf signing
No request provided. Skipping authorization header
Successful initial request to the apiserver, version: v1.7.6
No request provided. Skipping authorization header
Creating in-cluster Heapster client
Could not enable metric client: Health check failed: the server could not find the requested resource (get services heapster). Continuing.
Expected result
Expected the normal kube dashboard. (I have seen this set up work on 9.13.17)
Comments
This exact set up was running yesterday 9.13, and today on 9.14 I set up my VM cluster in the same way and see this error. I'm fairly certain its not an error on my end, maybe the dashboard container was updated and caused an issue?
 stephenrlouie
All 44 comments
kubectl create -f https://git.io/kube-dashboard resolves to our latest official release that was done in July. Since then nothing was changed on our end. I do not think that this is related to Dashboard as nothing has changed since yesterday. Probably some networking issue or resources are blocked by some firewall.
 floreks
on 14 Sep 2017
floreks
on 14 Sep 2017
I get the exact same error, running on a ubuntu master created with kubeadm
 ztripez
on 14 Sep 2017
ztripez
on 14 Sep 2017
@floreks
could you detail how to build the dashboard container. I have run this shell script but am uncertain it will work since the Dockerfile does not have a CMD or ENTRYPOINT
stephenrlouie
on 14 Sep 2017
@ztripez Our dev team is also using ubuntu + kubeadm so I'm pretty sure that this is not related to Dashboard.
floreks
on 14 Sep 2017
Check out our wiki: https://github.com/kubernetes/dashboard/wiki/Getting-started. There is a gulp docker-image:head mentioned that builds local docker image.
floreks
on 14 Sep 2017
this runs the container locally, but my intention is to modify the dashboard deploy file and pull my own dashboard container. Upon pulling the container built by the script it fails as there is no entrypoint.
stephenrlouie
on 14 Sep 2017
gulp docker-image:head will build you a docker image listed under docker images. Then you can simply use docker tag to rename it and docker push to push to your own docker registry.
floreks
on 14 Sep 2017
This Dockerfile is used to build dashboard container. Other one is just to start gulp with all dependencies inside the docker container. In example you can run ./run-gulp-in-docker.sh serve to start dashboard in dev mode without installing all required dependencies.
floreks
on 14 Sep 2017
Ah super, thanks for the pointer @floreks. One last thing before I have my own container though, I cannot seem to get a dashboard executable. The last Dockerfile you referenced is looking for it as its ENTRYPOINT
stephenrlouie
on 14 Sep 2017
@floreks I resolved it by running ./build/run-gulp-in-docker.sh docker-image:head.
I'm trying to figure out where this error is coming from. I'm just curious now since my vagrant environment has not changed and the deploy script hasn't changed since July. Maybe its kubeadm?
stephenrlouie
on 14 Sep 2017
Probably not kubeadm since I am also using it. Try to run dashboard outside the cluster with docker run and provide apiserver-host flag.
floreks
on 14 Sep 2017
@floreks correct, it worked running it out of docker raw with the flags --apiserver-host <api-service-ip> --insecure-bind-address <my-routable-ip> --insecure-port <port> --kubeconfig <volume mounted path of kube config>
You should make the call to close this issue. I think people may be coming here for more information in the future given the problem arises in running kube-dashboard. Hopefully someone (maybe myself) can get to the core of this issue.
stephenrlouie
on 14 Sep 2017
I'm having the same issue with my cluster which I just upgraded to 1.7.6 from 1.6.4 and built with kops.
I tried deleting and rebuilding the objects, but same issue. Same issue when I deploy HEAD.
 rhenretta
on 14 Sep 2017
rhenretta
on 14 Sep 2017
I just tried setting up the on 3 ubuntu 16.04 machines (1 master 2 slaves) using kubeadm for the setup, used weave for networking.
And I get the missing resources too.
Figured out I did something wrong, started from scratch and it's still the same.
It might not be caused by the dashboard but I guess it would make sense to have the solution documented/linked here once figured out since people will apparently look here for help ;)
 TobiasBales
on 15 Sep 2017
TobiasBales
on 15 Sep 2017
I'll try to check it on 1.7.6 cluster today and post the results.
floreks
on 15 Sep 2017
Latest kubeadm version is currently based on k8s 1.7.5.
Package: kubeadm
Version: 1.7.5-00
Installed-Size: 69641
Maintainer: Kubernetes Authors <[email protected]>
Architecture: amd64
Depends: kubelet (>= 1.6.0), kubectl (>= 1.6.0)
Description: Kubernetes Cluster Bootstrapping Tool
 The Kubernetes command line tool for bootstrapping a Kubernetes cluster.
Homepage: https://kubernetes.io
Filename: pool/kubeadm_1.7.5-00_amd64_5683ceb924f3cefd14a3307ddef30af20d567ad90692ef6a92f229ac9fa1b3a0.deb
Priority: optional
SHA256: 5683ceb924f3cefd14a3307ddef30af20d567ad90692ef6a92f229ac9fa1b3a0
Section: misc
Size: 9781778
Everything is running fine on my Ubuntu 17.04. I have executed following commands:
kubeadm init --pod-network-cidr=10.244.0.0/16
kubectl apply -f https://raw.githubusercontent.com/coreos/flannel/master/Documentation/kube-flannel.yml
kubectl apply -f https://raw.githubusercontent.com/coreos/flannel/master/Documentation/kube-flannel-rbac.yml
kubectl taint nodes --all node-role.kubernetes.io/master-
kubectl apply -f https://git.io/kube-dashboard
kubectl proxy
I am able to see dashboard at http://localhost:8001/ui.
floreks
on 15 Sep 2017
Will try my setup again with 17.04 and 16.04 and flannel instead of weave and report back
TobiasBales
on 15 Sep 2017
We have same issue today.
kubeadm version: &version.Info{Major:"1", Minor:"7", GitVersion:"v1.7.5", GitCommit:"17d7182a7ccbb167074be7a87f0a68bd00d58d97", GitTreeState:"clean", BuildDate:"2017-08-31T08:56:23Z", GoVersion:"go1.8.3", Compiler:"gc", Platform:"linux/amd64"}
kubectl version
Client Version: version.Info{Major:"1", Minor:"7", GitVersion:"v1.7.5", GitCommit:"17d7182a7ccbb167074be7a87f0a68bd00d58d97", GitTreeState:"clean", BuildDate:"2017-08-31T09:14:02Z", GoVersion:"go1.8.3", Compiler:"gc", Platform:"linux/amd64"}
Server Version: version.Info{Major:"1", Minor:"7", GitVersion:"v1.7.6", GitCommit:"4bc5e7f9a6c25dc4c03d4d656f2cefd21540e28c", GitTreeState:"clean", BuildDate:"2017-09-14T06:36:08Z", GoVersion:"go1.8.3", Compiler:"gc", Platform:"linux/amd64"}
kubelet --version
Kubernetes v1.7.5
dockerd -v
Docker version 17.06.2-ce, build cec0b72
Images:
gcr.io/google_containers/etcd-amd64:3.0.17
gcr.io/google_containers/heapster-amd64:v1.4.0
gcr.io/google_containers/heapster-grafana-amd64:v4.4.1
gcr.io/google_containers/heapster-influxdb-amd64:v1.1.1
gcr.io/google_containers/k8s-dns-dnsmasq-nanny-amd64:1.14.4
gcr.io/google_containers/k8s-dns-kube-dns-amd64:1.14.4
gcr.io/google_containers/k8s-dns-sidecar-amd64:1.14.4
gcr.io/google_containers/kube-apiserver-amd64:v1.7.6
gcr.io/google_containers/kube-controller-manager-amd64:v1.7.6
gcr.io/google_containers/kube-proxy-amd64:v1.7.6
gcr.io/google_containers/kubernetes-dashboard-amd64:v1.6.3
gcr.io/google_containers/kube-scheduler-amd64:v1.7.6
quay.io/coreos/flannel:v0.8.0-amd64
 TomskDiver
on 15 Sep 2017
TomskDiver
on 15 Sep 2017
@TomskDiver @TobiasBales and others, how are you trying to access it? Using kubectl proxy?
Try to expose dashboard service by changing type from ClusterIP to NodePort and check if you can access http://<node-ip>:<node-port>. This way there will be no proxy involved.
floreks
on 15 Sep 2017
Yes using kubectl proxy
What version of docker are you running? Since I am using 17.06.2-ce too
TobiasBales
on 15 Sep 2017
$ docker version
Client:
 Version:      1.12.6
 API version:  1.24
 Go version:   go1.7.4
 Git commit:   78d1802
 Built:        Tue Mar 14 09:47:15 2017
 OS/Arch:      linux/amd64

Server:
 Version:      1.12.6
 API version:  1.24
 Go version:   go1.7.4
 Git commit:   78d1802
 Built:        Tue Mar 14 09:47:15 2017
 OS/Arch:      linux/amd64
I try change dashboard service type to NodePort and this WORKED! Problem in 'kubectl proxy'
TomskDiver
on 15 Sep 2017
Read our Accessing Dashboard guide.
floreks
on 15 Sep 2017
I read it but I am still not sure what is it for me from working using the kubectl proxy method, any more input on how to do that?
I tried the setup on ubuntu 17.04 containers but that ran into the same issues.
Since I am using weave and @TomskDiver is using flannel I am hoping it's not the network implementation.
One big change is docker 1.12.6 -> 1.16.2-ce sadly I didn't find how to install 1.12.6 on a new ubuntu box, any hints?
Just trying to isolate the issue.
Update: I just ran everything on 16.04 with just one tainted master using flannel and trying to access it using kubectl proxy still fails.
Will try to install docker 1.12.6 and test again
TobiasBales
on 15 Sep 2017
Describe exact steps how you are trying to access it. I need kubectl proxy with all arguments you are using and exact URL you are trying to access in the browser. Screenshot from browser with dev console open would be also good.
floreks
on 15 Sep 2017
after copying the admin.conf to my local machine as flannel-config
I ran kubectl --kubeconfig=flannel-config get proxy
(I ran the kubeadm init with an additional --apiserver-cert-extra-sans=<ip> the ip being the outside ip of the host and then adjusted the ip in cluster->server in flannel-config. The editing took place on my local machine)
then I pointed my browser to http://localhost:8001/ui (also tried /ui/) and get redirected to http://localhost:8001/api/v1/namespaces/kube-system/services/kubernetes-dashboard/proxy
The result looks like this:
TobiasBales
on 15 Sep 2017
Since you are using kubeadm try these steps:
# After running 'kubeadm init' kubeconfig file should be in /etc/kuberenetes
$ sudo cp /etc/kubernetes/admin.conf ~/.kube/config
# Check if kubectl works. It should provide valid output. Just run it as regular user (not root).
$ kubectl cluster-info
# Run kubectl proxy
$ kubectl proxy
Starting to serve on 127.0.0.1:8001
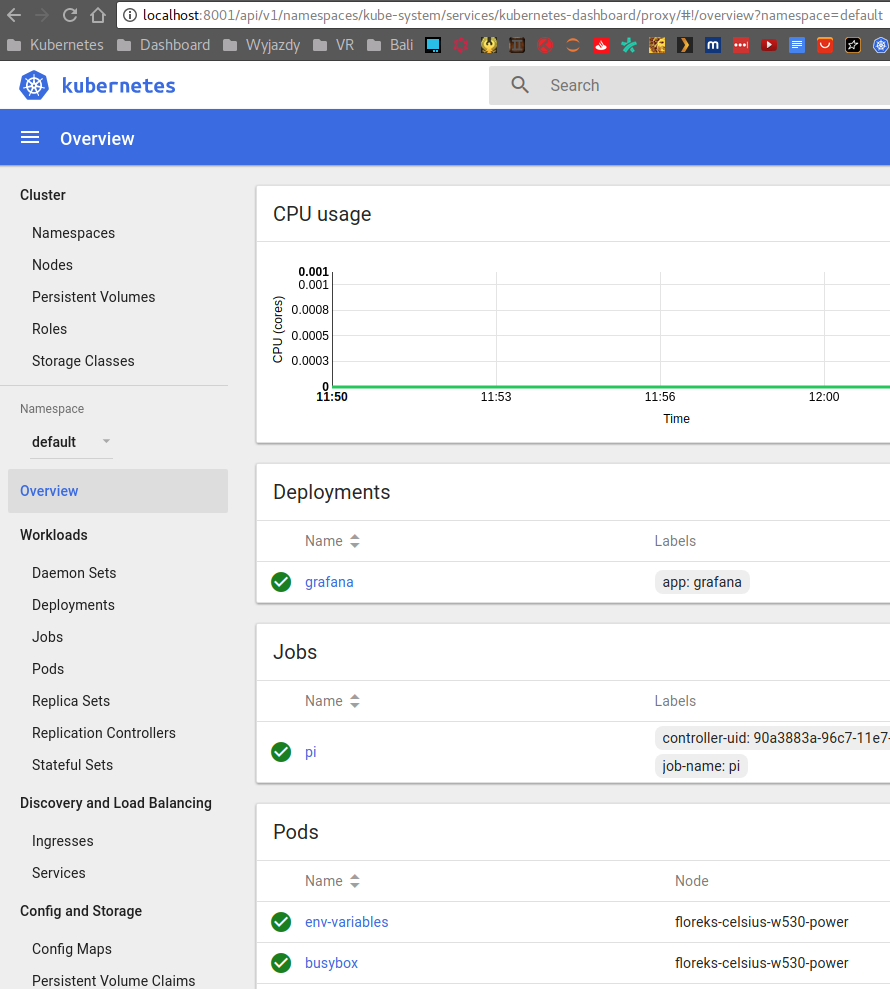
Then you should be able to access dashboard at http://localhost:8001/ui it resolves to http://localhost:8001/api/v1/namespaces/kube-system/services/kubernetes-dashboard/proxy.
floreks
on 15 Sep 2017
I copied the file on the server running the cluster but can't open a browser on the host.
What I tried (now) was sshing onto the kubernetes host it ssh -L 8001:localhost:8001 <kubernetes-host>, ran kubectl proxy and opened the dashboard on my local chrome (again localhost:80801/ui) got redirected but the assets are still not being served
TobiasBales
on 15 Sep 2017
This is completely different setup than mine. kubectl proxy already opens SSH tunnel and you are trying to add second one to that. This should not be needed.
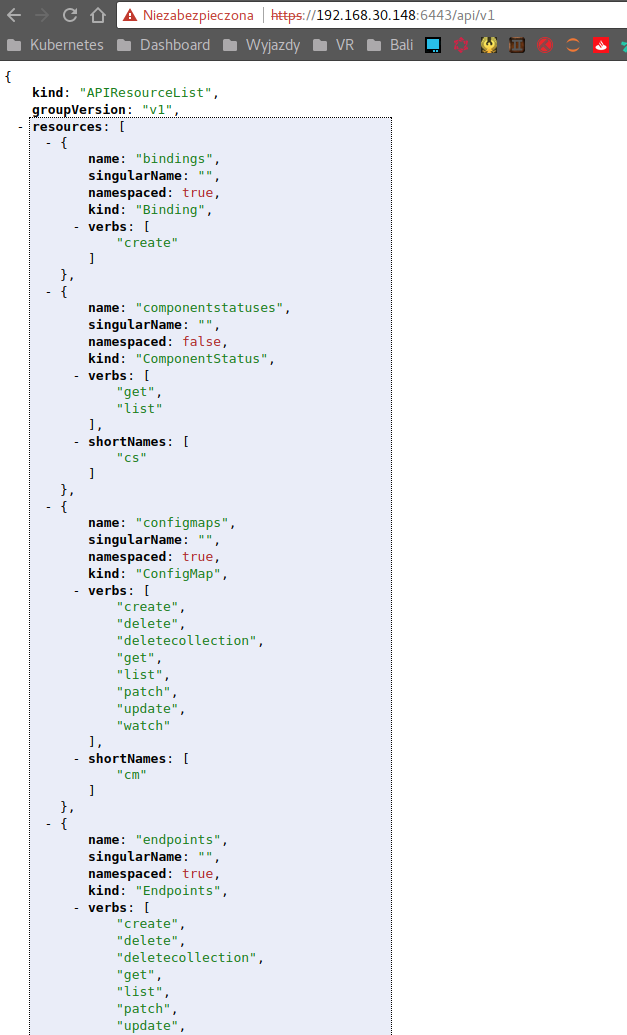
- API server should be exposed and accessible from your PC (where you can actually run browser).
- You should be able to access and see API server response when accessing
https://<master-ip>:6443
- Used kubeconfig file should be configured to access used
<master-ip>.
apiVersion: v1
clusters:
- cluster:
    certificate-authority-data: ...
    server: https://192.168.30.148:6443
- Now from the PC where you can access API server you can execute
kubectl proxy. It will usekubeconfigfile stored in$HOME/.kube/config
$ kubectl proxy
Starting to serve on 127.0.0.1:8001
- Secure and authenticated connection to API Server is now accessible at
http://localhost:8001andhttp://localhost:8001/uiredirects you to Dashboard.
floreks
on 15 Sep 2017
Those were just after the fact attempts I suppose.
When I use the working config file (I can run kubectl --kube-config=flannel-config cluster-info)
and then run kubectl --kube-config=flannel-config proxy (not sure if I needed to, just did it incase)
when access my master on https://master-ip:6443 (or /ui) it just tells me
User "system:anonymous" cannot get path "/ui".
when accessing localhost:8001/ui I get redirected and no assets as before. Any Idea where this is going wrong?
TobiasBales
on 15 Sep 2017
https://github.com/kubernetes/dashboard/wiki/FAQ#i-am-seeing-404-errors-when-trying-to-access-dashbord-dashboard-resources-can-not-be-loaded
Why are you using flannel-config? Flannel's SA does not have all necessary privileges to be used as an admin config.
floreks
on 15 Sep 2017
sorry, it's the same as before I just named it for me know which host I am connecting to it is the admin.conf from the master
TobiasBales
on 15 Sep 2017
You can also try to access http://localhost:8001/api/v1/proxy/namespaces/kube-system/services/kubernetes-dashboard/. It requires a bit different set of privileges to access.
floreks
on 15 Sep 2017
Interestingly enough that just works
TobiasBales
on 15 Sep 2017
This proves it is a cluster config issue. Somewhere along the way when using first URL request is blocked and resources can not be loaded.
floreks
on 15 Sep 2017
@floreks Just deployed a new 1.7.6 cluster via kubeadm and calico network provider and got exactly the same problem.
If i try to access the dashbaord via kubectl proxy, then i get a redirect from
http://localhost:8001/ui
to
http://localhost:8001/api/v1/namespaces/kube-system/services/kubernetes-dashboard/proxy
which just gives me a white blank page (could not load resources etc.). If i use the link you provided
http://localhost:8001/api/v1/proxy/namespaces/kube-system/services/kubernetes-dashboard/
it works as it should. So is there maybe a wrong redirect? The URLs are different ("proxy" at the beginning vs. at the end) ...
 discostur
on 19 Sep 2017
discostur
on 19 Sep 2017
No, redirect is fine. Both URLs work for me. AFAIK they require different privileges to access. If you want to know the difference and maybe find the cause you can ask for help on core repository. There is a chance that it is a bug in kubernetes.
floreks
on 19 Sep 2017
ok, i'll try it on core repository! thanks
discostur
on 19 Sep 2017
I have the same problem. What I found out so far:
http://127.0.0.1:8001/api/v1/namespaces/kube-system/services/kubernetes-dashboard/static/vendor.840e639c.js
=> 404
http://127.0.0.1:8001/api/v1/namespaces/kube-system/services/kubernetes-dashboard/proxy/static/vendor.840e639c.js
works! I there something wrong with the static assets path? static vs. proxy/static
 TomHutter
on 23 Sep 2017
TomHutter
on 23 Sep 2017
@TomHutter https://github.com/kubernetes/dashboard/wiki/FAQ#i-am-seeing-404-errors-when-trying-to-access-dashbord-dashboard-resources-can-not-be-loaded
floreks
on 23 Sep 2017
Thanks floreks, this solved my problem :-)
TomHutter
on 23 Sep 2017
Thanks @floreks that now solves the problem for me.
TL;DR Simply add a trailing slash to the http://localhost:8001/api/v1/namespaces/kube-system/services/kubernetes-dashboard/proxy url to reset issues caused by previously dodgy auth.
 jujhars13
on 9 Oct 2017
jujhars13
on 9 Oct 2017
Thanks @floreks @jujhars13
Simply add a trailing slash to the http://localhost:8001/api/v1/namespaces/kube-system/services/kubernetes-dashboard/proxy url
Did it for me! :)
 Noah-Heil
on 8 Nov 2017
Noah-Heil
on 8 Nov 2017
I have set up a cluster where there are 2 nodes. One is Master and Other is a node, both on different Azure ubuntu VMs. For networking, I used Canal tool.
$ kubectl get nodes
NAME             STATUS    ROLES     AGE       VERSION
ubuntu-aniket1   Ready     master    57m       v1.10.0
ubutu-aniket     Ready     <none>    56m       v1.10.0
$ kubectl get pods --all-namespaces
NAMESPACE     NAME                                     READY     STATUS    RESTARTS   AGE
kube-system   canal-jztfd                              3/3       Running   0          57m
kube-system   canal-mdbbp                              3/3       Running   0          57m
kube-system   etcd-ubuntu-aniket1                      1/1       Running   0          58m
kube-system   kube-apiserver-ubuntu-aniket1            1/1       Running   0          58m
kube-system   kube-controller-manager-ubuntu-aniket1   1/1       Running   0          58m
kube-system   kube-dns-86f4d74b45-8zqqr                3/3       Running   0          58m
kube-system   kube-proxy-k5ggz                         1/1       Running   0          58m
kube-system   kube-proxy-vx9sq                         1/1       Running   0          57m
kube-system   kube-scheduler-ubuntu-aniket1            1/1       Running   0          58m
kube-system   kubernetes-dashboard-54865c6fb9-kg5zt    1/1       Running   0          26m
When I tried to create kubernetes Dashboard with
$ kubectl apply -f https://raw.githubusercontent.com/kubernetes/dashboard/master/src/deploy/recommended/kubernetes-dashboard.yaml
and set proxy as
$ kubectl proxy --address 0.0.0.0 --accept-hosts '.*'
Starting to serve on [::]:8001
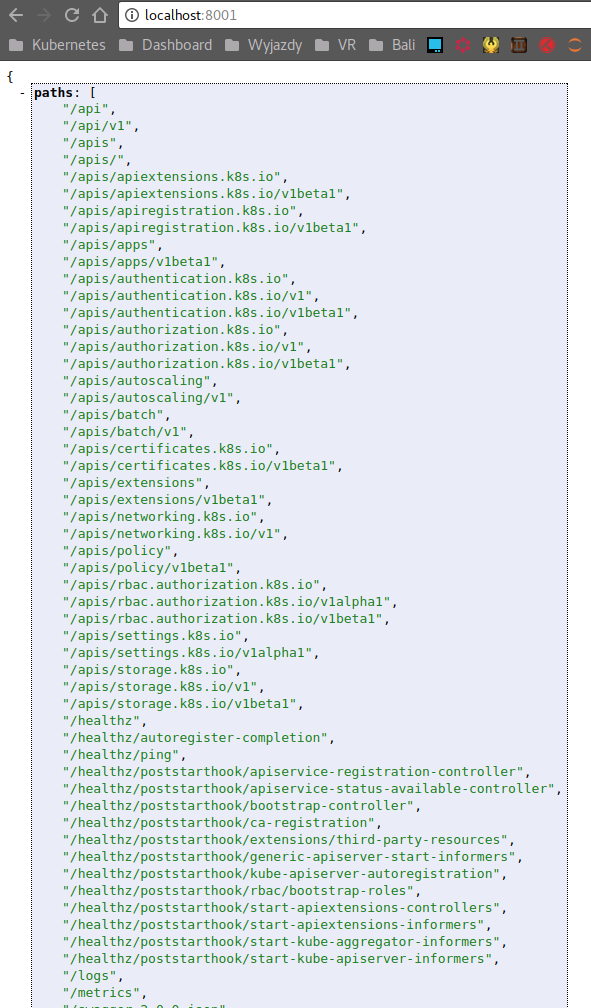
When I hit url http://<master IP>:8001 in browser, it shows following output
{
  "paths": [
    "/api",
    "/api/v1",
    "/apis",
    "/apis/",
    "/apis/admissionregistration.k8s.io",
    "/apis/admissionregistration.k8s.io/v1beta1",
    "/apis/apiextensions.k8s.io",
    "/apis/apiextensions.k8s.io/v1beta1",
    "/apis/apiregistration.k8s.io",
    "/apis/apiregistration.k8s.io/v1",
    "/apis/apiregistration.k8s.io/v1beta1",
    "/apis/apps",
    "/apis/apps/v1",
    "/apis/apps/v1beta1",
    "/apis/apps/v1beta2",
    "/apis/authentication.k8s.io",
    "/apis/authentication.k8s.io/v1",
    "/apis/authentication.k8s.io/v1beta1",
    "/apis/authorization.k8s.io",
    "/apis/authorization.k8s.io/v1",
    "/apis/authorization.k8s.io/v1beta1",
    "/apis/autoscaling",
    "/apis/autoscaling/v1",
    "/apis/autoscaling/v2beta1",
    "/apis/batch",
    "/apis/batch/v1",
    "/apis/batch/v1beta1",
    "/apis/certificates.k8s.io",
    "/apis/certificates.k8s.io/v1beta1",
    "/apis/crd.projectcalico.org",
    "/apis/crd.projectcalico.org/v1",
    "/apis/events.k8s.io",
    "/apis/events.k8s.io/v1beta1",
    "/apis/extensions",
    "/apis/extensions/v1beta1",
    "/apis/networking.k8s.io",
    "/apis/networking.k8s.io/v1",
    "/apis/policy",
    "/apis/policy/v1beta1",
    "/apis/rbac.authorization.k8s.io",
    "/apis/rbac.authorization.k8s.io/v1",
    "/apis/rbac.authorization.k8s.io/v1beta1",
    "/apis/storage.k8s.io",
    "/apis/storage.k8s.io/v1",
    "/apis/storage.k8s.io/v1beta1",
    "/healthz",
    "/healthz/autoregister-completion",
    "/healthz/etcd",
    "/healthz/ping",
    "/healthz/poststarthook/apiservice-openapi-controller",
    "/healthz/poststarthook/apiservice-registration-controller",
    "/healthz/poststarthook/apiservice-status-available-controller",
    "/healthz/poststarthook/bootstrap-controller",
    "/healthz/poststarthook/ca-registration",
    "/healthz/poststarthook/generic-apiserver-start-informers",
    "/healthz/poststarthook/kube-apiserver-autoregistration",
    "/healthz/poststarthook/rbac/bootstrap-roles",
    "/healthz/poststarthook/start-apiextensions-controllers",
    "/healthz/poststarthook/start-apiextensions-informers",
    "/healthz/poststarthook/start-kube-aggregator-informers",
    "/healthz/poststarthook/start-kube-apiserver-informers",
    "/logs",
    "/metrics",
    "/openapi/v2",
    "/swagger-2.0.0.json",
    "/swagger-2.0.0.pb-v1",
    "/swagger-2.0.0.pb-v1.gz",
    "/swagger.json",
    "/swaggerapi",
    "/version"
  ]
}
But when I tries to hit http://<master IP>:8001/ui I am not able to see Kubernetes dashboard. Instead I see following output
{
  "paths": [
    "/apis",
    "/apis/",
    "/apis/apiextensions.k8s.io",
    "/apis/apiextensions.k8s.io/v1beta1",
    "/healthz",
    "/healthz/etcd",
    "/healthz/ping",
    "/healthz/poststarthook/generic-apiserver-start-informers",
    "/healthz/poststarthook/start-apiextensions-controllers",
    "/healthz/poststarthook/start-apiextensions-informers",
    "/metrics",
    "/openapi/v2",
    "/swagger-2.0.0.json",
    "/swagger-2.0.0.pb-v1",
    "/swagger-2.0.0.pb-v1.gz",
    "/swagger.json",
    "/swaggerapi",
    "/version"
  ]
}
Could you please help me resolving dashboard issue?
Thanks in advance
 aniketksh
on 2 Apr 2018
aniketksh
on 2 Apr 2018
Related issues
 maciaszczykm
·
4Comments
maciaszczykm
·
4Comments
 minminmsn
·
4Comments
maciaszczykm
·
3Comments
minminmsn
·
4Comments
maciaszczykm
·
3Comments
 Eddman
·
4Comments
Eddman
·
4Comments
 mhobotpplnet
·
3Comments
mhobotpplnet
·
3Comments
Most helpful comment
You can also try to access
http://localhost:8001/api/v1/proxy/namespaces/kube-system/services/kubernetes-dashboard/. It requires a bit different set of privileges to access.