Dashboard: Different results in dashboard and `kubectl top pod`
I'm running on GCE (kubernetes 1.6.4)
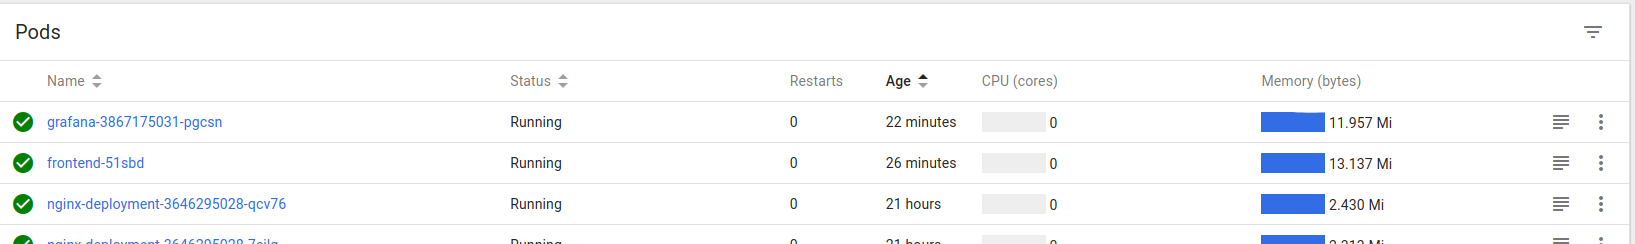
Currently, I see this picture in dashboard, it shows usage of 500MB:

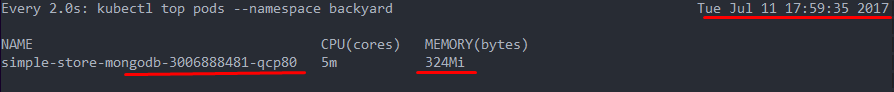
and kubectl top pod .. shows 324MB
Why I see such difference?
 wclr
wclr
All 14 comments

I don't know how kubectl checks usage but this is probably why.
 floreks
on 11 Jul 2017
floreks
on 11 Jul 2017
Sorry if stupid question. What are memory caches in pods? Are they in RAM or something else?
wclr
on 11 Jul 2017
It's related to how heapster exposes metrics. It exposes 2 metric names to get memory usage:
memory/usage - Total memory usage.
memory/cache - Cache memory usage.
I haven't checked the code so I don't know what exactly gets cached but total memory usage contains also the cache. I guess kubectl might get current usage where we display overall usage. OSes tend not to free memory when it is no longer used. This value might be the maximum value that was used by the pod at some point and system just did not freed unused memory. This is only my assumption.
Are they in RAM or something else?
Usually yes, but it also depends on the system. It might keep some "RAM cache" on a disk file.
floreks
on 11 Jul 2017
Some people on kube team may help to find this out? Maybe you ping them to draw attention to this issue?
wclr
on 11 Jul 2017
I don't think this is an issue. Probably kubectl by default displays all memory usage - cache and we are displaying all memory usage including cache.
_Sent from my LGE Nexus 5X using FastHub_
floreks
on 11 Jul 2017
I have looked into this a bit and the difference is that we are using memory/usage metric and kubectl gets memory/working_set. From the heapster doc:
memory/usage - Total memory usage.
memory/working_set - Total working set usage. Working set is the memory being used and not easily dropped by the kernel.
I have checked the output of heapster, kubectl top and dashboard.
Working set
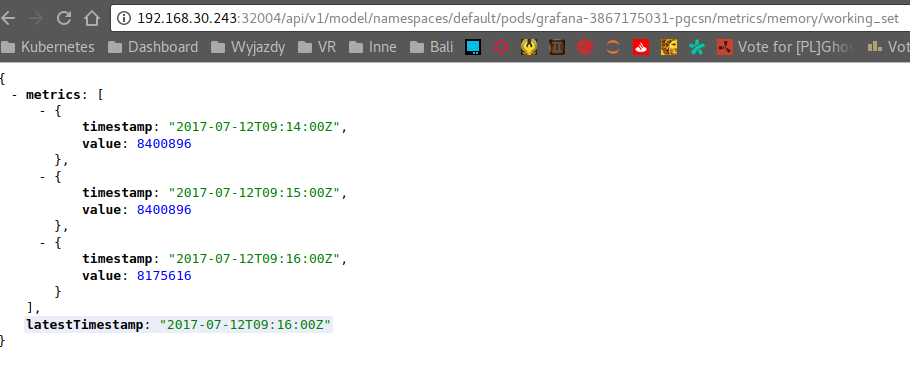

8175616 bytes ~= 7.79 Mi
Total memory usage
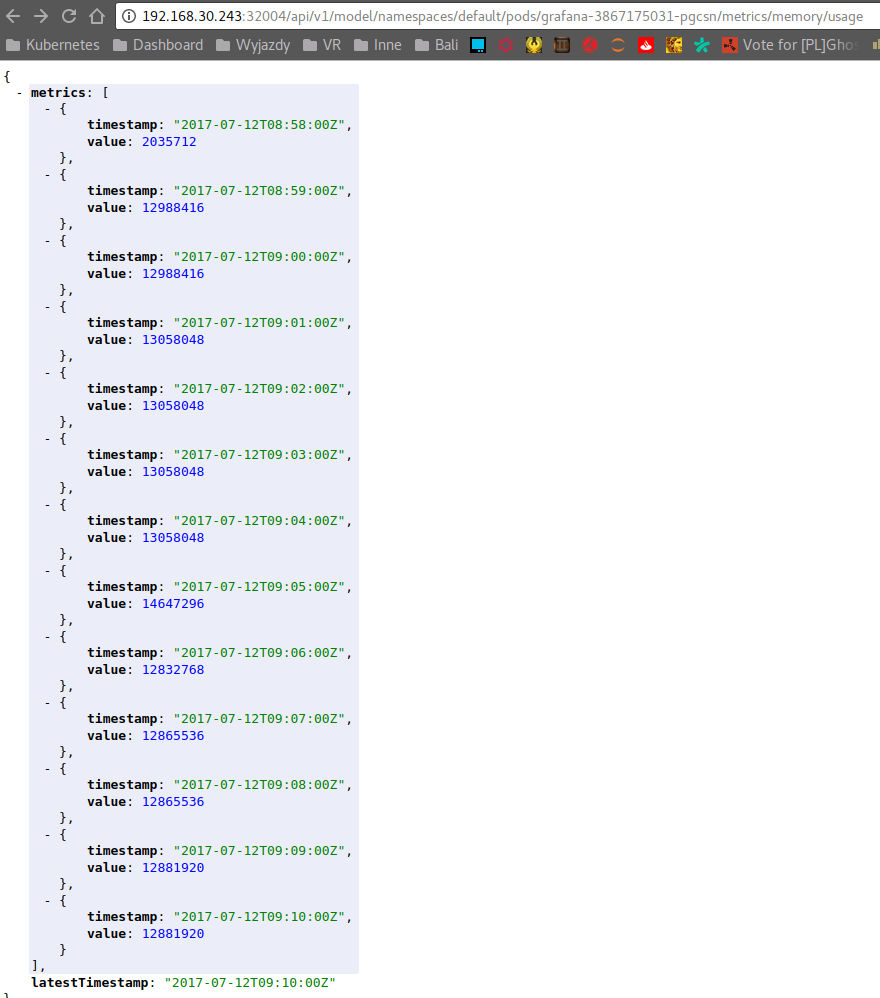
12881920 bytes ~= 12.28 Mi
The question is if we should switch our memory usage metrics to working set to be consistent with kubectl?
@kubernetes/dashboard-maintainers
floreks
on 12 Jul 2017
What is the best value to plan overall memory capacity of the cluster/nodes to accommodate pods? I believe max value?
wclr
on 12 Jul 2017
What is the best value to plan overall memory capacity of the cluster/nodes to accommodate pods? I believe max value?
I think max value will be a good choice for most scenarios unless you strictly need to minimize overall cost.
I think this is resolved. Closing.
floreks
on 18 Jul 2017
Ok, thanks for the help.
wclr
on 19 Jul 2017
I just wanted to add - I think this is very unexpected and confusing. I have several pods that report 400MB or so when I list them via kubectl top and 800MB with the Dashboard.
Users use these to configure Horizontal Pod Autoscaling, and out of memory kill limits. Whatever is shown by the Dashboard and Kubectl should be consistent with whatever is used by the HPAs.
 svperfecta
on 1 Sep 2017
svperfecta
on 1 Sep 2017
I was planning to update it before next release. It's just the matter of changing endpoint we are using to get memory metrics.
floreks
on 1 Sep 2017
When the memory limits are set on the container, which metric would be used by K8s to check the memory usage (and eventually restart the pod if the resource limit thresholds are exceeded)? memory/usage or memory/working_set
 rakeshvanga
on 5 Apr 2019
rakeshvanga
on 5 Apr 2019
Kubernetes (on linux) uses cgroups to limit the memory and let pods get killed if the use to much.
The cgroup limits do also consider the caches, see 2.2.1 Accounting details:
https://www.kernel.org/doc/Documentation/cgroup-v1/memory.txt
So so memory/usage should be the correct metric and kubectl top pods is currently not a good source to determine the limits.
Though one has to consider that the kernel will free caches before killing the processes and a lot is cached. So for good tuning of requests the working set is most significant metric, but leave some buffer for caches.
 juliantaylor
on 7 Nov 2019
juliantaylor
on 7 Nov 2019
Is there a way to access memory/usage from kubectl?
 malusm
on 4 Feb 2020
malusm
on 4 Feb 2020
Related issues
 maciaszczykm
·
3Comments
maciaszczykm
·
3Comments
 puja108
·
5Comments
puja108
·
5Comments
 Eddman
·
4Comments
Eddman
·
4Comments
 lukmanulhakimd
·
4Comments
lukmanulhakimd
·
4Comments
 eloyekunle
·
3Comments
eloyekunle
·
3Comments
Most helpful comment
I just wanted to add - I think this is very unexpected and confusing. I have several pods that report 400MB or so when I list them via
kubectl topand 800MB with the Dashboard.Users use these to configure Horizontal Pod Autoscaling, and out of memory kill limits. Whatever is shown by the Dashboard and Kubectl should be consistent with whatever is used by the HPAs.