Dash: Plotly express scatter_mapbox does not show map[BUG]
I am trying to insert a scatter_mapbox map with openstreetmap layer following this example:
https://plot.ly/python/mapbox-layers/#openstreetmap-tiles-no-token-needed
But I only get a blank figure. scatter_geo works normally. The above example works in a Jupyter notebook but not in m dash app
Is this a known bug?
 fccoelho
All 17 comments
Can you confirm that you're running the very latest version of plotly which is 4.1.1? The features used in that documentation page came out quite recently.
 nicolaskruchten
on 8 Sep 2019
nicolaskruchten
on 8 Sep 2019
also the latest version of dash, as plotly.js is bundled with dash core components.
 chriddyp
on 9 Sep 2019
chriddyp
on 9 Sep 2019
Ok here are the versions I have:
for dash
dash==1.2.0
dash-core-components==1.1.2
dash-daq==0.1.7
dash-html-components==1.0.1
dash-renderer==1.0.1
dash-table==4.2.0
for plotly:
plotly==4.1.1
plotly-express==0.4.0
OK, so those versions should work. If you could share a minimal version of the object you're passing to dcc.Graph's figure argument I might be able to see what's wrong.
nicolaskruchten
on 9 Sep 2019
Hi @nicolaskruchten ,
you can find a minimal version on this gist, including the data points.
I appreciate any help. By the way, I have only tested the app on Firefox, maybe it will render properly on chrome.
fccoelho
on 9 Sep 2019
I'm on chrome and I have the same issue.
 dirac-dc
on 29 Jan 2020
dirac-dc
on 29 Jan 2020
Hello, same here. My figure is
fig = px.scatter_mapbox(data, lat="LATITUD", lon="LONGITUD",
                        hover_name="PROYECTO",
                        hover_data=["STOCK TOTAL", "$/M2 Prom"],
                        color_discrete_sequence=["red"],
                        zoom=13,
                        height=800)
fig.update_layout(mapbox_style="open-street-map")
fig.update_layout(margin={"r": 0, "t": 0, "l": 0, "b": 0})
and that is what I pass to dcc.Graph's figure item.
versions:
dash==1.8.0
dash-core-components==1.7.0
dash-html-components==1.0.2
dash-renderer==1.2.3
dash-table==4.6.0
plotly==4.5.0
plotly-express==0.4.1
scatter_mapbox works as a standalone graph in the browser (Firefox) and my code works with a scatter type figure.
 susca
on 7 Feb 2020
susca
on 7 Feb 2020
I am facing the same issue. Any workaround for this?
On the latest versions of plotly and dash.
 sandeshpatkar
on 30 Apr 2020
sandeshpatkar
on 30 Apr 2020
One thing to look out for is to ensure that lat and lon are correctly scaled: lat should be within [-90,90] and lon should be within [-180,180], which it looks like is not the case in the gist above (sorry @fccoelho for never responding, that was rude of me!) ... I don't believe that Mapbox accepts lat values of 7461860.1500282902270 ?
nicolaskruchten
on 1 May 2020
This is a projection issue and easily solvable. Thanks for the reply! Pleas
add this to the documentation of the function: that the coordinates must be
in WGS-84
On Fri, May 1, 2020 at 9:31 AM Nicolas Kruchten notifications@github.com
wrote:
One thing to look out for is to ensure that lat and lon are correctly
scaled: lat should be within [-90,90] and lon should be within [-180,180],
which it looks like is not the case in the gist above (sorry @fccoelho
https://github.com/fccoelho for never responding, that was rude of me!)
... I don't believe that Mapbox accepts lat values of
7461860.1500282902270 ?—
You are receiving this because you were mentioned.
Reply to this email directly, view it on GitHub
https://github.com/plotly/dash/issues/914#issuecomment-622369267, or
unsubscribe
https://github.com/notifications/unsubscribe-auth/AABCGWYKYB5YBVOL35IM2RLRPK6LFANCNFSM4IUS5ZIA
.
fccoelho
on 1 May 2020
One thing to look out for is to ensure that lat and lon are correctly scaled: lat should be within [-90,90] and lon should be within [-180,180], which it looks like is not the case in the gist above (sorry @fccoelho for never responding, that was rude of me!) ... I don't believe that Mapbox accepts lat values of
7461860.1500282902270?
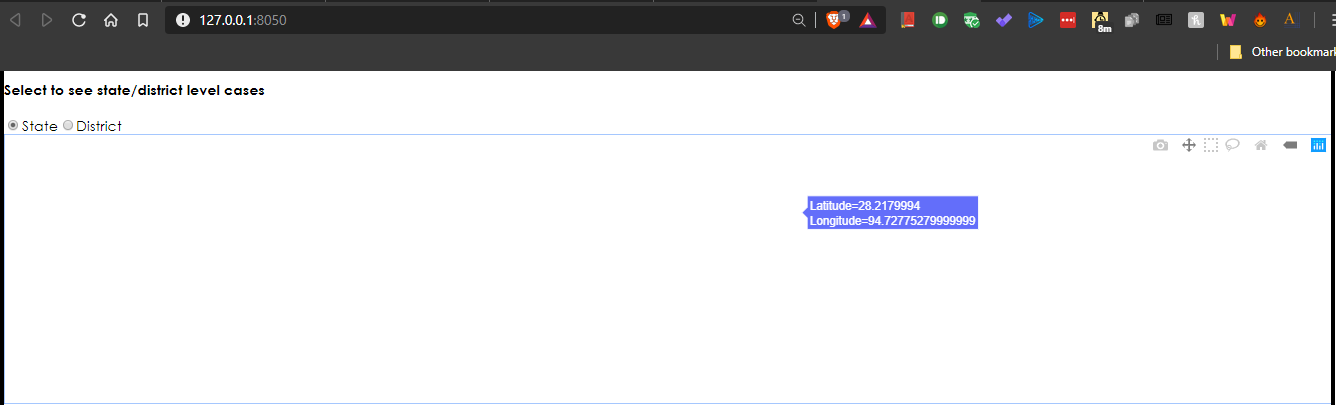
Hi, all my latitude and longitudes are within the limits mentioned by you, and inspite of that, I get a blank map.
I have attached the output I am getting. Also, the graphs displayed on Scatter Plots on Mapbox in Python website, do not show the map. (Image attached)
The same code used on the website produces the correct output (see attached image)
My output with my own data:
Output on plotly website vs. output in my Jupyter notebook:

Edit: When I add the same code from plotly website for Dash, I get output which has no map. Only the points.
sandeshpatkar
on 1 May 2020
This seems like a mapbox token-related issue... The examples on our site are loading for me e.g. https://plotly.com/python/scattermapbox/ and if they're loading in your notebook it means you've got a token installed. Is that token set up in your Dash app? If you open up the Javascript Developer Tools you might see some error messages that guide you but my guess is that the Mapbox token you're using somehow doesn't work with your app, possibly because it's locked to work only on some domains.
nicolaskruchten
on 1 May 2020
if it's a token issue how are the geographic locations being marked. @nicolaskruchten
 manikanta13
on 4 May 2020
manikanta13
on 4 May 2020
Tokens serve only to retrieve map tiles, so that's consistent with what the screenshots above show: everything is being draw except the underlying tiles.
nicolaskruchten
on 4 May 2020
You can check out our Mapbox Layers and Tokens docs here, which go into a bit more detail: https://plotly.com/python/mapbox-layers/
nicolaskruchten
on 4 May 2020
This seems like a mapbox token-related issue... The examples on our site are loading for me e.g. https://plotly.com/python/scattermapbox/ and if they're loading in your notebook it means you've got a token installed. Is that token set up in your Dash app? If you open up the Javascript Developer Tools you might see some error messages that guide you but my guess is that the Mapbox token you're using somehow doesn't work with your app, possibly because it's locked to work only on some domains.
Hi @nicolaskruchten the issue was caused due to one of the extensions installed in Chrome. Since I had the extension synced across all my devices, I was facing it everywhere and it looked to me that the problem was in mapbox itself. Sorry for the inconvenience!
Note for future users: Disable all extensions and try.
sandeshpatkar
on 5 May 2020
OK, great! I'm going to close this issue now, and if anything like this happens to someone else, please open a new issue so we can diagnose your specific situation :)
nicolaskruchten
on 5 May 2020
Related issues
 Chris8080
·
3Comments
Chris8080
·
3Comments
 AngusCui
·
3Comments
AngusCui
·
3Comments
 rpkyle
·
3Comments
rpkyle
·
3Comments
 T4rk1n
·
3Comments
T4rk1n
·
3Comments
 KyleKing
·
4Comments
KyleKing
·
4Comments
Most helpful comment
One thing to look out for is to ensure that lat and lon are correctly scaled: lat should be within [-90,90] and lon should be within [-180,180], which it looks like is not the case in the gist above (sorry @fccoelho for never responding, that was rude of me!) ... I don't believe that Mapbox accepts lat values of
7461860.1500282902270?