Dart-code: Extension causes high CPU usage even when idle
I installed the Flutter setup on my Windows 10 PC via the official documentation and am able to deploy the app as well.
However, I am getting very high CPU usage even when IDE ( Visual Studio Code ) is not compiling.
I am able to confirm that the extension is causing the usage since the usage drops when I disable the extensions.

 purezen
All 21 comments
Can confirm the issue doesn't exist in Linux ( Ubuntu based distro ).
Though there is constant cpu utilization similar to Windows, but it is very less.
purezen
on 10 Jul 2020
Thanks for the report! Could you try enabling the analysis server instrumentation log and capturing a log file this is happening?
Note: The log my include parts of your source code, so please reproduce this on a simple/public repository.
Thanks!
 DanTup
on 13 Jul 2020
purezen
on 13 Jul 2020
DanTup
on 13 Jul 2020
purezen
on 13 Jul 2020
Thanks! There's not much going on in the server, so I wonder if it may be extension code. Could you try opening VS Code and waiting for 60s or so (to ensure any analysis work the server may have started is complete), and then (assuming the CPU is still high), run this command in a terminal:
code --status
And paste the full output here. Thanks!
DanTup
on 13 Jul 2020
Would like to add I am using an HP Spectre which uses an SSD. Has a fresh installation of Win 10. Not done much apart from browsing other than VS Code ofc. Anti-virus is also active. Also apart from this incident nothing else has caused this much processor usage. It's idle most of the time so from my side I am pretty sure it's because of the VS Code extensions.
```PS E:\app_dev\flutter_gallery> code --status
Version: Code 1.47.0 (d5e9aa0227e057a60c82568bf31c04730dc15dcd, 2020-07-09T08:02:06.629Z)
OS Version: Windows_NT x64 10.0.18362
CPUs: Intel(R) Core(TM) i5-8250U CPU @ 1.60GHz (8 x 1800)
Memory (System): 7.85GB (2.26GB free)
VM: 0%
Screen Reader: no
Process Argv:
GPU Status: 2d_canvas: enabled
flash_3d: enabled
flash_stage3d: enabled
flash_stage3d_baseline: enabled
gpu_compositing: enabled
multiple_raster_threads: enabled_on
oop_rasterization: disabled_off
protected_video_decode: enabled
rasterization: enabled
skia_renderer: disabled_off_ok
video_decode: enabled
viz_display_compositor: enabled_on
viz_hit_test_surface_layer: disabled_off_ok
webgl: enabled
webgl2: enabled
CPU % Mem MB PID Process
0 75 21916 code main
0 252 3080 gpu-process
0 174 8148 window (main.dart - flutter_gallery - Visual Studio Code)
0 69 3548 extensionHost
0 4 4016 C:\WINDOWSsystem32\cmd.exe /d /s /c ""C:\Dev Setup\flutter\bin\cache\dart-sdk\bin\dart.exe" "C:\Dev Setup\flutter\bin\cache\dart-sdk\bin\snapshots\analysis_server.dart.snapshot" "--client-id=VS-Code" "--client-version=3.12.2" "--instrumentation-log-file=C:\Users\purezen\Desktop\logFile2.txt""
0 209 6604 "C:\Dev Setup\flutter\bin\cache\dart-sdk\bin\dart.exe" "C:\Dev Setup\flutter\bin\cache\dart-sdk\bin\snapshots\analysis_server.dart.snapshot" "--client-id=VS-Code" "--client-version=3.12.2" "--instrumentation-log-file=C:\Users\purezen\Desktop\logFile2.txt"
0 11 19680 console-window-host (Windows internal process)
0 4 15816 C:\WINDOWSsystem32\cmd.exe /d /s /c ""C:\Dev Setup\flutter\bin\flutter.bat" "daemon""
0 11 12948 console-window-host (Windows internal process)
0 122 17484 "C:\Dev Setup\flutter\bin\cache\dart-sdk\bin\dart.exe" --packages="C:\Dev Setup\flutter\packages\flutter_tools.packages" "C:\Dev Setup\flutter\bin\cache\flutter_tools.snapshot" "daemon"
0 66 3884 C:\WINDOWS\System32\WindowsPowerShell\v1.0\powershell.exe
0 4 5452 C:\WINDOWSsystem32\cmd.exe /c ""C:\Users\purezen\AppData\Local\Programs\Microsoft VS Code\bin\code.cmd" --status"
0 34 6920 electron_node cli.js
1 58 8420 "C:\Users\purezen\AppData\Local\Programs\Microsoft VS Code\Code.exe" --status
2 29 7104 gpu-process
0 11 10208 watcherService
0 11 9888 console-window-host (Windows internal process)
0 34 15916 searchService
0 6 20688 console-window-host (Windows internal process)
0 83 9692 shared-process
0 26 16724 utility
0 14 21472 electron-crash-reporter
Workspace Stats:
| Window (main.dart - flutter_gallery - Visual Studio Code)
| Folder (flutter_gallery): 1972 files
| File types: class(235) dex(207) flat(125) xml(112) json(111) len(104)
| java(47) tab(38) keystream(35) at(35)
| Conf files: launch.json(1)
| Launch Configs: dart
PS E:\app_dev\flutter_gallery> ```
purezen
on 14 Jul 2020
@purezen in the output above, the CPU usage looks low (everything is 0 except for two processes) - which makes me wonder if the process using the CPU is orphaned (for ex. from a previous VS Code instance).
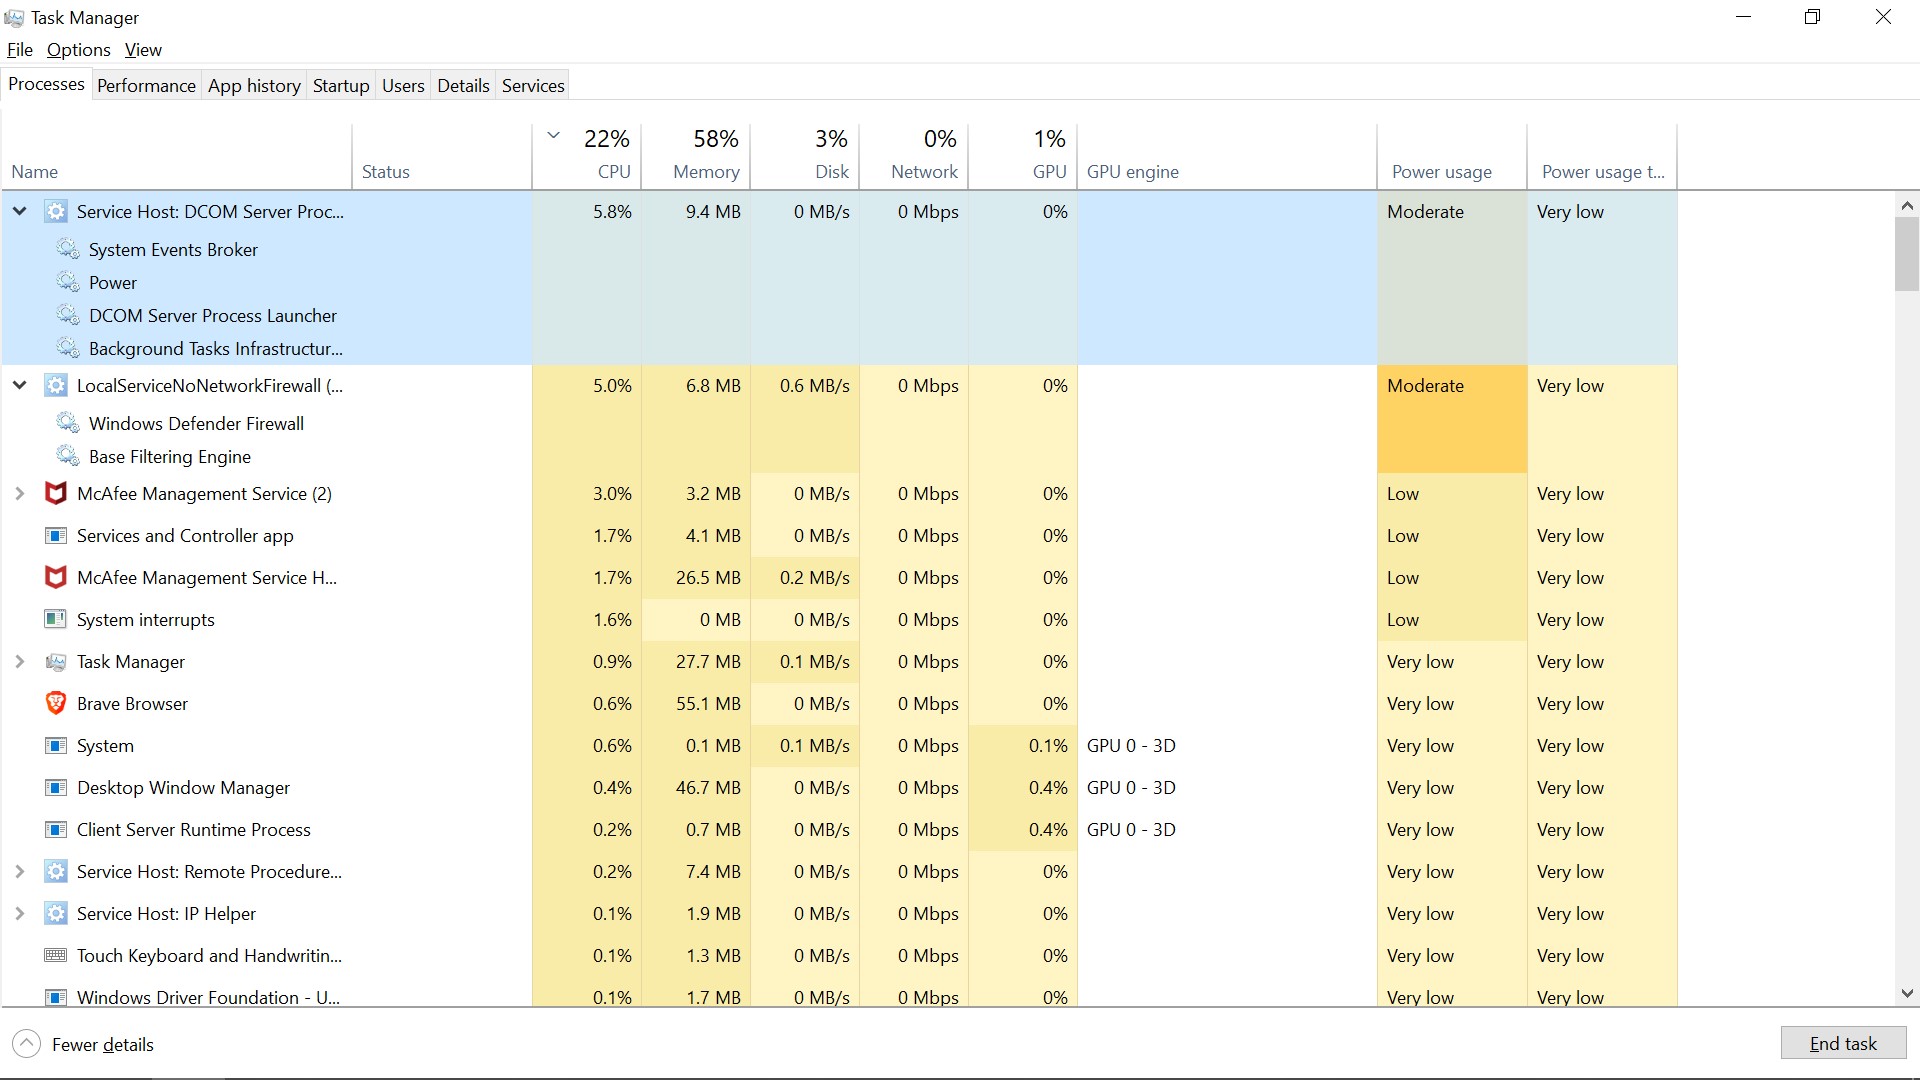
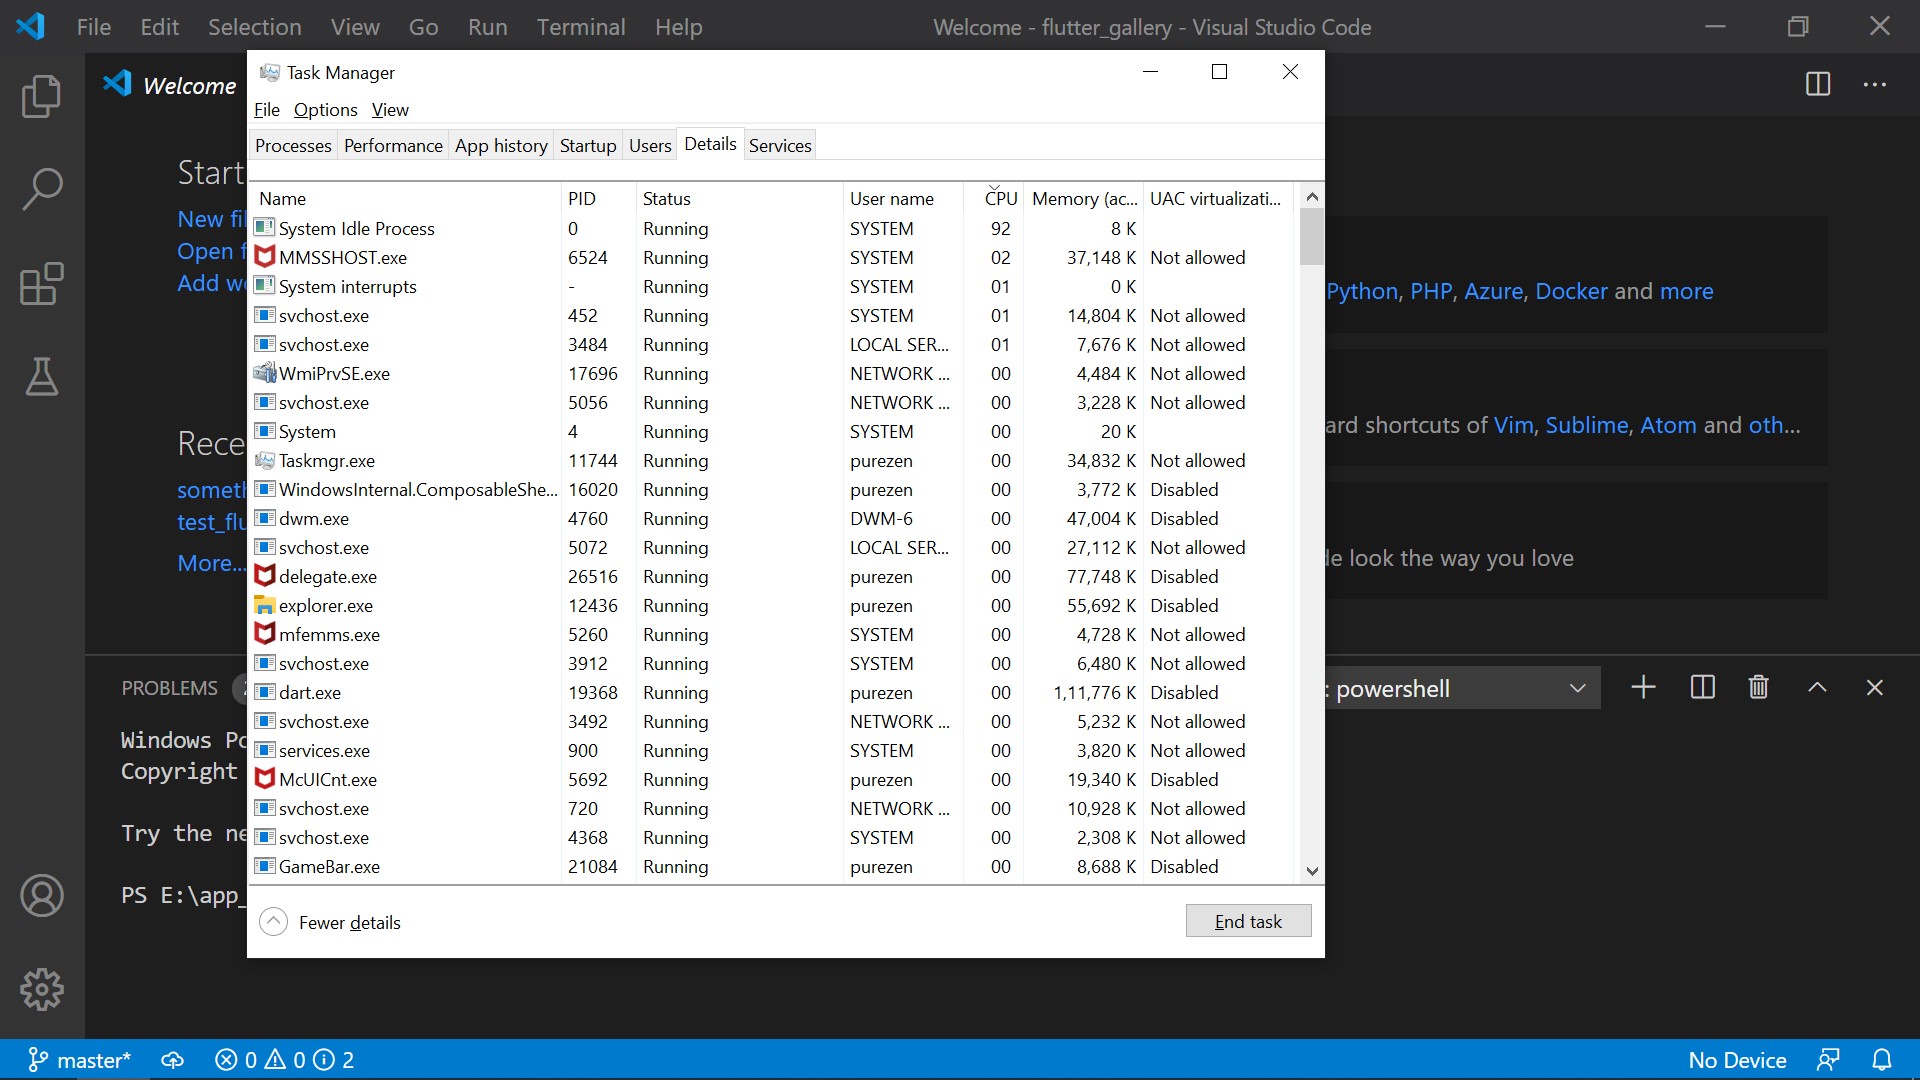
If you close VS Code, do any Dart processes remain? If not and this only happens while VS Code is open, could you get a screenshot of the Task Manager process tab when the CPU is high with the full "Command Line" column visible for the dart process that's using the CPU? Thanks!
DanTup
on 14 Jul 2020


 purezen
on 14 Jul 2020
purezen
on 14 Jul 2020
Forgot that the file names from my system are not going to be preserved. Will just tell what the images are for.
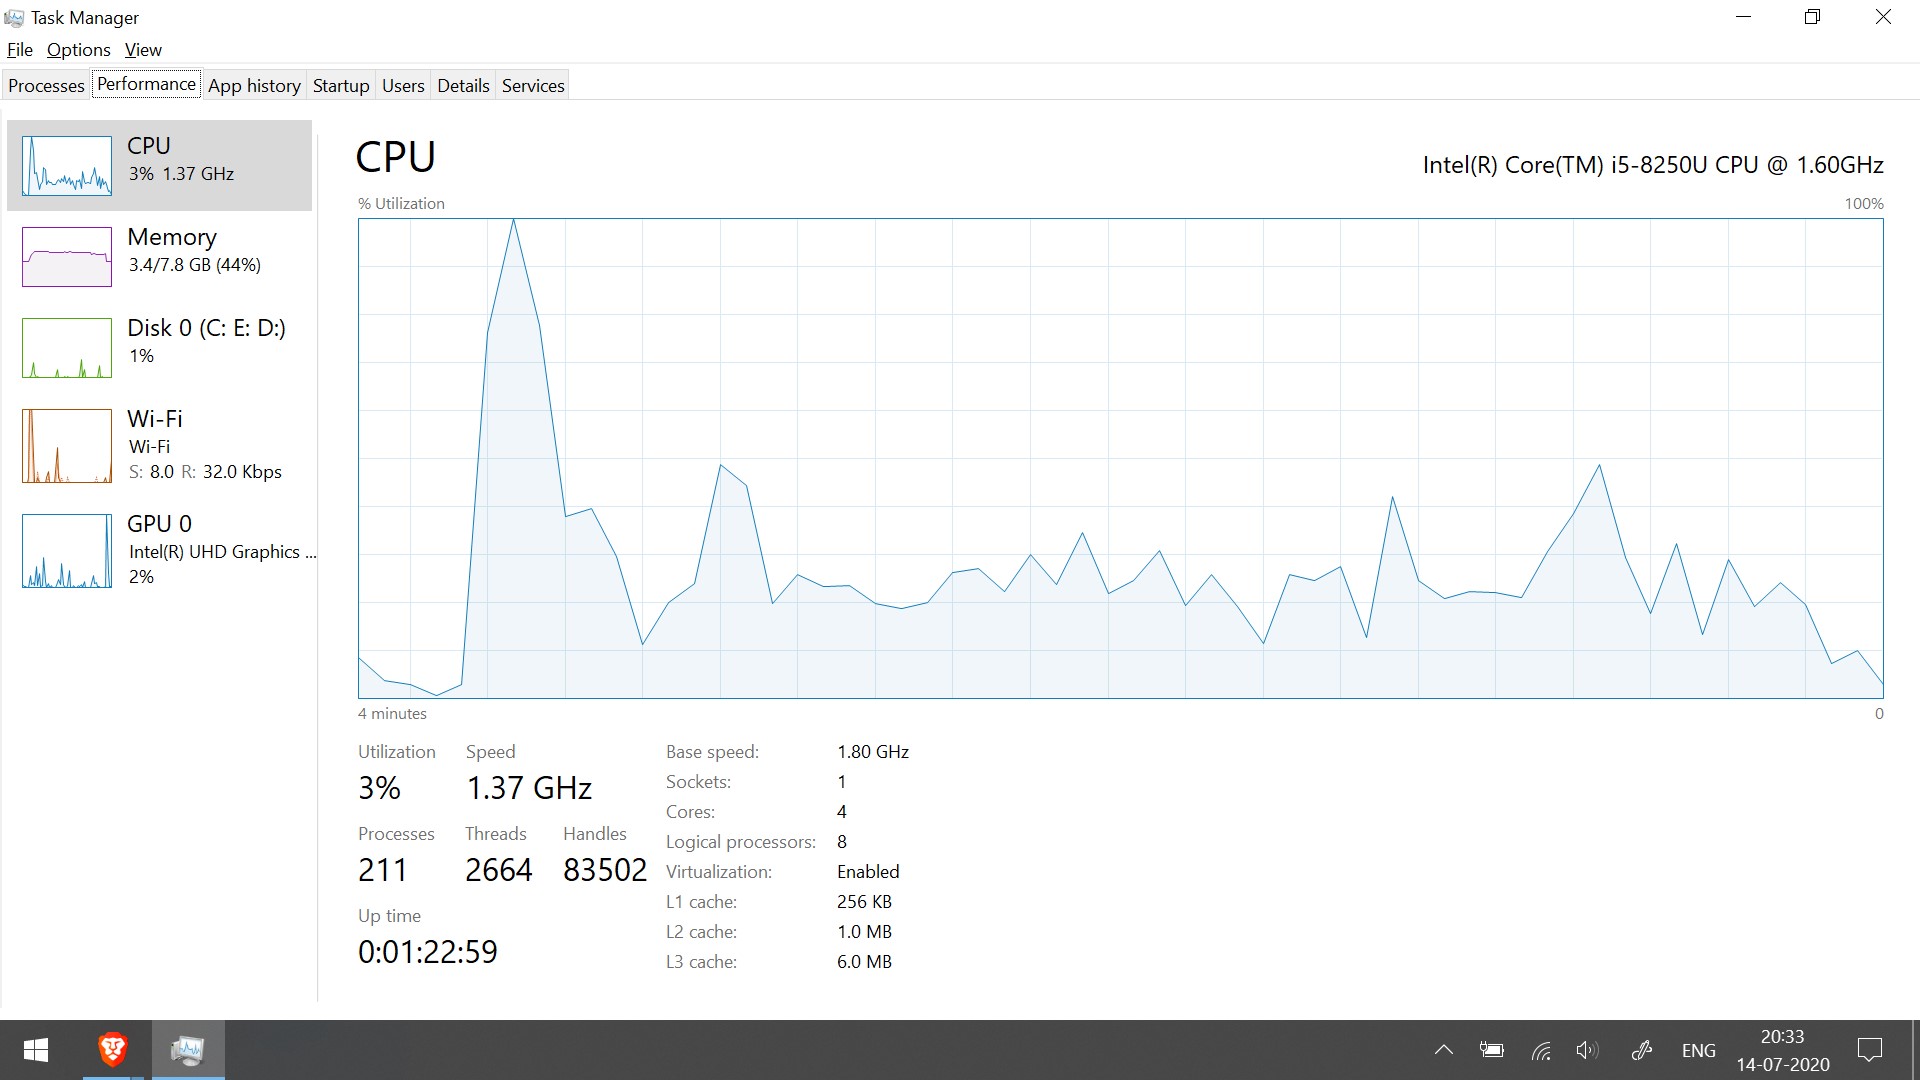
1st image shows CPU consumption before starting editor. It is negligible.
2nd image shows CPU consumption starting as soon as editor is started.
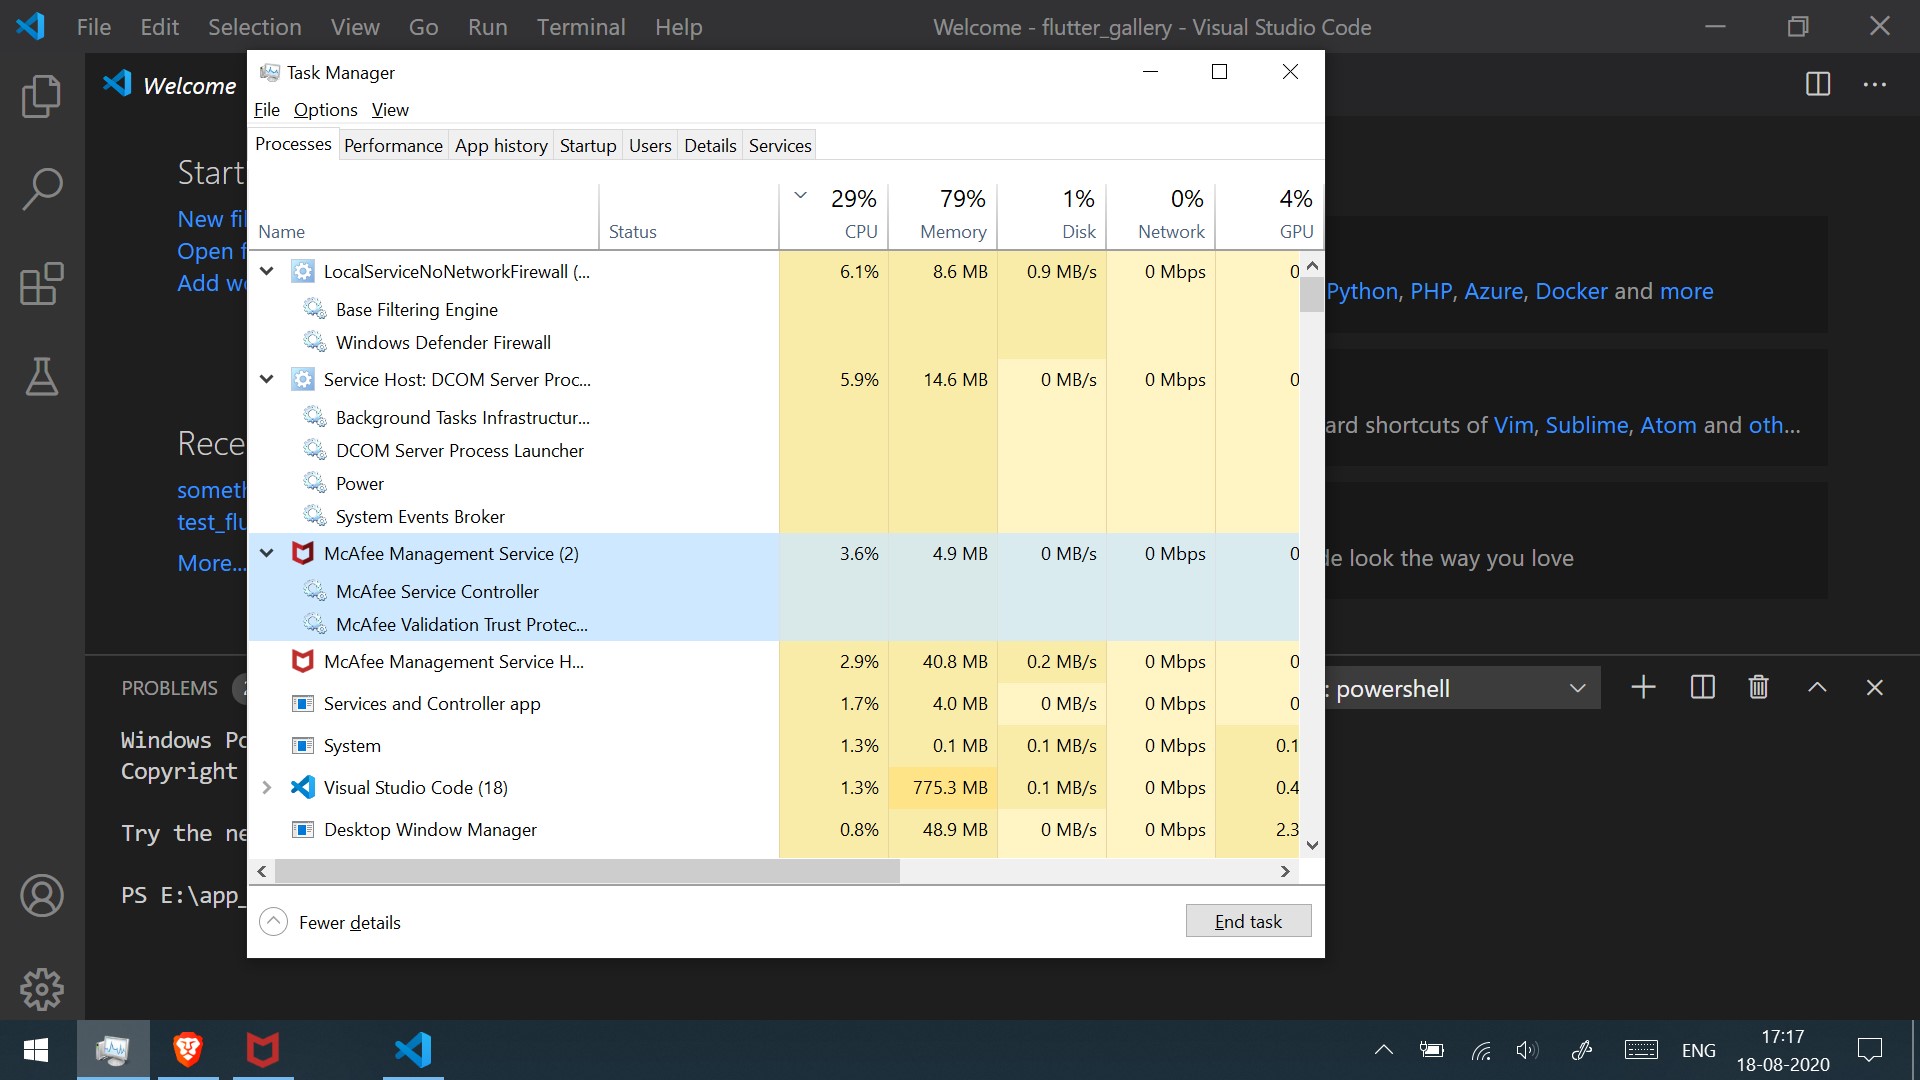
3rd image shows processes when editor is running.
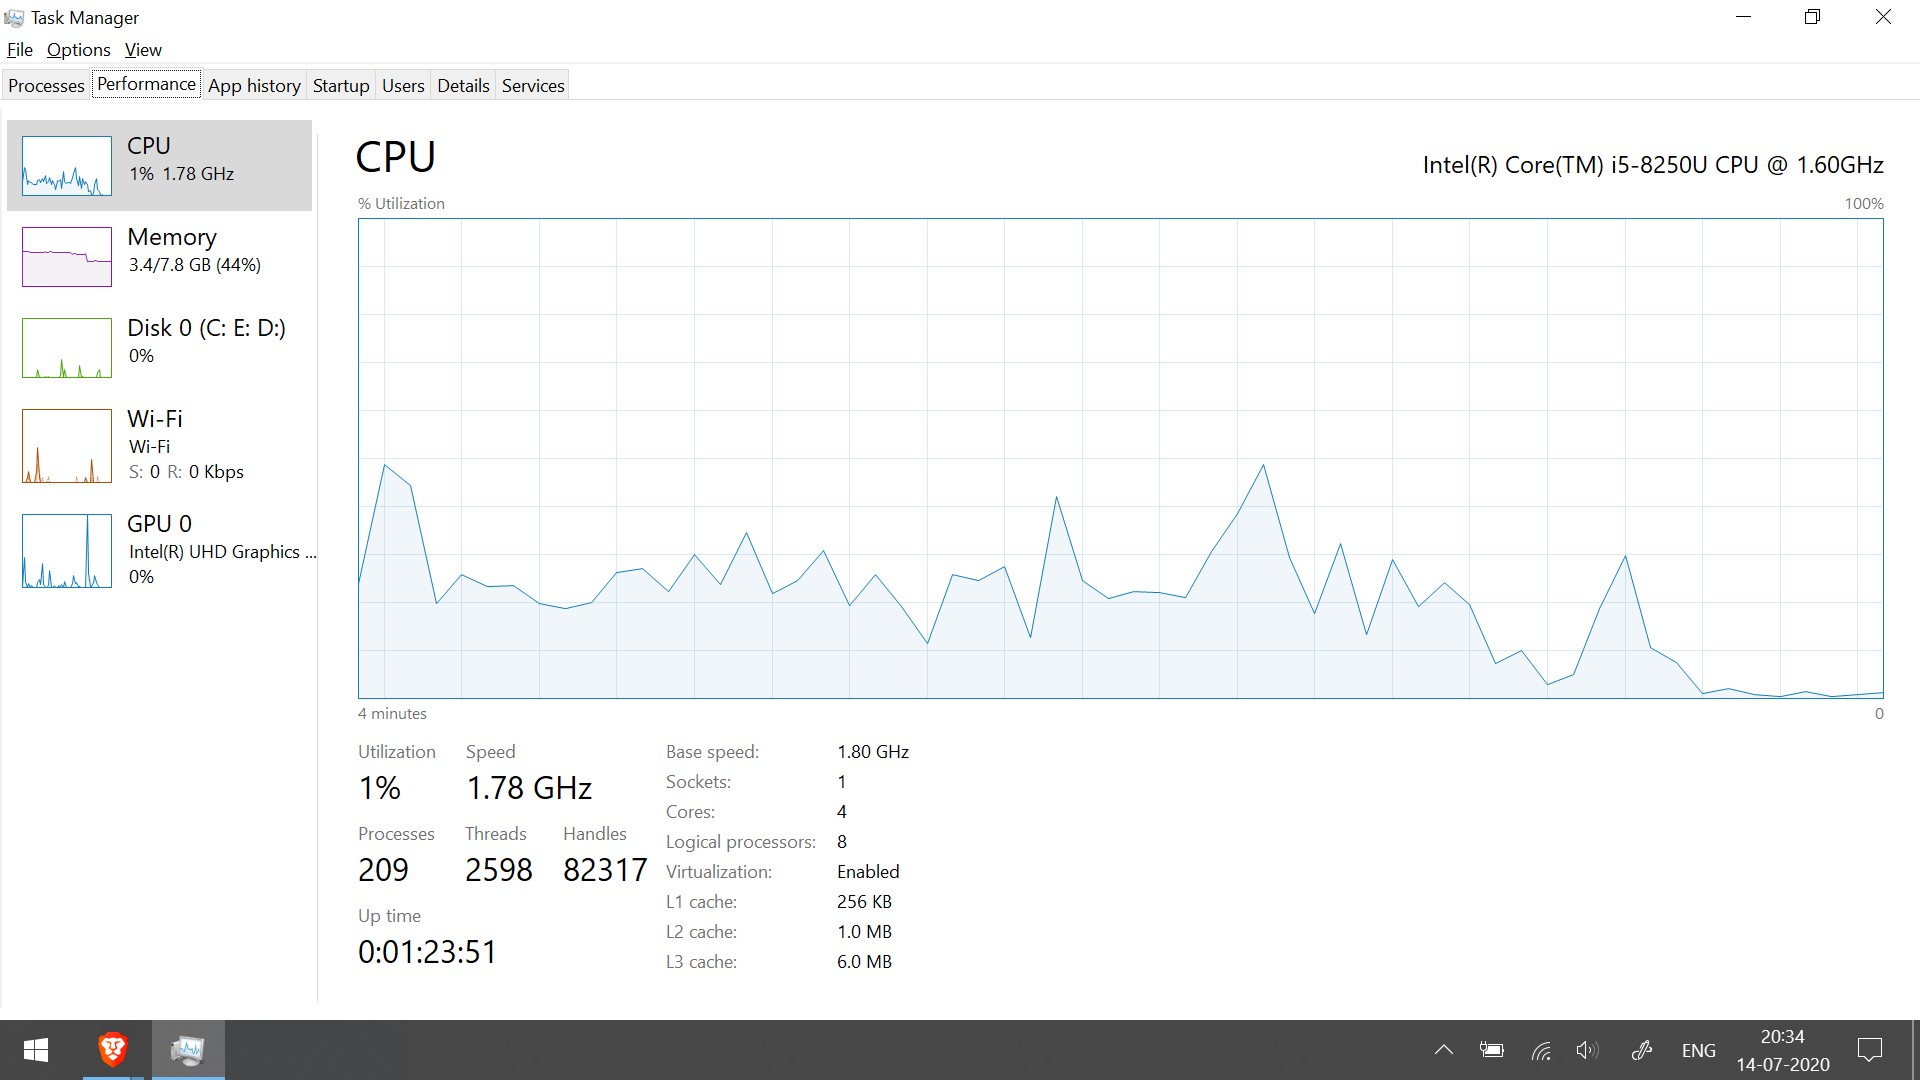
4th and 5th images show CPU consumption dropping after exiting editor.
purezen
on 14 Jul 2020
Just got another issue.. when I opened editor in Win it showed errors that the packages were not recognized. I deleted a .packages file and on next restart it asked to retrieve the packages. I did that an the issue got fixed. Also ran the flutter doctor -v command. Attaching the output below.

purezen
on 15 Jul 2020
@purezen in the screenshots, it looks like the CPU is being used by system processes/Defender and McAfee. Can you try opening VS Code with a non-Dart project and see if you see the same? From the screenshots and output of code --status it doesn't seem like the extension or Dart analysis server are consuming much CPU.
Just got another issue
Please file a separate issue here on GH for different problems, otherwise it becomes difficult to keep track of things (and what is/isn't fixed). Thanks!
DanTup
on 15 Jul 2020
You can see, I made a javascript file. The CPU usage dropped.

The CPU usage goes high only when editor has opened a Flutter app. Also goes down as soon as I disable those extensions.
Here is one more person with the same issue.. he's also pasted a screen shot of the CPU usage. https://www.reddit.com/r/FlutterDev/comments/ho0nym/high_cpu_usage_when_ide_is_idle/fy1qdqt/
Just to reiterate my flutter app ( not the sdk ) is not in the Win drive. Also I have switched from another OS.
purezen
on 15 Jul 2020
Just to reiterate my flutter app ( not the sdk ) is not in the Win drive
Do you mean it's just on a different disk, or that it's on a different type of filesystem?
Also I have switched from another OS.
Did you copy the project from the other machine?
Does this happen if you create a new Flutter project, or only with this particular project?
When you first open a project, there's some work to do to build a cache of things like the code completion items. This could cause higher CPU for a little while, but not forever. If you leave the project for a few minutes, does it ever go down, or does it stay like this indefinitely?
Also - do you have the option to temporarily disable McAfee and/or Defender to see if that makes any difference?
Thanks!
DanTup
on 15 Jul 2020
Do you mean it's just on a different disk, or that it's on a different type of filesystem?
It's on different partition, same disk
Did you copy the project from the other machine?
No
Does this happen if you create a new Flutter project, or only with this particular project?
Yes, with new project also ( checked again )
When you first open a project, there's some work to do to build a cache of things like the code completion items. This could cause higher CPU for a little while, but not forever. If you leave the project for a few minutes, does it ever go down, or does it stay like this indefinitely?
This goes on indefinitely.. after many system / editor restarts. Left my system plugged in in for around half an hour. CPU usage didn't come down.
Also - do you have the option to temporarily disable McAfee and/or Defender to see if that makes any difference?
Did that with disabling anti-virus. Issue persists. Attaching screenshot.

purezen
on 15 Jul 2020
Thanks for the testing! When you disable the antivirus, which processes show up on the Details tab of Task Manager as consuming the most CPU? (a screenshot of the Details tab sorted by CPU usage may be useful).
Also - on the Performance tab in Task Manager, if you click Options and change the view to Logical Processors (instead of Overall Usage), how does it look - is it one core at 100% and the rest low, or is it balanced over many cores?
DanTup
on 15 Jul 2020
This issue has been marked stale because it is tagged awaiting-info for 30 days with no activity. Remove the stale label or comment to prevent the issue being closed in 10 days.
![github-actions[bot] picture](https://avatars.githubusercontent.com/in/15368?v=4&s=40) github-actions[bot]
on 15 Aug 2020
github-actions[bot]
on 15 Aug 2020
Just checked again. McAfee ( firewall specifically ) seems to be the issue now.

purezen
on 18 Aug 2020
I think you'd need to troubleshoot McAfee to track this down. I don't think the VS Code extension or Dart analysis server are doing anything unusual, and it's McAfee consuming the CPU. There's some info on the McAfee website with some ideas for tracking down CPU issues:
I don't think this can be fixed in the VS Code extension. We have no control (or insight) into what McAfee is doing.
DanTup
on 24 Aug 2020
Hmm, removing McAfee seems to be the only way to go forward. Will have to rely on Windows defender if I do that.
purezen
on 24 Aug 2020
It may be worth going through some of the steps in the article above. It would be nice to track down why it's happening, I just don't think it's something I/Dart-Code can fix without any visibility/understanding of what McAfee is doing.
I'll close this as there's not currently anything to do here, but if you manage to track it down to something specific that is being caused by the VS Code extension (or Dart SDK), do shout so we can see if it's something that can be addressed. Thanks!
DanTup
on 24 Aug 2020
I'm on a non-dart non-flutter project. In Ionic 5. And dart.exe makes my fans spin like a jet. The Flutter and Dart VS Code extension is always enabled. I see the symbols (like flask) and dialogs when opening a TypeScript project. Why? It should only be enabled when using a dart project. This is not a correct behavior and the only extension I know with this behavior. But ok, this is maybe another issue. Anyway, dart.exe is working without reasons. In the last month, I didn't worked on a dart project.
 infacto
on 26 Oct 2020
infacto
on 26 Oct 2020
@infacto there was a regression in the last version of VS Code that was eagerly-activating extensions at startup (regardless of what project type you had opened) if they used a specific feature (which Dart does). It's been fixed today - see https://github.com/microsoft/vscode/issues/108578.
The fix will be in the Insiders release tomorrow (and presumably the next VS Code release - which I would expect is a week or two away based on the normal schedule).
As a workaround, if you go to your extensions list you can choose to disable it for specific workspaces (or globally if you're not currently using it at all).
Sorry for the bother, though unfortunately because it's a VS Code issue I'm unable to ship a fix for it myself.
DanTup
on 26 Oct 2020
Related issues
 CaferPoyrazoglu
·
4Comments
CaferPoyrazoglu
·
4Comments
 partounian
·
4Comments
partounian
·
4Comments
 ifredom
·
3Comments
ifredom
·
3Comments
 kinex
·
3Comments
kinex
·
3Comments
 rgb1380
·
3Comments
rgb1380
·
3Comments