Darknet: Can the avg loss by iteration be saved?
Can the data points (x=iteration,y=avg loss) used to draw 'chart.png' in the training process be saved as TXT file?
 Eve66666
All 8 comments
@Eve66666 @AlexeyAB
The same question. It could be nice if we can save F1,mAP, Ave Loss and IOU during training process.
I stopped training and when I restarted the training chart had lost information of last steps
 mfaramarzi
on 8 May 2020
mfaramarzi
on 8 May 2020
@mfaramarzi Just resume training with -chart chart.png at the end of training command.
 AlexeyAB
on 8 May 2020
AlexeyAB
on 8 May 2020
@mfaramarzi Just resume training with
-chart chart.pngat the end of training command.
Probably I was supposed to use this command before restarting the training process. Seems the previous "chart.png" is replaced with the above one !
mfaramarzi
on 8 May 2020
@mfaramarzi Just resume training with
-chart chart.pngat the end of training command.
Hello Alex,
Why loss drops down when I resume the training?
Thanks for all supports.
mfaramarzi
on 12 May 2020
May be you changed something
AlexeyAB
on 12 May 2020
@AlexeyAB
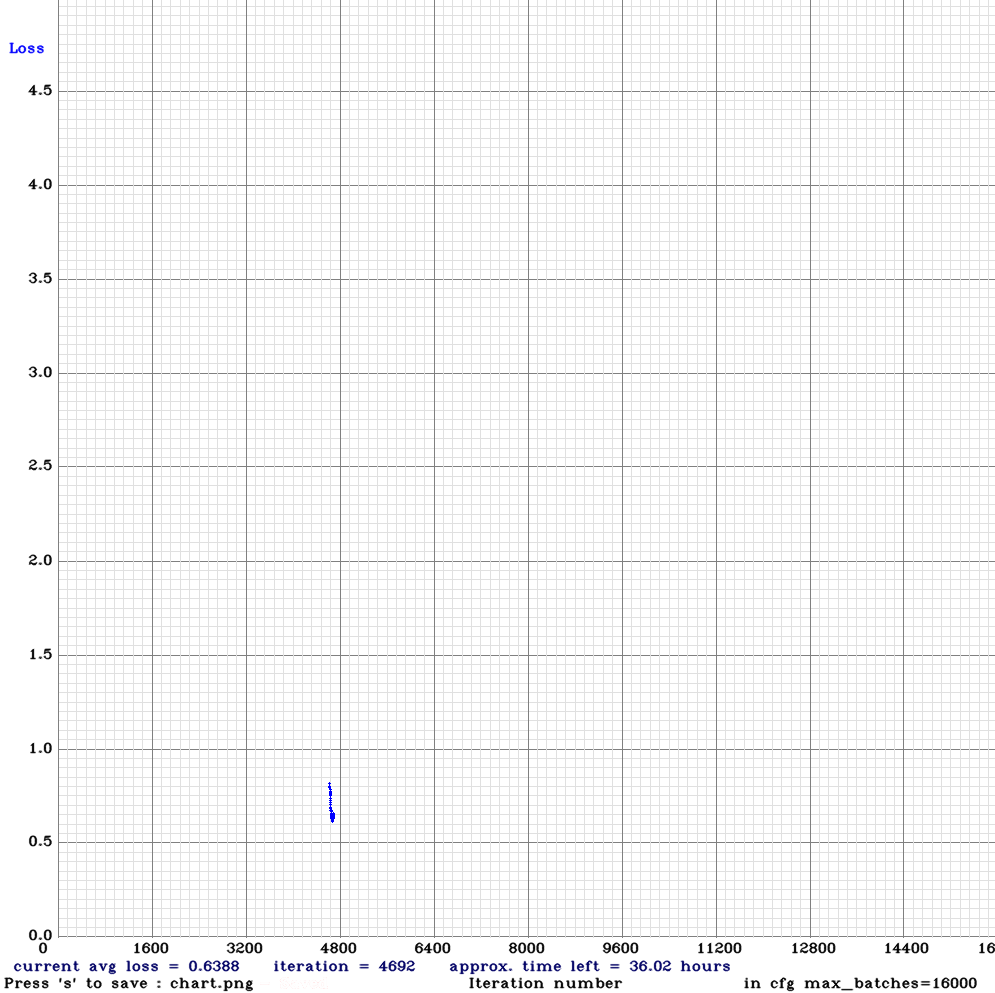
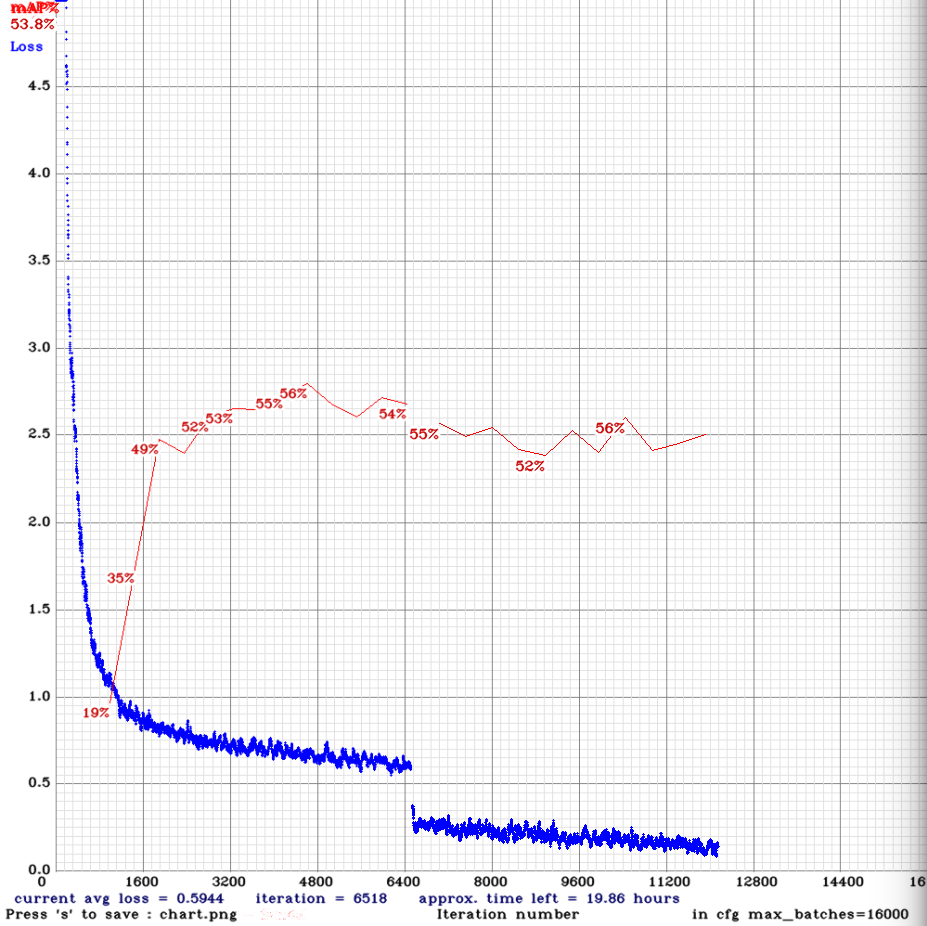
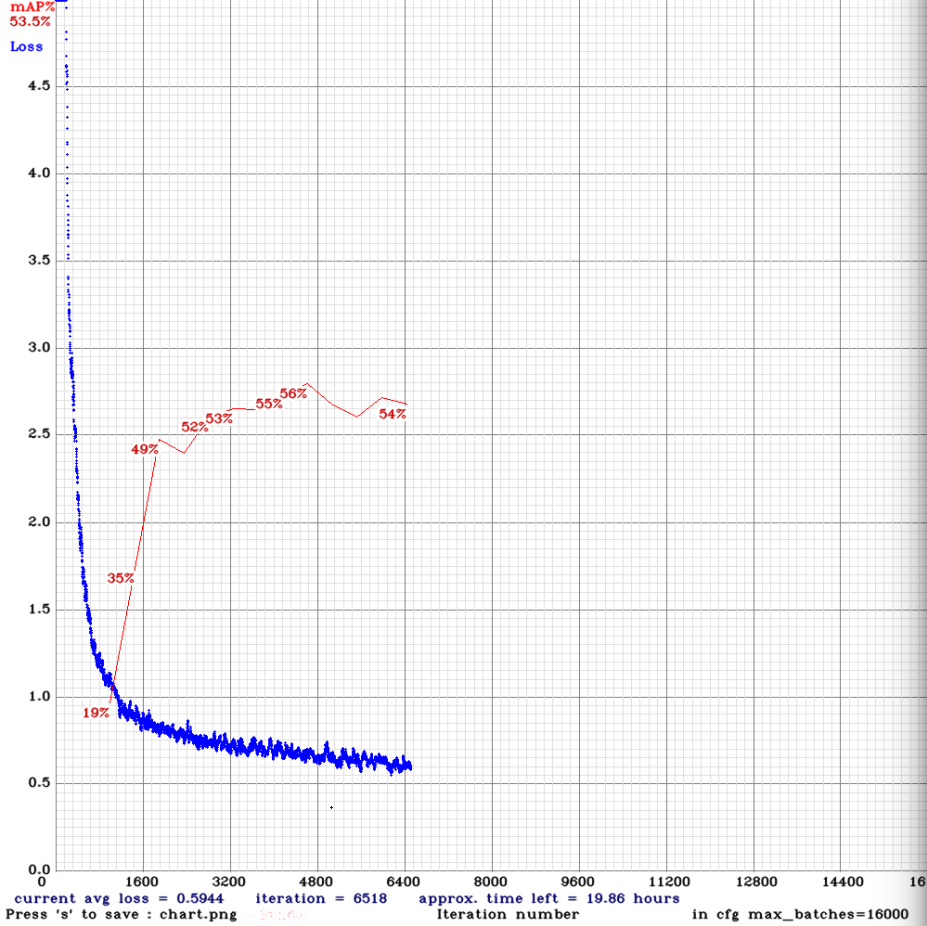
I stoped training at around 6400 iterations as below:
then I used the following command to resume it at 6000 iterations (to have some overlap):
./darknet detector train cfg/damage.data cfg/yolov3-obj.cfg backup/yolov3-obj_6000.weights -chart chart.png
but on the chart new points start appearing at the place it was paused (6400) and not 6000, and loss values are lower than it should be (0.3 instead of 0.6), however the log information make sense as you can see below:
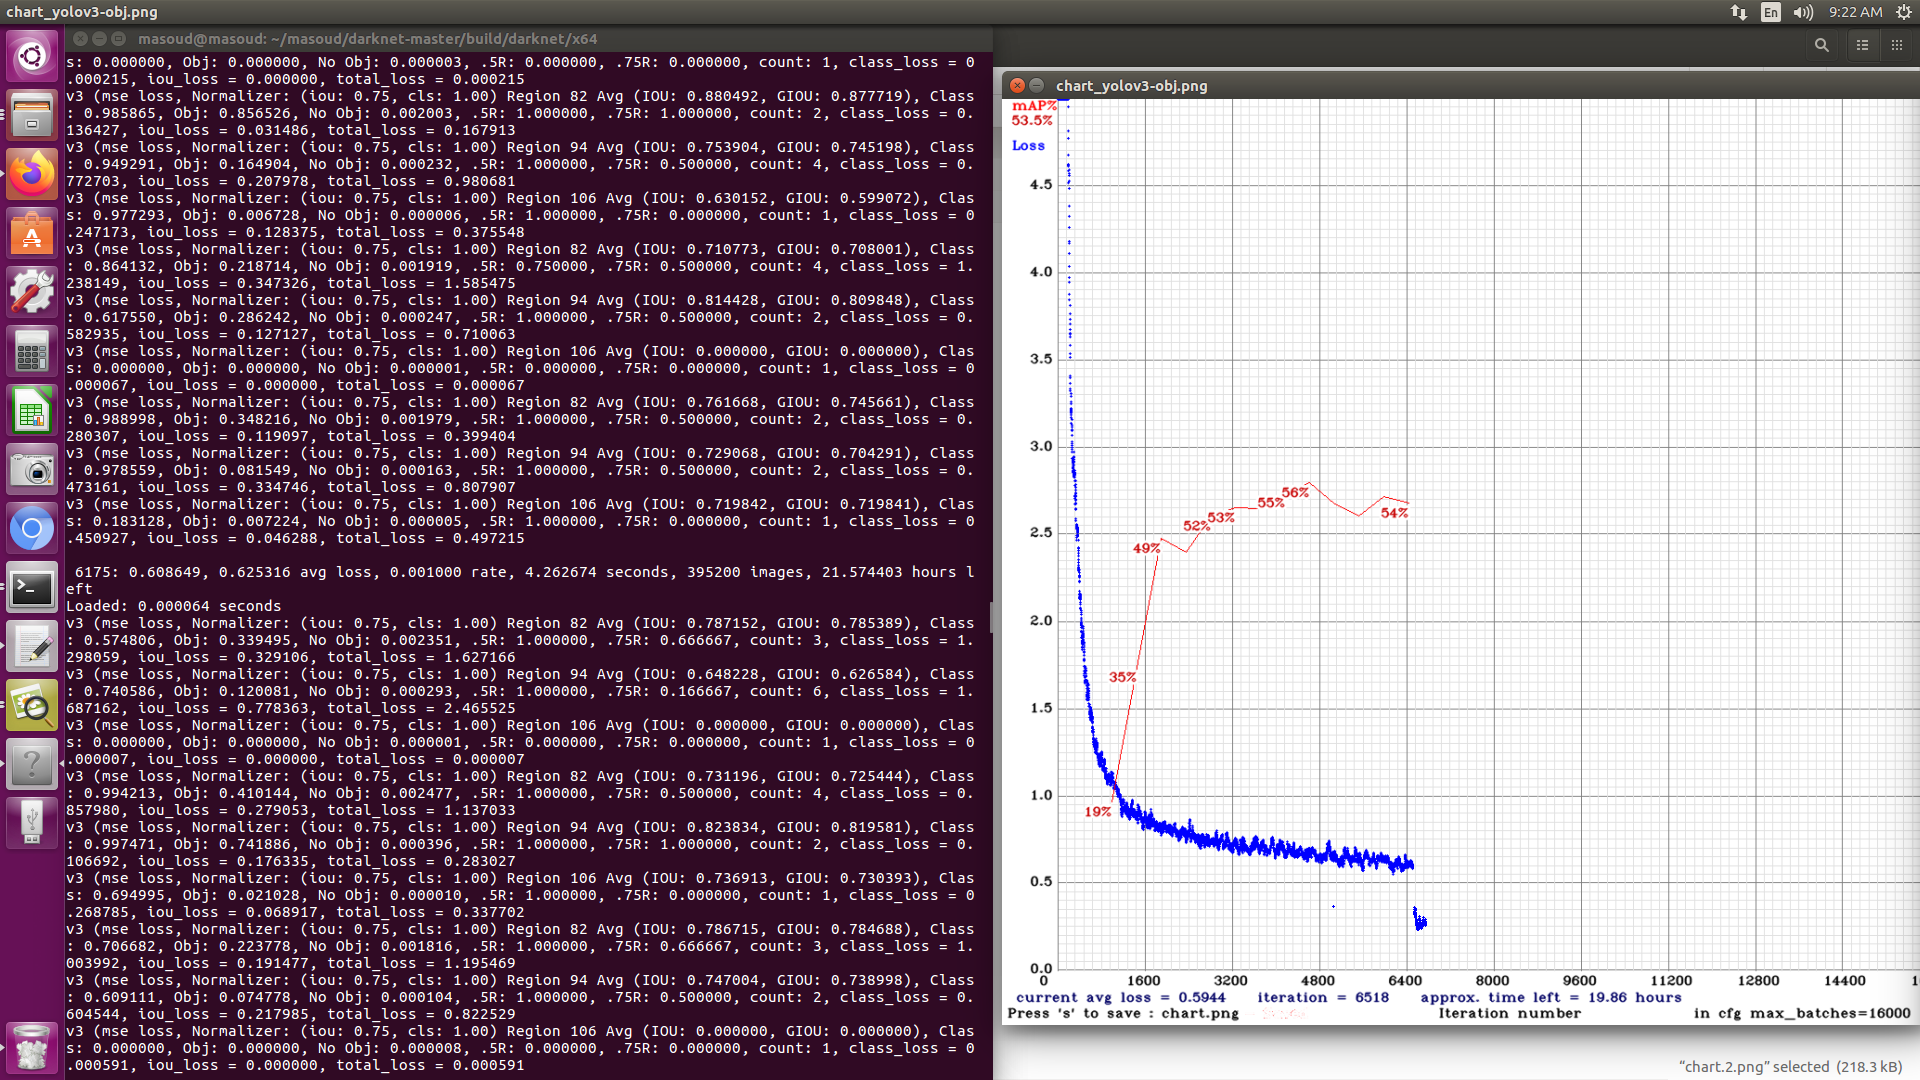
the bottom line is that after resuming logs and chart do not match and logs make sense but not the chart.
mfaramarzi
on 12 May 2020
@AlexeyAB
in addition when I resume at 6000,the iteration number is locked on 6518 and it doesn't change
mfaramarzi
on 12 May 2020
Usually loss drops when you resume the training due to resetting of internal optimizator values, but usually it is temporary and isn't such significant. So this is normal.
AlexeyAB
on 12 May 2020
Related issues
 qianyunw
·
3Comments
qianyunw
·
3Comments
 Greta-A
·
3Comments
Greta-A
·
3Comments
 louisondumont
·
3Comments
louisondumont
·
3Comments
 jasleen137
·
3Comments
jasleen137
·
3Comments
 bit-scientist
·
3Comments
bit-scientist
·
3Comments
Most helpful comment
@mfaramarzi Just resume training with
-chart chart.pngat the end of training command.