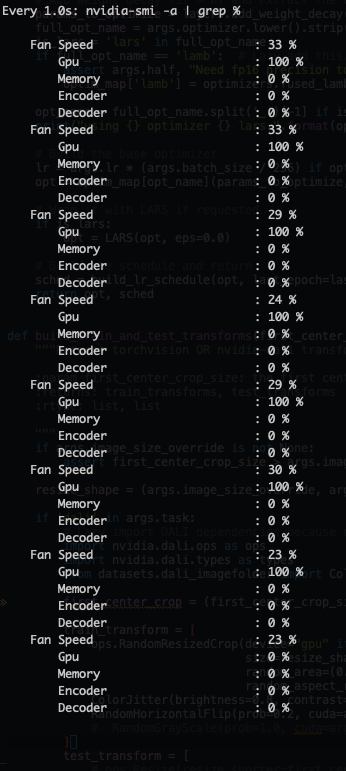
Dali: GPUs locked @ 100% usage w/ 0% memory.
I'm running a 8 GPU DDP pytorch setup (single node, multi-process distributed where 1 process is locked to 1 GPU via CUDA_VISIBLE_DEVICES; this is done before the data Pipeline is created) and DALI seems to lock the GPUs in this weird state:
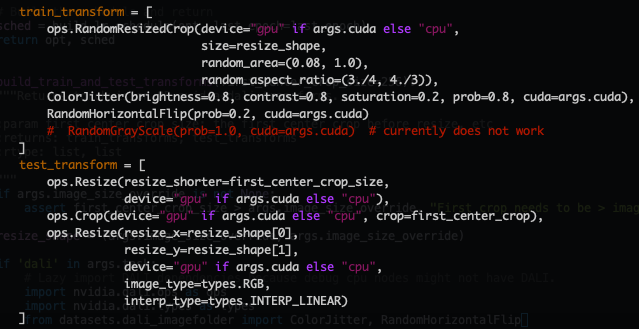
Here is the Pipeline that I use:

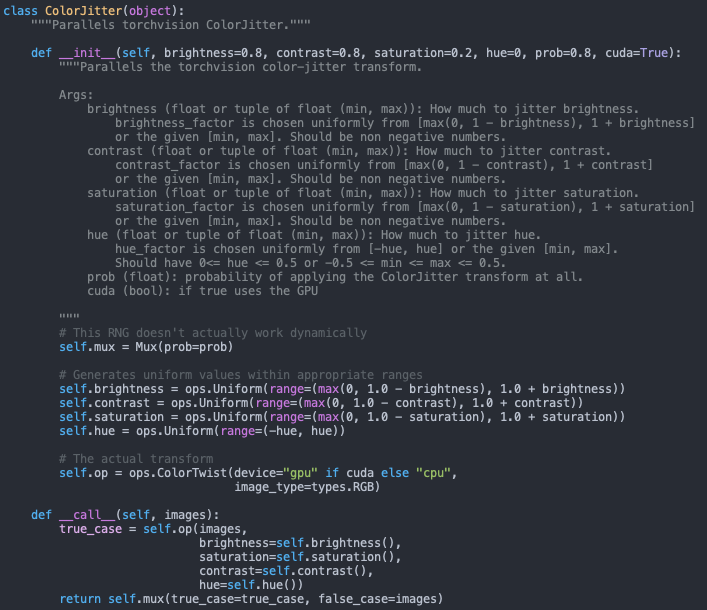
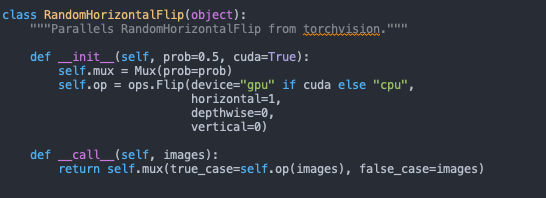
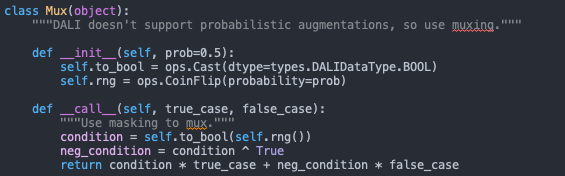
And here are the ops [probably not relevant] :
 jramapuram
All 8 comments
Hi,
Have you tried to run the pipeline itself locally on a single GPU?
Can you provide a standalone and self-contained repro we can just run to reproduce this problem?
 JanuszL
on 30 Apr 2020
JanuszL
on 30 Apr 2020
Hey @JanuszL,
Thanks again for the quick response. Code works fine on a single-GPU. Not sure I have time to write a minimum viable repro, but the entire project is open source: https://github.com/jramapuram/SimCLR :).
Would be cool to show the power of DALI for a large scale machine learning task like SimCLR (SOTA for representation learning -- ~76.5% top-1 linear classification accuracy on imagenet).
jramapuram
on 30 Apr 2020
From the DALI point of view running singe, GPU is the same as the multi GPU use case. Each DALI pipeline instance is always bound to only one GPU. So unless you are not doing strange things with it I don't see how this kind of behavior could happen.
What you can do is check if the DALI pipeline has been build and run when you see this high GPU utilization. If that happens on the cluster (as I understand it works locally with single GPU, not in the cluster) even with one GPU or you need to use multiple of them at once.
JanuszL
on 30 Apr 2020
Fair point. The only strange (I guess its not that strange) thing I'm doing is programatically setting CUDA_VISIBLE_DEVICES per process spawned here. The DALI pipeline is created after the fact though and is locked to device=0 here.
I tried directly swapping out the Dali Pipeline to torch's ImageFolder and it successfully completed 1 epoch in ~40 min vs. DALI which did not complete in > 1 hr.
jramapuram
on 1 May 2020
The only strange (I guess its not that strange) thing I'm doing is programatically setting CUDA_VISIBLE_DEVICES per process spawned here.
I don't think CUDA_VISIBLE_DEVICES variable value should affect DALI in any negative way. My only concern is that you may set if after DALI is imported but it should not interact with cuda until you build the pipeline. But please check that just to be sure.
I tried directly swapping out the Dali Pipeline to torch's ImageFolder and it successfully completed 1 epoch in ~40 min vs. DALI which did not complete in > 1 hr.
Have you seen any progress or just plain hang?
JanuszL
on 1 May 2020
I don't think
CUDA_VISIBLE_DEVICESvariable value should affect DALI in any negative way. My only concern is that you may set if after DALI is imported but it should not interact with cuda until you build the pipeline. But please check that just to be sure.
Will do. What would a same way to check this be?
I do lazy load the DALI imports, so I'm "pretty" sure that it isn't being called.
Have you seen any progress or just plain hang?
Good question. I waited ~1hr 15 min and then quit the process. Will give it another shot and report back.
jramapuram
on 1 May 2020
I switched the setup from the mp.spawn method in pytorch to a simple for loop to create the processes from bash and it works. I think this might be something else related to NCCL / interconnectivity as when I run the p2pBandwidthLatencyTest I see:
Device=0 CAN Access Peer Device=1
Device=0 CAN Access Peer Device=2
Device=0 CAN Access Peer Device=3
Device=0 CANNOT Access Peer Device=4
Device=0 CANNOT Access Peer Device=5
Device=0 CANNOT Access Peer Device=6
Device=0 CANNOT Access Peer Device=7
...
Full logs @ this GIST
The time per epoch is now ~20 min! :)
jramapuram
on 1 May 2020
I'm glad it works.
JanuszL
on 1 May 2020
Related issues
jramapuram
·
4Comments
 zeakey
·
4Comments
zeakey
·
4Comments
 kindoblue
·
4Comments
kindoblue
·
4Comments
 simonJJJ
·
3Comments
simonJJJ
·
3Comments
 Doom9234
·
3Comments
Doom9234
·
3Comments
Most helpful comment
I'm glad it works.