Cypress: 🍴 Huge memory consumption 🍴
Current behavior:


Desired behavior:
So for some time Im developing tests using Cypress.
I saw that sometimes I had huge lag in system.
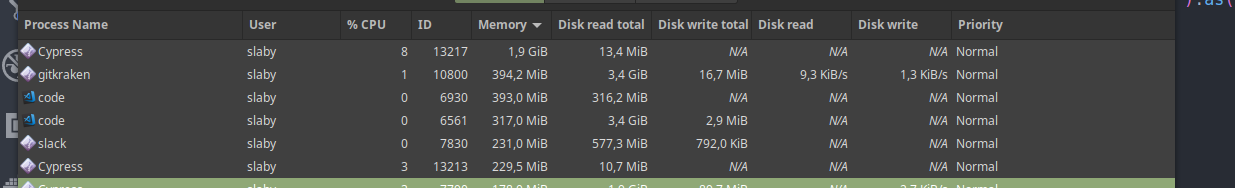
I saw today in System Monitor, that Cypress is allocating new chunks of memory while not relasing old ones.
Im seeing this when running cypress show command:
CYPRESS_baseUrl=http://dev.xyz.com:3000 cypress open
Steps to reproduce:
1) Run Cypress with Electron 59
2) Let tests run and do their stuff
Acutally my test is clicking on dropdown with different currencies.
When it's clicked, page is relaoded and I check if current currency is correct.
  it('checks list of currencies', () => {
    cy.fixture('currencyList.json')
      .then(currencyList => {
        for (let [currency, value] of currencyList) {
          cy.changeCurrency(currency)
          cy.get(':nth-child(4) > .nbar__menu-link')
            .then(element => {
              const elementValue = element.text().trim()
              expect(elementValue).to.equal(value)
            })

        }
      })
  })
Versions
Cypress 3.1.0
System info:
DISTRIB_ID=LinuxMint
DISTRIB_RELEASE=19
DISTRIB_CODENAME=tara
DISTRIB_DESCRIPTION="Linux Mint 19 Tara"
NAME="Linux Mint"
VERSION="19 (Tara)"
ID=linuxmint
ID_LIKE=ubuntu
PRETTY_NAME="Linux Mint 19"
VERSION_ID="19"
HOME_URL="https://www.linuxmint.com/"
SUPPORT_URL="https://forums.ubuntu.com/"
BUG_REPORT_URL="http://linuxmint-troubleshooting-guide.readthedocs.io/en/latest/"
PRIVACY_POLICY_URL="https://www.linuxmint.com/"
VERSION_CODENAME=tara
UBUNTU_CODENAME=bionic
Hardware info:
H/W path       Device     Class          Description
====================================================
                          system         GL62 7QF (16J5.3)
/0                        bus            MS-16J5
/0/1                      memory         64KiB BIOS
/0/3e                     memory         16GiB System Memory
/0/3e/0                   memory         8GiB SODIMM DDR4 Synchronous 2133 MHz (0.5 ns)
/0/3e/1                   memory         8GiB SODIMM DDR4 Synchronous 2400 MHz (0.4 ns)
/0/42                     memory         256KiB L1 cache
/0/43                     memory         1MiB L2 cache
/0/44                     memory         6MiB L3 cache
/0/45                     processor      Intel(R) Core(TM) i7-7700HQ CPU @ 2.80GHz
/0/100                    bridge         Intel Corporation
/0/100/1                  bridge         Skylake PCIe Controller (x16)
/0/100/1/0                display        GM107M [GeForce GTX 960M]
/0/100/2                  display        Intel Corporation
/0/100/14                 bus            Sunrise Point-H USB 3.0 xHCI Controller
/0/100/14/0    usb1       bus            xHCI Host Controller
/0/100/14/0/4             input          USB Keyboard
/0/100/14/0/8             input          SteelSeries Rival 100 Gaming Mouse
/0/100/14/0/a             communication  Bluetooth wireless interface
/0/100/14/0/b             multimedia     USB 2.0 Webcam Device
/0/100/14/0/c             generic        USB2.0-CRW
/0/100/14/1    usb2       bus            xHCI Host Controller
/0/100/14.2               generic        Sunrise Point-H Thermal subsystem
/0/100/16                 communication  Sunrise Point-H CSME HECI #1
/0/100/17                 storage        Sunrise Point-H SATA Controller [AHCI mode]
/0/100/1c                 bridge         Sunrise Point-H PCI Express Root Port #1
/0/100/1c/0    wlp2s0     network        Intel Corporation
/0/100/1c.3               bridge         Sunrise Point-H PCI Express Root Port #4
/0/100/1c.3/0  enp3s0     network        QCA8171 Gigabit Ethernet
/0/100/1f                 bridge         Sunrise Point-H LPC Controller
/0/100/1f.2               memory         Memory controller
/0/100/1f.3               multimedia     Intel Corporation
/0/100/1f.4               bus            Sunrise Point-H SMBus
/0/0           scsi0      storage
/0/0/0.0.0     /dev/sda   disk           275GB Crucial_CT275MX3
/0/0/0.0.0/1   /dev/sda1  volume         511MiB Windows FAT volume
/0/0/0.0.0/2   /dev/sda2  volume         255GiB EXT4 volume
/0/2           scsi3      storage
/0/2/0.0.0     /dev/sdb   disk           1TB WDC WD10JPVX-22J
/0/2/0.0.0/1   /dev/sdb1  volume         233GiB EFI partition
/0/2/0.0.0/2   /dev/sdb2  volume         15MiB reserved partition
/0/2/0.0.0/3   /dev/sdb3  volume         150GiB Windows NTFS volume
/0/2/0.0.0/4   /dev/sdb4  volume         504MiB Windows NTFS volume
/0/2/0.0.0/5   /dev/sdb5  volume         454GiB Windows NTFS volume
/0/2/0.0.0/6   /dev/sdb6  volume         511MiB Windows FAT volume
/0/2/0.0.0/7   /dev/sdb7  volume         92GiB EXT4 volume
/1                        power          To Be Filled By O.E.M.
UPDATE
I just checked it on Chrome browser.
Same thing is happening but much slower.
 slaby93
All 26 comments
see issue #431
 beanian
on 17 Aug 2018
beanian
on 17 Aug 2018
I will vouch for this issue. I to notice large memory consumption. 3 gigs or more during a long test run.
Chrome 68.
Cypress 3.1*
 Francismb
on 21 Aug 2018
Francismb
on 21 Aug 2018
@slaby93 are you using cypress open or cypress run? can you see if using cypress run reduces your memory consumption?
If so, I recommend setting the config value numTestsKeptInMemory: 0 in cypress.json
 Bkucera
on 21 Aug 2018
Bkucera
on 21 Aug 2018
@Bkucera I was running it previously with cypress open.
Running it with cypress run requires less more RAM , but it's growing with each test.
As I see it from System Monitor, each new page visit takes around ~10MB additional memory which is released when file spec is finished.
Now I've done same test with numTestsKeptInMemory: 0 and I saw same behaviour.
From 200MB to ~600MB, growing each second.
In my test, I visit page around 45 times. When Cypress starts, it allocates ~145MB ram. If we will cound that 45 visits times 10MB per visit it sums up.
Of course, this can be all wrong but It's what I see from my PC.
slaby93
on 22 Aug 2018
@Bkucera That solved all of my memory issues. Cheers.
Francismb
on 22 Aug 2018
@slaby93 it's not recommended to visit a page 45 times in a single test. Because Cypress does hold a lot of state for you about the DOM, this takes a lot of memory. If you need to do visit a page many times, consider dynamic tests by calling it in a forEach.
Bkucera
on 22 Aug 2018
@Bkucera I have run into this issue again. I have two 'it' statements, before each one, the browser loads a url which contains a rather large form. On the first 'it' statement, the test memory climbs to around 1.7 gig's, and on the second iteration, it climbs to around 2.5 gigs and then crashes. The two 'it' statements are identical as its testing that duplicate information is not allowed. It also seems as if the memory is carried over from the last test.
Francismb
on 22 Aug 2018
Same problem here. We run the tests in a docker container with cypress run. It crashes every time after the 23rd testfile. If we run the 23rd test only, everything is fine.
We build a workaround now with some parallel steps in the docker file.
numTestsKeptInMemory: 0 doesn't fix the problem...
 javo2222
on 22 Aug 2018
javo2222
on 22 Aug 2018
@Bkucera
Ok, making it statements in loop can work but this doesn't resolve other problems.
I can run even one test for longer time and memory consumption will grow.
I had simple tests visiting one page and clicking. While running cypress open memory wasn't released so after a couple hours Cypress were causing my system to lag.
Shouldn't I use cypress open? :trollface: (This is main reason we considered using cypress )
slaby93
on 22 Aug 2018
We've been discussing this problem this week. We've had to bump our virtual machine memory requirements in the last few months we've hit a pretty big wall with the ram demands. We're using run rather than open and keeping zero tests in memory but quickly hit 4GB of usage during a test run. Please let us know if there's anything we can check on our end to help diagnose the root cause. We're using Angular 5 and the cypress webpack plugin setup.
 matt-psaltis
on 24 Aug 2018
matt-psaltis
on 24 Aug 2018
@SaltyDH Are you seeing the memory issues on a specific test? For really long tests with lots of navigation, its possible to keep reference to old DOM trees of previous pages, causing high memory usage.
Bkucera
on 24 Aug 2018
I have a test that goes to one page, logs in, reads color and visibility data from a file, enters each number from an array of numbers, and checks the visibility and fill color of eight objects on the page. if I put in 10 numbers the test will usually complete, 20 numbers and i get aw snap before it is done. even with number of tests saved set to 0, which is not useful when developing. That does not seem like too large or long a test to expect to run, but i can watch the memory climb as it runs.
 jimsmith1562
on 6 Sep 2018
jimsmith1562
on 6 Sep 2018
i have found a work around: instead of cypress open and clicking the file to run,
i used cypress run --headed --spec
that allows me to watch what is happening during debugging/development,
and while the memory climbs a little, it does not aw snap.
still it would be nice to use open as intended.
jimsmith1562
on 6 Sep 2018
@jimsmith1562 ok, so the issue seems to be isolated to cypress open
Bkucera
on 10 Sep 2018
Also hitting this when hitting "Run all specs" in the cypress devtool (aka cypress open)
I don't know if I can reproduce reliably in my open source app but you can definitely see the test slow down towards the end. To reproduce in my app:
git clone https://github.com/TeselaGen/openVectorEditor
cd openVectorEditor
yarn
yarn start
in another terminal
yarn cypress open
hit the "run all specs" button and watch it slow down. Sometimes I get a blank white page at the end.
 tnrich
on 5 Feb 2019
tnrich
on 5 Feb 2019
Can we add a --tail feature to the test runner log to let us show x last entries? in a long running test that generates output to that log for every log a dom element is created in that panel and it quickly adds up in long test bringing the browser to grinding halt, if we can trim that log area in the case of long running test it would be nice.
 janusqa
on 24 Feb 2019
janusqa
on 24 Feb 2019
We regularly encountered out-of-memory issues with Cypress too - and found a solution in our case: The deeper problem should be fixed in Cypress itself, but we also found a user workaround.
Problem:
When running Cypress test in headed mode, we regularly got crashes with out of memory.
numTestsKeptInMemory doesn't help, because a single test alone is enough to crash it.
When did it happen:
The waste of memory always exist, but becomes critical in applications where you have...
- Several XHR requests (>30 in our case) and/or
- A complex UI with large CSS files.
Reason:
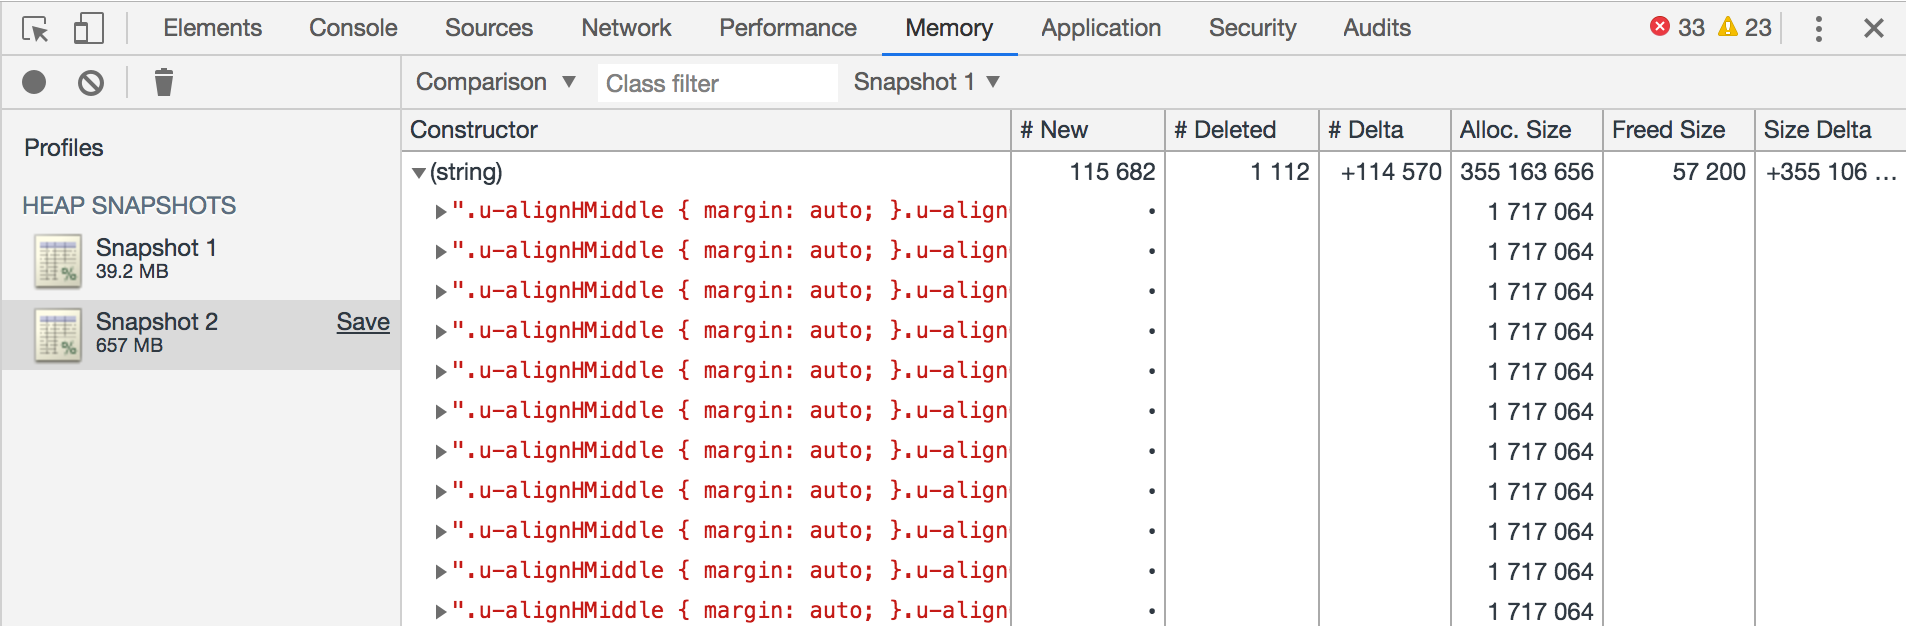
Main memory issue is caused by the headStyles stored in each snapshot: For any small step (request/response/whatever else triggers snapshots) the whole set of headStyles is collected again and again - although there are often no or very little changes.
User-Workaround:
In our case, the problem was particularly heavy due to some quite long .css-files. By cleaning them up, we could signficiantly reduce the memory consumption. E.g., when using scss import without deduplication in dev mode, a style file can easily get much bigger than necessary. There may be embedded base-64 images etc. - any of this is duplicated hundreds of time by Cypress, so that reducing the .css files can help a lot.
How could it be fixed in Cypress:
To verify my theory, I did a local proof-of-concept hack directly in the cypress_runner.js bundle file: I added a simple string dictionary that reduced the memory usage by more than a Gigabyte in our case (>50% of the overall heap size) - which fully fixed the problem without losing functionality.
We hadn't cleaned our css files at that point though, so the headStyles were about 3MB - so the gain may be less spectacular in other scenarios.
It worked as follows:
- Instead of storing strings in the
headStylesarray, I just store an array of indices into a shared string dictionary. - When the styles are used (in function
_replaceHeadStyles), I unpack the styles, i.e., replace the indices back into an array of strings.
To make sure that the strings are not leaked in the Dictionary, Log.reduceMemory() should unregister the strings before deleting any snapshots. I ignored that in the experimental hack though, because the dictionary size never got critical anyway.
I am aware that a proper fix needs to happen in the original coffee scripts, but it was just for trying it out locally and for making my suggestion more concrete here.
Step 1: In the begging of cypress_runner.js, I added the global string dictionary:
function StringMap() {

      this.stringToIndex = new Map();
      this.indexToString = [];

      this.addString = function(str) {

      // If this string is known, just return its index
      var index = this.stringToIndex.get(str);
      if (index !== undefined) {
          return index;
      }

      // This is a new string. Add it to both maps.
      index = this.indexToString.length;
      this.indexToString.push(str);
      this.stringToIndex.set(str, index);
      return index;
  };

  this.getString = function(index) {
      return this.indexToString[index];
  };

  this.addStrings = function(strArray) {
      var indices = [];
      for (var i=0; i<strArray.length; i++) {
          var s = strArray[i];
          var index = this.addString(s);
          indices.push(index);
      }
      return indices;
  };

  this.getStrings = function(indices) {
      var strArray = [];
      for (var i=0; i<indices.length; i++) {
          var index = indices[i];
          var str   = this.getString(index);
          strArray.push(str);
      }
      return strArray;
  };
};
window.stringMap = new StringMap();

// Adds an array of style strings to the dictionary.
// Returns an array of indices into the global string dictionary.
window.packStyles = function(styles) {
    return window.stringMap.addStrings(styles);
};

// Gets an array of indices into the string dictionary pointing to style strings.
// Returns an array containing the original strings.
window.unpackStyles = function(styles) {

    // Return identiy if styles is undefined or already unpacked
    var isPacked = styles && (typeof styles[0] == "number");
    if (!isPacked) {
      return styles;
    }
    return window.stringMap.getStrings(styles);
};
Step 2: Add this to createSnapshot() (right after getting headStyles and bodyStyles)
// replace array of style-strings by array of string-ids
headStyles = window.stringMap.addStrings(headStyles);
Step 3: Add this to _replaceHeadStyles (at the beginning)
styles = window.unpackStyles(styles);
Let me know if there are any questions I can help with.
About Performance:
I did some profiling and verified that my dictionary approach didn't have significant impact on the overall performance.
Alternative/Better fixes:
The approach described above is just one possible solution. Profiling also showed that the getStylesFor() function took nearly 30% of the time in our tests.
So, even better than avoiding double-storage would be a way to reduce the work to collect the styles. I didn't investigate this in detail though, e.g., I am not sure if/how it is possible to track changes in the headstyles.
But I think even just getting rid of the memory duplication would already help a lot of users to get rid of memory overflow issues.
An even simpler option to provide that would be a more fine-granular control to decide for which steps Cypress takes snapshots. The only way to skip snapshots selectively from outside is the whitelist in the cy.server config - but since it does more than just skipping the snapshots, it didn't help here either.
 Henrik-Buchholz
on 15 Mar 2019
Henrik-Buchholz
on 15 Mar 2019
On top of the fixes that Henrik suggested (thanks for that in-depth analysis!) I would strongly vote for the proposed --tail feature. We are having a complex UI that includes charting, as such I do not see an option for us to substantially reduce the size of Javascript and CSS files.
 wolframst
on 20 Mar 2019
wolframst
on 20 Mar 2019
@Henrik-Bucholz we're debugging our "aw snap" problems and come to the same conclusion. Your solution seems to work in our project as well. We would love to see this picked up and througly tested by the Cypress team
 nicohabets
on 21 Mar 2019
nicohabets
on 21 Mar 2019
For our project, we also have a similar problem with huge memory consumption. In our case, we have several long E2E scenarios which walk across all project. And for this tests, we should disable saving DOM statement ("numTestsKeptInMemory": 0). But exactly the possibility of easiest debugging for developers, without knowledge of testing framework was one of the key features when we choose a framework.
 Ohrimenko1988
on 8 Apr 2019
Ohrimenko1988
on 8 Apr 2019
We have fronted app based on angular6 - we have also long E2E scenarios and often problems with "aw snap" crashed. We also set numTestsKeptInMemory": 0. This errors and slow performance almost make impossible to work with e2e tests.
 arczi-sz
on 8 Apr 2019
arczi-sz
on 8 Apr 2019
+1 to this issue
It would be nice to see @Henrik-Buchholz changes included into the cypress - they seems like a great optimization.
Cypress: 3.1.4
Chrome: 74
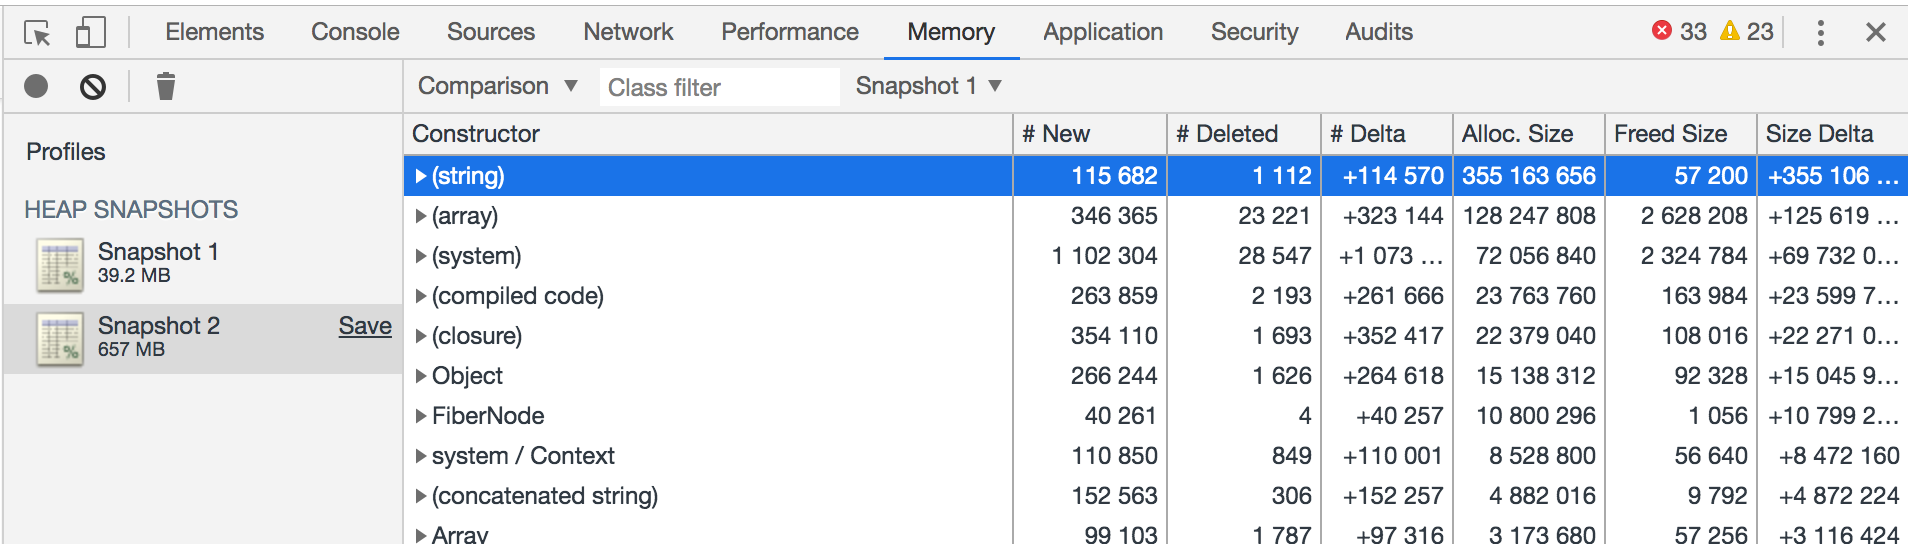
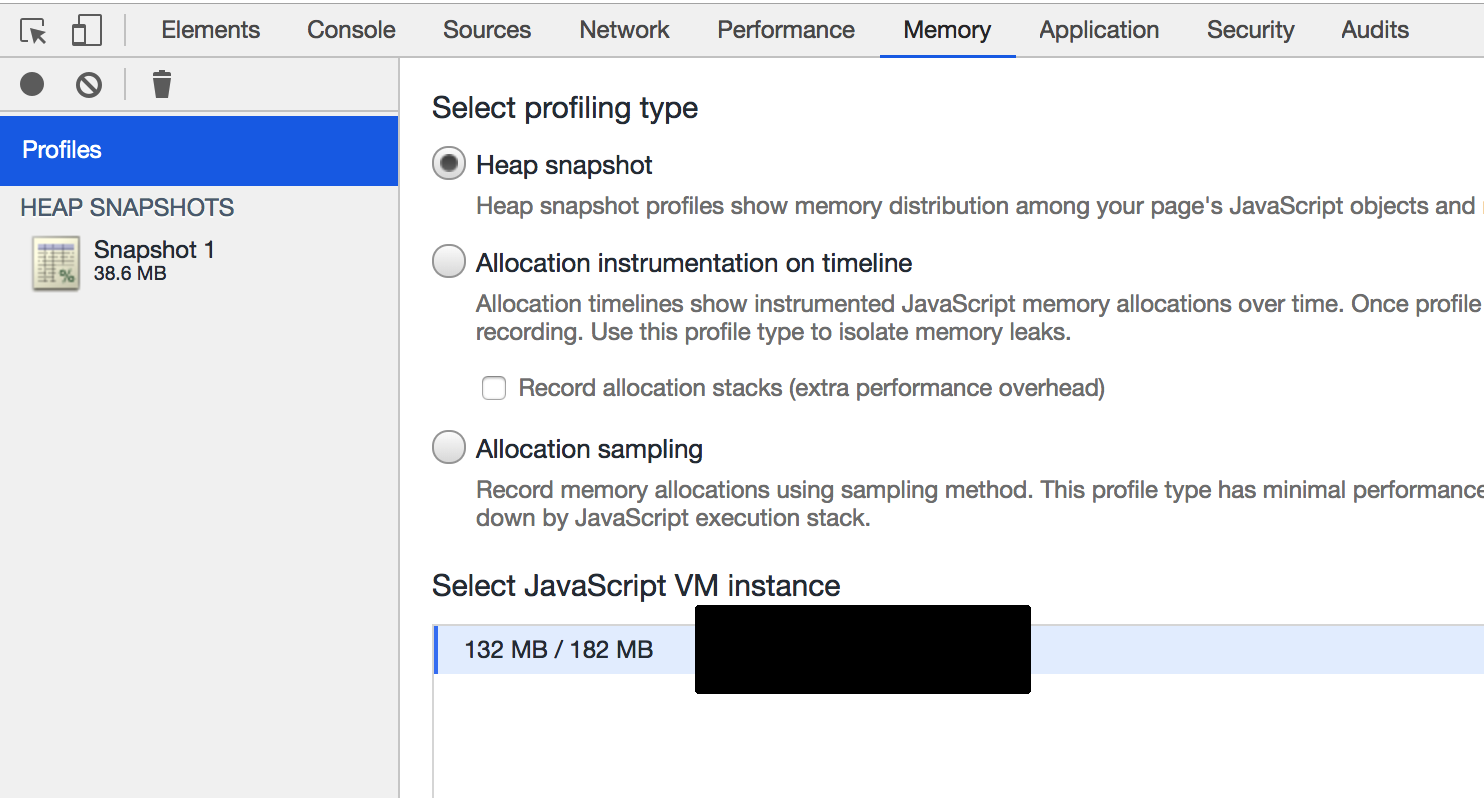
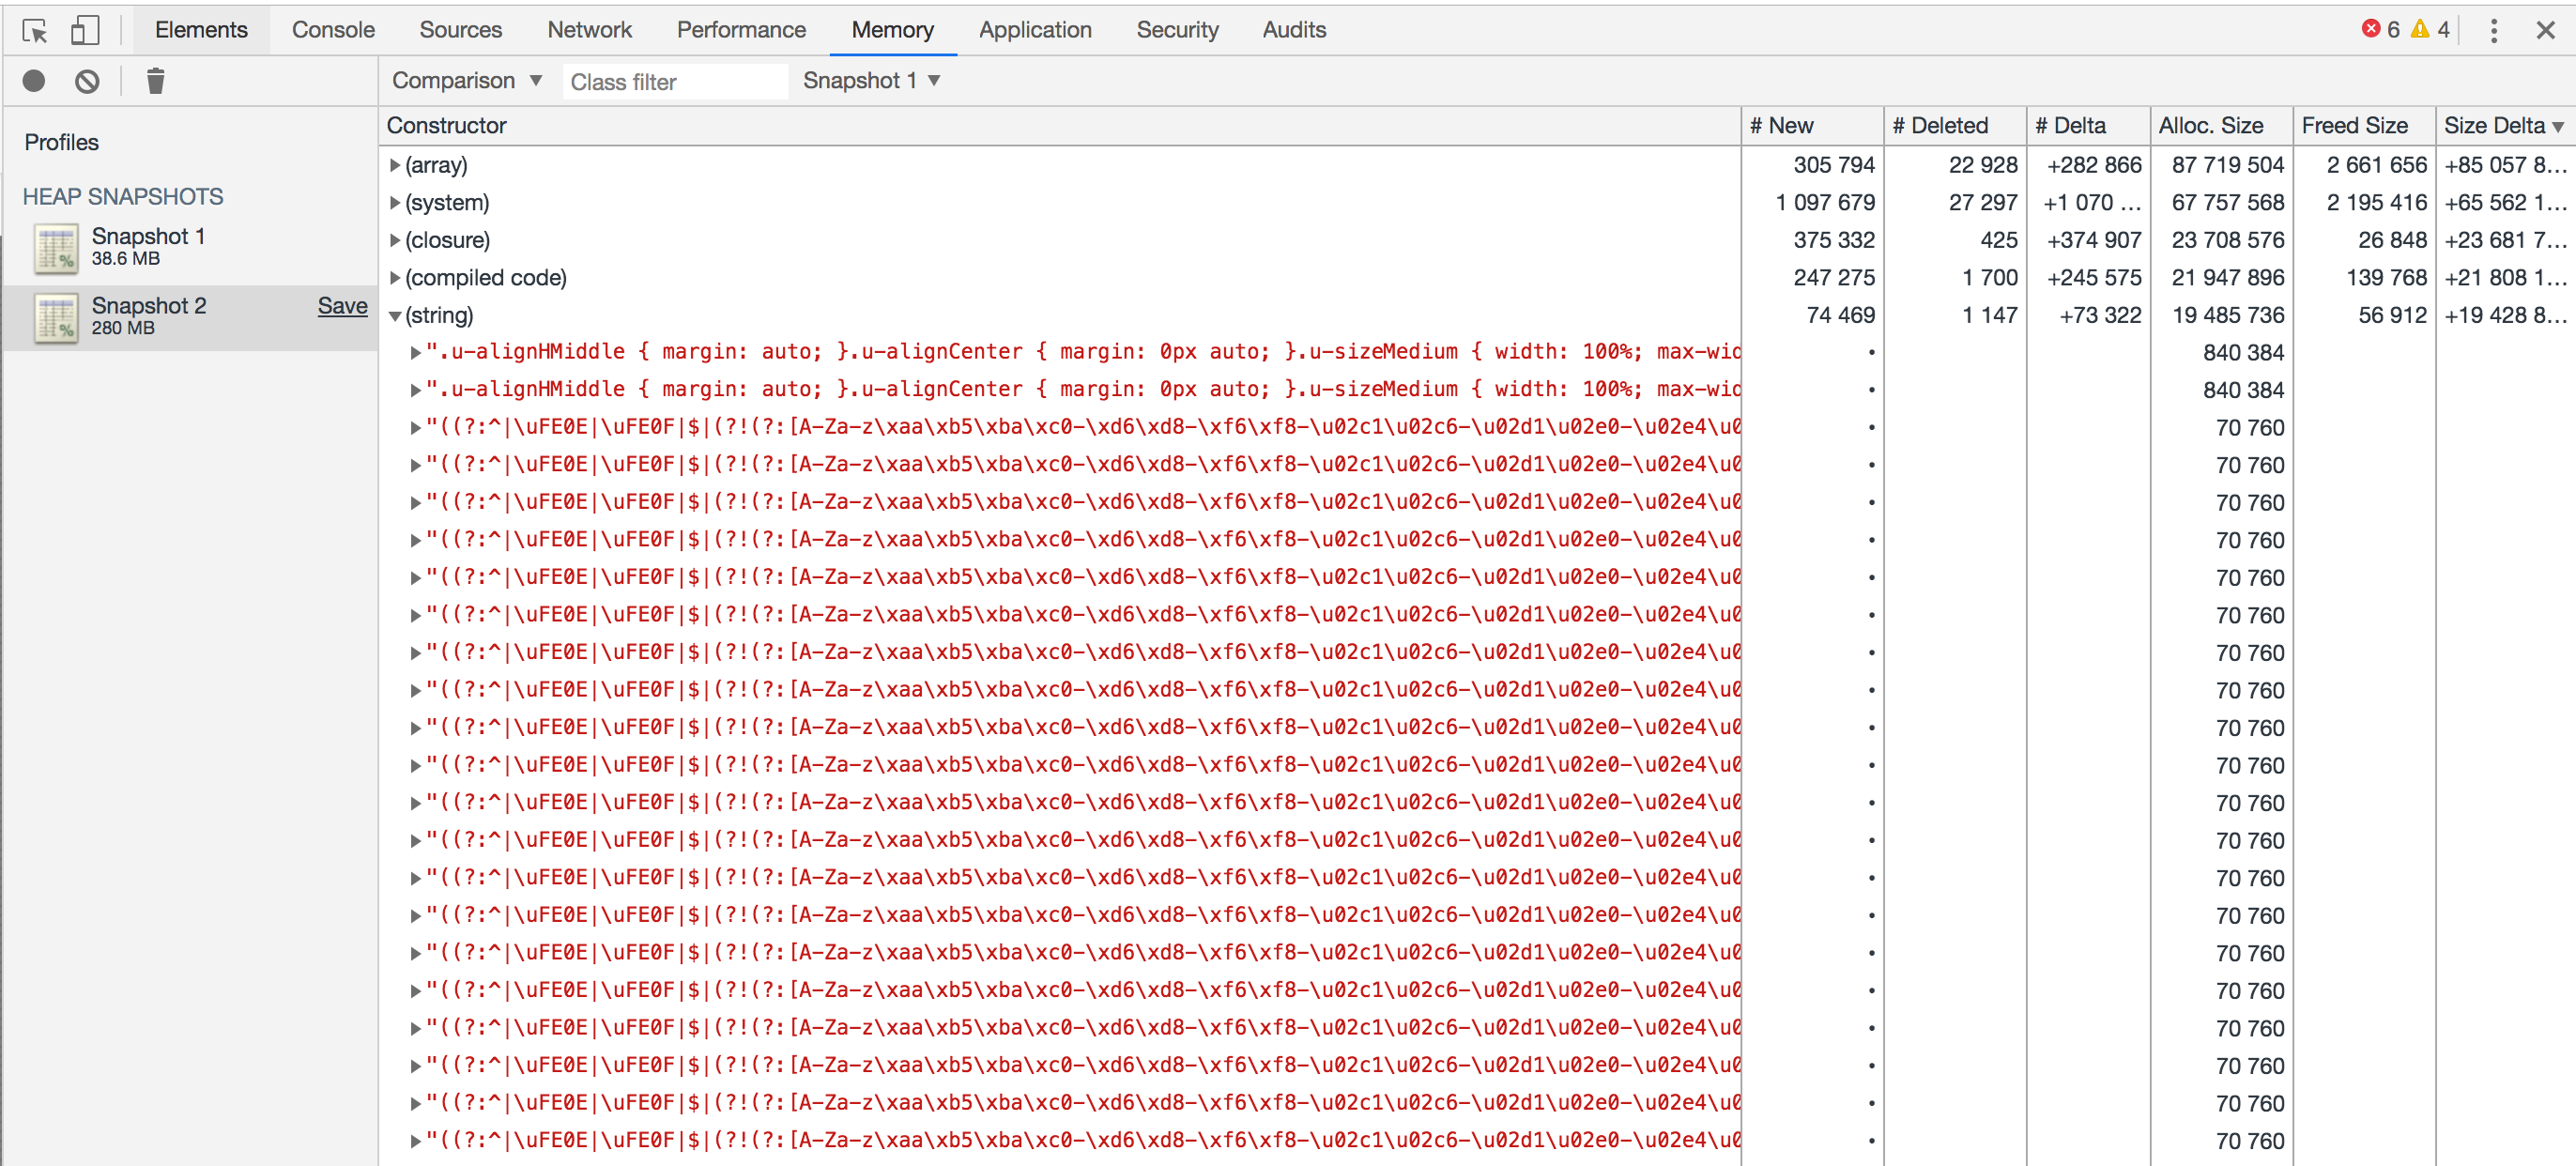
Spent some time debugging why our handful of tests were failing. I kept getting failures with errors codes related to memory issues, and saw the browser/cypress crash when the memory consumption for the Chrome instance hit ~2gb in the dev tools. I took some memory snapshots to see what was consuming all of the memory, and discovered the same thing @Henrik-Buchholz did. In the screenshots below, saved strings are consuming 355 mb, with the largest ones being the contents of our external stylesheets.
Reproduction/Discovery Steps
This issue is worse when running tests have have lots of snapshots
- Start all tests via
cypress openwith "numTestsKeptInMemory" set to high value (50) - When tests start, open Chrome Dev Tools, go to the Memory Tab and take a Heap Snapshot
- Wait for the tests to run a while, and then stop them
- Selecting the "Profiles" header in the Memory tab allows you to see Memory consumption while the tests are running
- Clear garbage by clicking the trash can icon, and then take another Memory Snapshot
- The more memory consumed, the longer it takes to take this snapshot, so don't let it get _too_ big
- You could optionally take the snapshot without clearing garbage, to see memory consumption while running
- Compare the 2 Snapshots to investigate the garbage (strings) is where you'll find all of the CSS.
- Select Snapshot 2. Click the Summary dropdown and select Comparison. Snapshot 1 should automatically be selected in the comparison dropdown to the right
Screenshots - click to expand
Step 2 - First snapshot taken
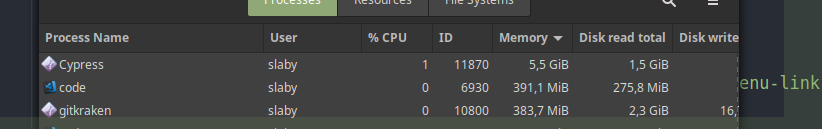
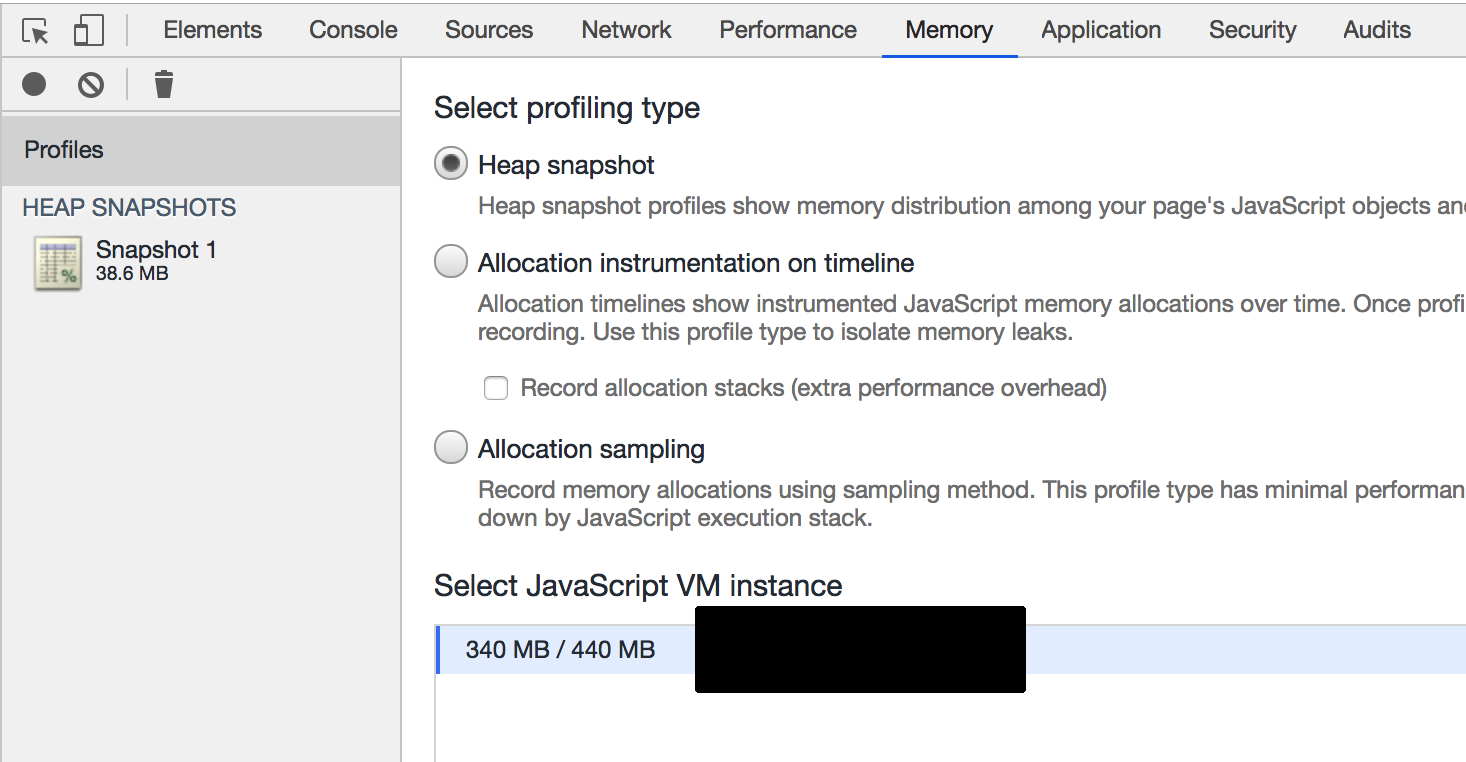
Step 3 - Waiting for tests to run, watching memory
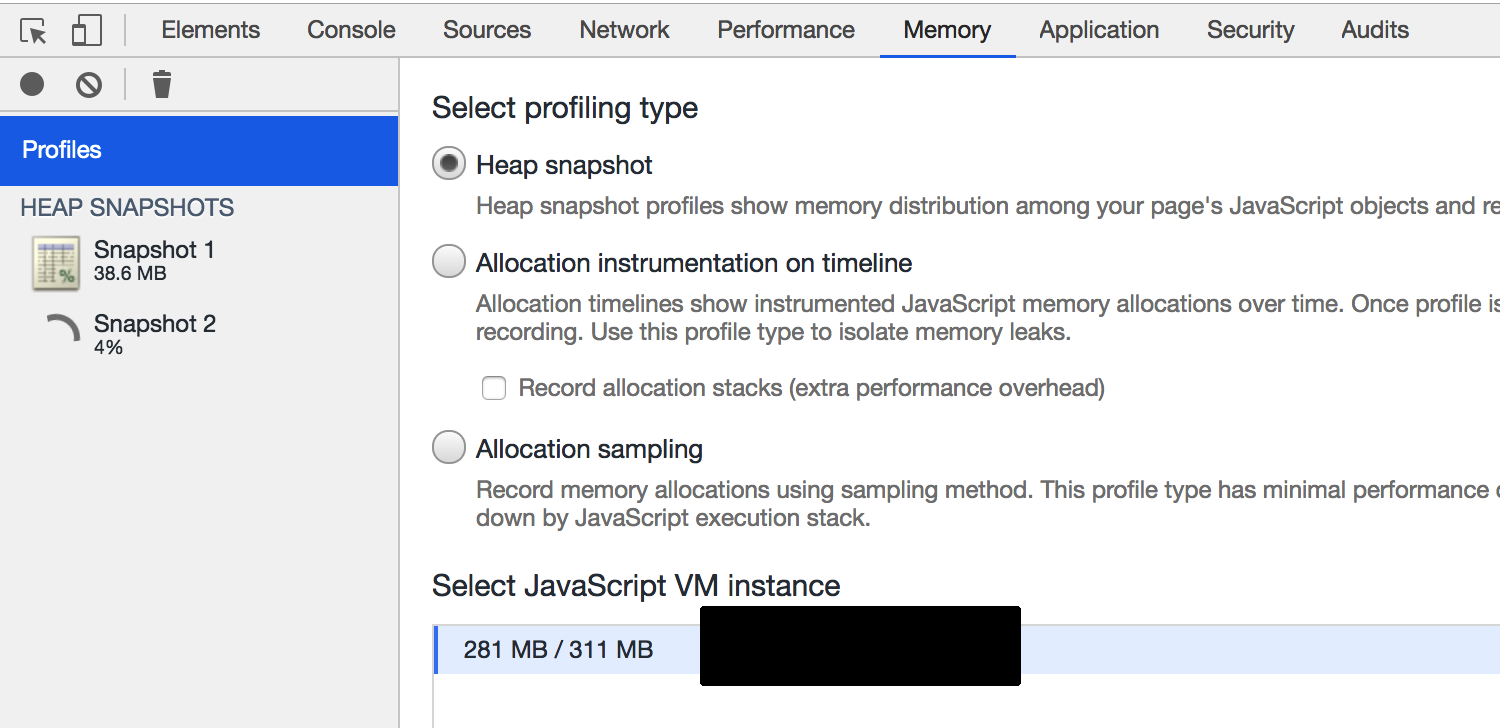
Step 4 - Cleared garbage, took snapshot, waiting for it to load - Memory was > 400 mb before clearing garbage
Step 5 - Comparing snapshots, can see lots of repetitive strings here (the issue is variable depending on the test being run, I didn't hit the really bad one yet). This issue gets worse as the number of snapshots increases.
 CoryDanielson
on 26 Apr 2019
CoryDanielson
on 26 Apr 2019
@janusqa @wolframst Please open a new issue for a --tail option. This feature will not get addressed with its being hidden in this issue.
 jennifer-shehane
on 6 Jun 2019
jennifer-shehane
on 6 Jun 2019
The code for this is done in cypress-io/cypress#4068, but has yet to be released.
We'll update this issue and reference the changelog when it's released.
![cypress-bot[bot] picture](https://avatars3.githubusercontent.com/u/8908513?v=4&s=40) cypress-bot[bot]
on 17 Jun 2019
cypress-bot[bot]
on 17 Jun 2019
Great to hear about the progress. Thanks for fixing this issue!
Henrik-Buchholz
on 26 Jun 2019
Released in 3.3.2.
cypress-bot[bot]
on 28 Jun 2019
Related issues
jennifer-shehane
·
3Comments
 weskor
·
3Comments
weskor
·
3Comments
 szabyg
·
3Comments
szabyg
·
3Comments
 igorpavlov
·
3Comments
igorpavlov
·
3Comments
 dkreft
·
3Comments
dkreft
·
3Comments
Most helpful comment
We regularly encountered out-of-memory issues with Cypress too - and found a solution in our case: The deeper problem should be fixed in Cypress itself, but we also found a user workaround.
Problem:
When running Cypress test in headed mode, we regularly got crashes with out of memory.
numTestsKeptInMemory doesn't help, because a single test alone is enough to crash it.
When did it happen:
The waste of memory always exist, but becomes critical in applications where you have...
Reason:
Main memory issue is caused by the headStyles stored in each snapshot: For any small step (request/response/whatever else triggers snapshots) the whole set of headStyles is collected again and again - although there are often no or very little changes.
User-Workaround:
In our case, the problem was particularly heavy due to some quite long .css-files. By cleaning them up, we could signficiantly reduce the memory consumption. E.g., when using scss import without deduplication in dev mode, a style file can easily get much bigger than necessary. There may be embedded base-64 images etc. - any of this is duplicated hundreds of time by Cypress, so that reducing the .css files can help a lot.
How could it be fixed in Cypress:
To verify my theory, I did a local proof-of-concept hack directly in the cypress_runner.js bundle file: I added a simple string dictionary that reduced the memory usage by more than a Gigabyte in our case (>50% of the overall heap size) - which fully fixed the problem without losing functionality.
We hadn't cleaned our css files at that point though, so the headStyles were about 3MB - so the gain may be less spectacular in other scenarios.
It worked as follows:
headStylesarray, I just store an array of indices into a shared string dictionary._replaceHeadStyles), I unpack the styles, i.e., replace the indices back into an array of strings.To make sure that the strings are not leaked in the Dictionary,
Log.reduceMemory()should unregister the strings before deleting any snapshots. I ignored that in the experimental hack though, because the dictionary size never got critical anyway.I am aware that a proper fix needs to happen in the original coffee scripts, but it was just for trying it out locally and for making my suggestion more concrete here.
Step 1: In the begging of
cypress_runner.js, I added the global string dictionary:Step 2: Add this to
createSnapshot()(right after gettingheadStylesandbodyStyles)Step 3: Add this to
_replaceHeadStyles(at the beginning)styles = window.unpackStyles(styles);Let me know if there are any questions I can help with.
About Performance:
I did some profiling and verified that my dictionary approach didn't have significant impact on the overall performance.
Alternative/Better fixes:
The approach described above is just one possible solution. Profiling also showed that the
getStylesFor()function took nearly 30% of the time in our tests.So, even better than avoiding double-storage would be a way to reduce the work to collect the styles. I didn't investigate this in detail though, e.g., I am not sure if/how it is possible to track changes in the headstyles.
But I think even just getting rid of the memory duplication would already help a lot of users to get rid of memory overflow issues.
An even simpler option to provide that would be a more fine-granular control to decide for which steps Cypress takes snapshots. The only way to skip snapshots selectively from outside is the whitelist in the
cy.serverconfig - but since it does more than just skipping the snapshots, it didn't help here either.