Cypress: Headless cypress run and CPU usage
Current behavior:
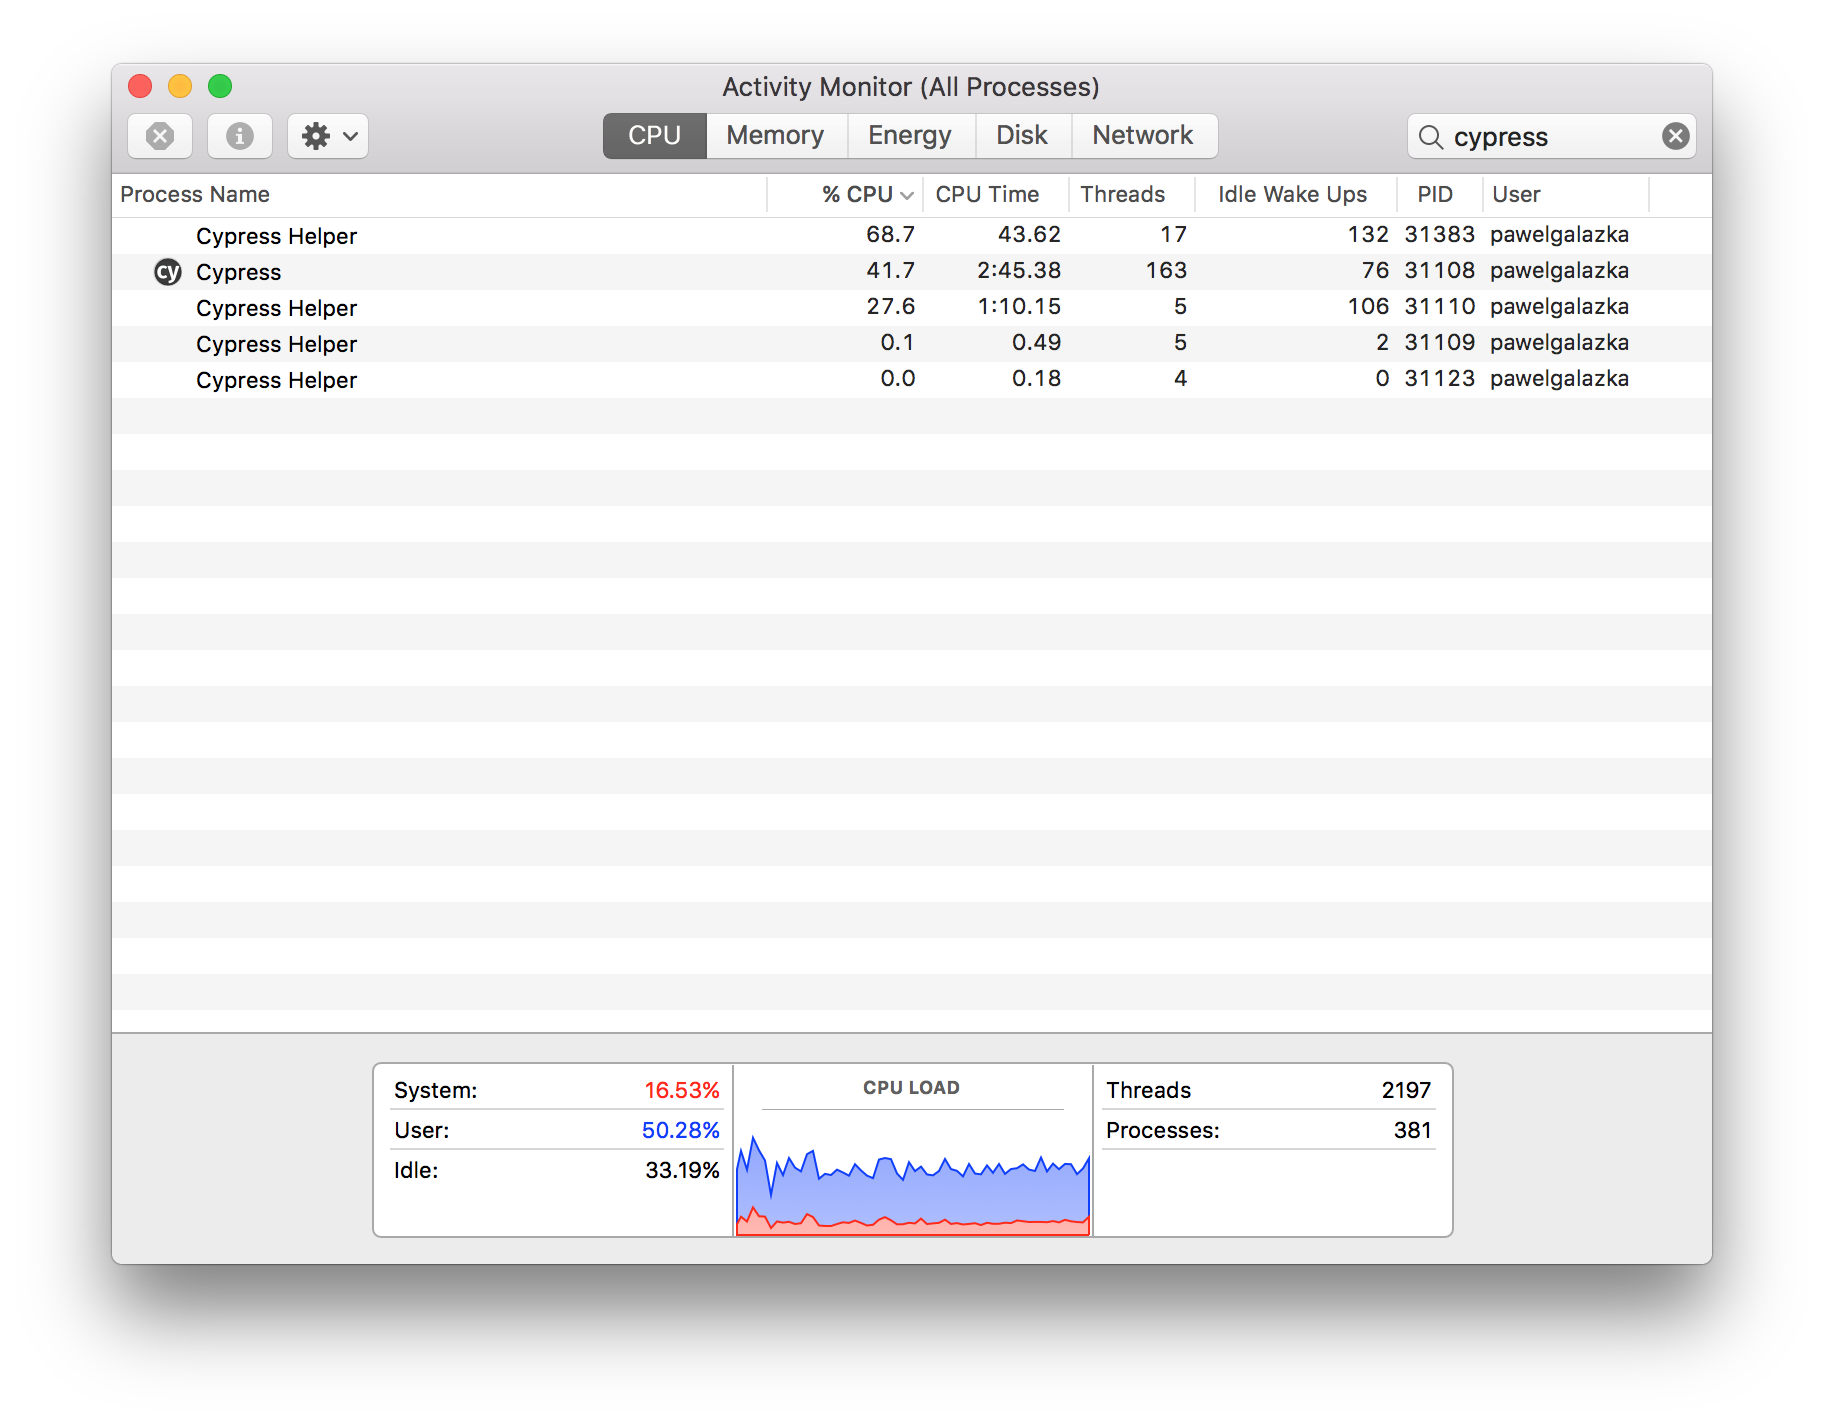
One process of cypress tests headless run (cypress run) consumes quite a lot of CPU power (3.1 GHz Intel Core i7). Video recording is disabled.

This gets tricky for CI runs if we want to run couple parallel Cypress processes on a single machine, as we won't get benefit of parallel runs (they slow down as we add more parallel processes) until we boost up our CI machine (which is already powerful)
Desired behavior:
Less CPU usage for Cypress headless run.
Are there any plans to improve CPU usage ? or maybe config tweaks which could improve it ?
- Operating System: macOs Sierra 10.12.6
- Cypress Version: 1.0.3
- Browser Version: Chrome 63
 pawelgalazka
All 12 comments
@jennifer-shehane Any update on this issue? We are also bumping into boundaries with our CI/CD platform that is sometimes being crippled by simply running some tests...
 hdjong1
on 28 May 2018
hdjong1
on 28 May 2018
You will likely experience improvement to the CPU usage in our upcoming 3.0 release - we have made improvements on how we run the spec files. Be on the lookout for this soon and please update this issue based on how your tests perform with the new update.
 jennifer-shehane
on 29 May 2018
jennifer-shehane
on 29 May 2018
I've tested Cypress 2 vs 3 for 208 tests.
Test run of all of those tests was by 1 minute longer though for Cypress 3.
Cypress 2.1: 14 minutes 8 sec
Cypress 3.1: 15 minutes 14 sec
In practice I haven't noticed any difference.
Same machine, CPU usage for 3.0 (it's good average representation)
pawelgalazka
on 15 Jun 2018
3.0 was never designed to improve CPU usage. It was only designed to improve memory usage by forcing the renderer process to released its primed cache in between spec files. This alone will have a positive impact to the CPU indirectly by preventing swapping or other problems.
However, I don't believe this is unreasonable in any way to see. What you're actually seeing is the CPU usage of both the Electron renderer process (the entire browser) and also the main node process in the background. Both are doing a lot of work, but are working in different processes and are able to take advantage of multiple cores.
The answer for parallelization is not and will never be trying to run on a single beefy machine. It is more efficient to split this up at the operating system / container level and providing elastic resources to account for memory / CPU spikes.
Browser testing is an incredibly intense thing as is - the speed at which Cypress operates is extremely fast which forces the browser to be rendering and painting nonstop. In linux we disable the GPU, which means everything is rendered to the CPU, so it's natural to see this get maxed out. The same thing happens when you're using your browser naturally - the difference is that there is no breaks when running e2e tests. The browser is endlessly being pushed until the spec is finished.
Try splitting up via containers and see if there's an improvement. While there are always optimizations we can make to Cypress, there is unlikely to be anything which drastically changes this relationship. If you can point to other examples or experiments that are vastly different we'd be happy to take a look.
I would also recommend trying to run Chrome instead of Electron to see if there is any noticeable difference.
EDIT: one thing that we've considered - there's not much we can do to decrease the CPU usage of the browser, except to pull the Cypress UI (and the extra rendering work it does) out of the browser entirely. The 3d scaling we do to keep it sized correctly does add a bit more to the CPU as well.
However, there are ways for us to take advantage of more cores in the main Node process to help alleviate any bottlenecks there. My guess is that this isn't really the source of the CPU spikes - it's more than likely the renderer process itself. More performance tracing is necessary to confirm.
If you could - try running in Chrome and then profile the Cypress application (since then it's just the node process) and you'll be able to independently profile Chrome.
 brian-mann
on 15 Jun 2018
brian-mann
on 15 Jun 2018
@hdjong1 what CI provider are you using and what limits are you bumping into?
brian-mann
on 15 Jun 2018
@brian-mann Our platform uses Jenkins and Docker and is being hosted entirely on AWS. We found out that Cypress can quite easily max out the CPU on our slaves when running tests. Since those slaves are not only used for running tests, but also for actual deployments (including to PROD), having Cypress using so many resources can have quite some impact.
Now, I do understand that running E2E tests is a very CPU intensive business, especially considering you're basically running a browser rendering all kinds of stuff. But the machines AWS is running on are not exactly slow. We're talking about multicore Xeon machines which should be more than capable to provide a solid and reliable test run. However, once we run 2 tests in parallel things start to slow down considerably, when kicking off 3 or more simultaneous runs (e.g. 3 different teams are trying to test something) things become basically unworkable and execution times increase around 10 to 20 times.
We could just scale up our AWS cluster, but as it looks now, we need to throw an insane amount of CPU power at the problem to have it become workable again. I was hoping that you guys were also able to do something from your side in order to optimize things, etc.
Just to be clear, we're loving Cypress over here. We completely replaced our old protractor based test suites and we couldn't be happier with the stability and ease of use of Cypress.
hdjong1
on 15 Jun 2018
@hdjong1 when you say slaves - are you splitting up your runs by docker container or are you running multiple cypress run commands from the same machine and the same docker container?
Have you tried running Chrome instead of the built in Electron to see if it makes a difference?
Can you go into details about the resource allocation of the machine or machine(s) ?
brian-mann
on 15 Jun 2018
@brian-mann Our CD environment basically consists of 3 slaves. Those are virtual machines provided by AWS. Each of them gets 8 GB of ram and 2 CPU cores. When kicking off a Cypress test suite, a Docker container gets spun up which contains Cypress and the test run is started within that container. It gets automatically assigned to one of the slaves. If another test suite is run simultaneously, a new Docker container gets spun up, running just that test suite, and getting assigned to one of the other (free) slaves. If a third one is started, rinse and repeat, you get the idea.
Slaves can run 2 (or even more) Cypress suites simultaneously. This puts a lot of load on them slowing them down considerably. This is not preferable.
So basically we can run 3 suites simultaneously (one for each slave) before things become too slow. This is less than we would prefer. Especially considering that we have 10 teams pushing their stuff trough CD combined with some quite large test suites. They can run for 30 minutes or more. We would like to split those up to run each spec in parallel, but at the moment that would just require too many resources.
I did just try a local run with Chrome instead of Electron, and that looked promising. Chrome seems to use fewer resources. This was just on my local machine though, so I'm now going to update our Docker containers with chrome to see how that runs on our platform. I'll keep you posted.
hdjong1
on 18 Jun 2018
Can confirm that switching from Elektron to Chrome alone for Cypress 3.0.1 saved 4 minutes in average when running tests in my case. From 16 min in avg to 12min in avg. That's total time of 4 parallel Cypress processes with different test groups on seperate Docker containers. I've checked 11 runs.
pawelgalazka
on 18 Jul 2018
Do you also see a difference in CPU load? I noticed some difference in load between Elektron and Chrome, but it was all single digits... not as much as I had hoped, unfortunately.
hdjong1
on 18 Jul 2018
webpack dev server + cypress run and take snapshot in docker on my mac.
just want to die...

it just crash and can't accomplish to make snapshot, so how can i make baseline images locally?
 luckybai
on 22 Jun 2019
luckybai
on 22 Jun 2019
Unfortunately we have to close this issue due to inactivity and also a lack of a provided reproducible example.
If you're experiencing a bug similar to this in Cypress, please open a new issue with a fully reproducible example that we can run.
jennifer-shehane
on 8 Oct 2020
Related issues
 igorpavlov
·
3Comments
igorpavlov
·
3Comments
 rbung
·
3Comments
jennifer-shehane
·
3Comments
rbung
·
3Comments
jennifer-shehane
·
3Comments
 egucciar
·
3Comments
egucciar
·
3Comments
 SecondFlight
·
3Comments
SecondFlight
·
3Comments
Most helpful comment
@brian-mann Our platform uses Jenkins and Docker and is being hosted entirely on AWS. We found out that Cypress can quite easily max out the CPU on our slaves when running tests. Since those slaves are not only used for running tests, but also for actual deployments (including to PROD), having Cypress using so many resources can have quite some impact.
Now, I do understand that running E2E tests is a very CPU intensive business, especially considering you're basically running a browser rendering all kinds of stuff. But the machines AWS is running on are not exactly slow. We're talking about multicore Xeon machines which should be more than capable to provide a solid and reliable test run. However, once we run 2 tests in parallel things start to slow down considerably, when kicking off 3 or more simultaneous runs (e.g. 3 different teams are trying to test something) things become basically unworkable and execution times increase around 10 to 20 times.
We could just scale up our AWS cluster, but as it looks now, we need to throw an insane amount of CPU power at the problem to have it become workable again. I was hoping that you guys were also able to do something from your side in order to optimize things, etc.
Just to be clear, we're loving Cypress over here. We completely replaced our old protractor based test suites and we couldn't be happier with the stability and ease of use of Cypress.