Cwa-documentation: Suspicious downwards trend for 7-Day R Value
Avoid duplicates
- [X] Bug is not mentioned in the FAQ
- [X] Bug is not already reported in another issue
Technical details
- Device name: Samsung Galaxy A5 (2017) SM-A520F
- Android version: 8.0.0
- App version: 1.12.0
Describe the bug
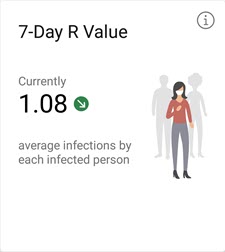
Today, March 1, 2021, at 11:00, the CWA statistics tile 7-Day R Value shows Currently 1.08 with a downwards trend.
Other RKI data sources show the value increasing, not decreasing. The downwards trend shown in the app is therefore questionable.
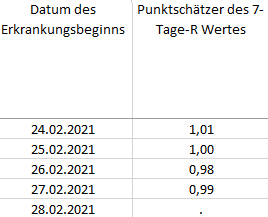
From https://www.rki.de/DE/Content/InfAZ/N/Neuartiges_Coronavirus/Projekte_RKI/Nowcasting.html > https://www.rki.de/DE/Content/InfAZ/N/Neuartiges_Coronavirus/Projekte_RKI/Nowcasting_Zahlen.xlsx 28.02.2021
Datum des Erkrankungsbeginns | Punktschätzer des 7-Tage-R Wertes
-- | --
10.02.2021 | 0,89
11.02.2021 | 0,91
12.02.2021 | 0,94
13.02.2021 | 0,96
14.02.2021 | 0,99
15.02.2021 | 1,02
16.02.2021 | 1,04
17.02.2021 | 1,06
18.02.2021 | 1,06
19.02.2021 | 1,08
20.02.2021 | 1,08
21.02.2021 | 1,07
22.02.2021 | 1,08
23.02.2021 | 1,08
24.02.2021 | .
Steps to reproduce the issue
- Open CWA scroll down and across to 7-Day R Value
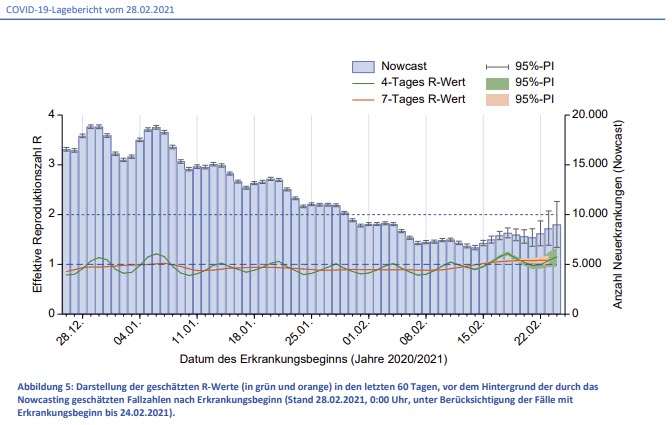
- Compare to graph in RKI daily report (The estimated R-values) or (Darstellung der geschätzten R-Werte) (https://www.rki.de/DE/Content/InfAZ/N/Neuartiges_Coronavirus/Situationsberichte/Gesamt.html
- Compare to values in RKI Excel sheet from https://www.rki.de/DE/Content/InfAZ/N/Neuartiges_Coronavirus/Projekte_RKI/Nowcasting.html
Expected behavior
The trend in the app for 7-Day R Value should agree with other RKI data sources.
Internal Tracking ID: EXPOSUREAPP-5473
 MikeMcC399
All 18 comments
This evening, Monday, March 1, 2021 18:40 the table https://www.rki.de/DE/Content/InfAZ/N/Neuartiges_Coronavirus/Projekte_RKI/Nowcasting_Zahlen.xlsx 01.03.2021 linked on https://www.rki.de/DE/Content/InfAZ/N/Neuartiges_Coronavirus/Projekte_RKI/Nowcasting.html has been updated.
The Excel table now shows a downwards trend, however the value of the 7-Day R Value showing in the app is still 1.08 (with downwards trend). None of the recent values in the Excel table in the column "Punktschätzer des 7-Tage-R Wertes" matches the 1.08 value in the app.
Also this evening the new situation report for today, March 1, 2021, has been published and it shows a downwards trend for the 7-Day R Value too. The 7-Day R Value in today's report is 1.01. In yesterday's situation report for Feb 28, 2021, the 7-Day R Value was shown as 1.08.
So there is a mismatch between the combination of value and trend shown in the situation reports compared to the app. The app shows the value of the situation report from yesterday and the trend of the situation report from today. It is puzzling to try to reconcile the app display with other RKI data sources.
Value | Situation Report yesterday Feb 28, 2021 | Situation Report today March 1, 2021 | App March 1, 2021
--- | --- | --- | ---
7-Day R Value | 1.08 | 1.01 | 1.08
7-Day R Trend | up | down | down
MikeMcC399
on 1 Mar 2021
Update, March 2, 2021 10:30
The 7-Day R Value has now caught up with the Situation Report from yesterday and it is showing:
Value | Situation Report yesterday March 1, 2021 | App today March 2, 2021 10:30
--- | --- | ---
7-Day R Value | 1.01 | 1.01
7-Day R Trend | down | down
Earlier this morning about 08:00 it was still showing the inconsistent values of 1.08 with downwards trend, like it was showing yesterday.
MikeMcC399
on 2 Mar 2021
@MikeMcC399 Thanks for the detailed report. Internal Tracking ID: EXPOSUREAPP-5473
 dsarkar
on 2 Mar 2021
dsarkar
on 2 Mar 2021
Hey @MikeMcC399 , I'm looking into this issue. Unfortunately, I missed the download of the respective raw Nowcasting data file. Would you be able to share this file, please?
It is important to understand, that the values for each and every day within the file may change daily, especially with those numbers that are quite "new". This is because of the ongoing re-calculation of the probability model and the prediction intervals to narrow down the numbers for the R value - which finally gives the trend.
For now, again I validated on today's downloaded the correctness on both: numbers and trend indicator. Therefore, I need to access the sources on date and time of your reported issues.
Would that be possible?
 GisoSchroederSAP
on 2 Mar 2021
GisoSchroederSAP
on 2 Mar 2021
@GisoSchroederSAP
I understand about the ongoing recalculation of the values. It just seems like the trend was out of sync with the values themselves.
Here are the two files you requested:
Nowcasting_Zahlen 2021 02 28.xlsx
Nowcasting_Zahlen 2021 03 01.xlsx
MikeMcC399
on 2 Mar 2021
This morning, Thursday, March 4, 2021 08:45 the 7-Day R Value in the app looks good.
It is showing Currently / 0.93 / downwards trend.
This fits with the information in the RKI Daily Situation Report - March 3, 2021 from yesterday evening 19:26. 👍
MikeMcC399
on 4 Mar 2021
Today, Friday, March 5, 2021 11:00 the 7-Day R Value being displayed in the app is:
Currently / 0.99 / upwards trend
The value 0.99 corresponds to what was reported in the RKI Daily Situation Report - March 4, 2021 from yesterday evening 18:15.
The upwards trend on the other hand does not correspond to the graph in the report.
What value is the trend based on? 7 days ago, the app was displaying 1.05 as the 7-Day R Value, so if the trend is calculated according to this then it should be downwards, not upwards. If on the other hand the trend is calculated by comparing with the value displayed yesterday, which was 0.93, then the trend is upwards.
Perhaps the help text needs adjusting for the 7-Day R Value as well if the trend comparison is made by using the previous day's value?
MikeMcC399
on 5 Mar 2021
Hi @MikeMcC399 ,
Today's displayed R-value is 0.99 and comes out of the latest available calculation. According to the documentation I have, the "change rate" (translated to the "trend indicator") uses the comparison to
effective_date - 7
where effective_date is today. So the today's value will be compared to the value from Feb 26 (today-7)
At least, if this is the correct understanding, the Nowcasting xls file would support this as well (assuming, that there a no rounding issues after the two decimals).
On the other hand, the comparison with just yesterday's displayed value would come to the same result.
So, I still strongly believe in the correctness of the trend indicator, even if this is not that intuitive.
In order to get the one or the other option confirmed, I am currently pushing the data analysts for an internal statement.
Based on the output, we will come up with better explanation on the FAQ page, as this might be faster and gives us more space/freedom than changing the text within the CWA.
GisoSchroederSAP
on 5 Mar 2021
@GisoSchroederSAP
Thanks for researching this point!
The 7-Day R Values are recalculated daily, including a recalculation of historical values, so it's not so intuitive how the trend calculations are being done. I'll wait to see what you find out from the data analysts.
MikeMcC399
on 5 Mar 2021
yes, @MikeMcC399, and not only the values are recalculated, but all the the prediction intervals as well - indicating how "stable" or "valid" a given value might be. That's why, I just can judge a call only on the latest available data, for the given moment.
Comparing those fix values in a highly-dynamic environment becomes challenging.
Anyway, the communication must be clear to avoid (or at least, to minimize) misunderstandings. So, thanks for having an eye on this topic!!!
GisoSchroederSAP
on 5 Mar 2021
Quick update:
I got response from the data analysists for several detailed questions. Those answers now allow me to "translate" the calculations a bit more _consumer-friendly_, hopefully.
We are totally aware, that the abstract wording in the app (and on other sources) creates misunderstandings or at least distrust - so we do our best to validate the information and to get a better feeling how to "read" those statistics.
The current plan is, first to open an FAQ entry with the explanation for each statistics tile - step by step. The layout of the explanations should be similar and as simple as possible. If available, we will try to link further references for those that want to dive deeper into the respective topic.
Each of the explanation we will one more time double-check with RKI for the epidemiological correctness of our explanation before the file get published. And as usual, any feedback is welcome!
GisoSchroederSAP
on 11 Mar 2021
@GisoSchroederSAP
I'm quite confident about understanding the values and trends for Confirmed New Infections and 7-Day Incidence. I have been following the data the last days and my calculations always agree with the app. It just needs to be explained (first in the FAQ, then in the app) that the trend for the 7-Day Incidence is comparing to the value from the previous day, not the previous week, just like you already stated.
For the 7-Day R Value I still don't know exactly how the trend is being done, so I'll be interested to see the explanation. This value is a volatile moving target!
MikeMcC399
on 11 Mar 2021
Let me here
1st confirm: the 7-day-incidence trend indicator is compared against the value displayed on the previous day using a 1% threshold.
2nd share a short extract from my verifying calculation - that also documents the rather straight forward 4-day R-value in comparison to the sensitive 7-day value.
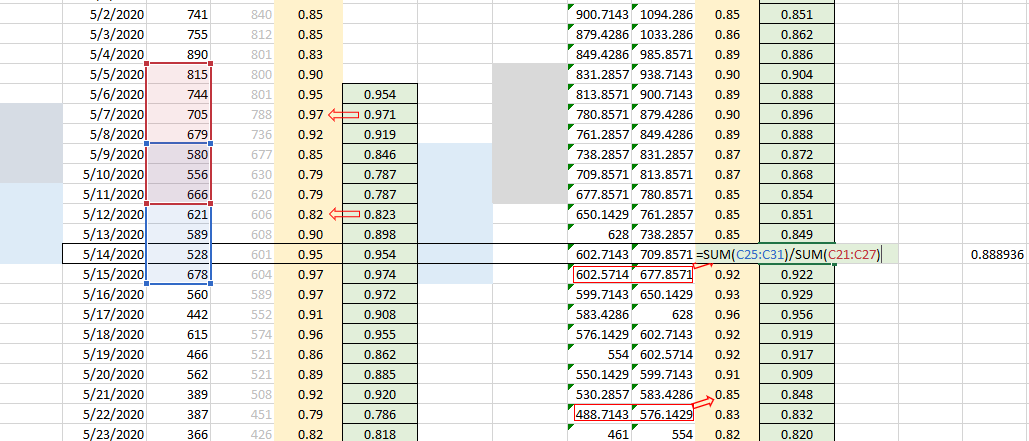
The major aspect of the 7-day-R-value is its ratio of two overlapping 7-day-periods within a constantly recalculated "corridor" (prediction interval) based on adjusted probabilities (about real start date of infection, estimated generation time for being contagious, delays of diagnosis, reporting delay to the health authorities...). As the certainty of knowledge increases over time with the observed data, the corridor for the R-value becomes tighter and therefore, the R-value stabilizes.
So, all the metrics that "travel with" the numbers of new infections will be incorporated, additionally the incubation period will be added (4-6 days), and records of at least 200 days back will be performed to calculate the currently shown R-value that relates back to the frequency of infection events in the past.
In the end: We get a value that is shown today referring to the occurences in the past, including probabilities of the delays of certain events (day of infection, incubation period, first day of symptoms, reporting of infection, transmission of reports...). Tomorrow, we get a new value to be presented tomorrow, and most probably even the value that was presented today is history and gets replaced by an updated value.
And this we will try to "translate" for easy consumption, soon ;-)
GisoSchroederSAP
on 11 Mar 2021
@GisoSchroederSAP
Thank you for your efforts to explain about the 7-Day R Value and trends. I think I now understand about what is displayed in the app.
- Taking the hint from the variable naming in the cwa-server repository the variable has a 1% in the name
sevenDayRvaluePublishedTrend1percentin StatisticsJsonStringObject.java#L73. I'm assuming that means that the trend is calculated from the previous day using the ±1% band for the definition of a steady trend. - The value displayed in the app when it says "Currently" is the same value which appears in the RKI Situation Report published the previous evening.
So to go back to the original bug report, the value shown in the app on March 1, 2021 for the 7-Day R Value was 1.08. This is the same value which is shown in the Situationsbericht Feb 28, 2021 on page 7. The Situationsbericht Feb 27, 2021 for the previous day shows the value of 1.11 for 7-Day R Value on page 8.
The trend compared to the previous day is 1.08 - 1.11 = -0.03, which is -2.7%. This is a downwards trend and it exceeds the ±1% steady band.
So it was correct to show the 7-Day R Value trend as a downwards arrow with a green background on March 1, 2021.
It was my mistake to try to use the Excel file from the page Nowcasting because this doesn't keep the history of what the app displayed.
The second cause of my problem was the help text. If you could just confirm that the 7-Day R Value trend uses the previous day and not the previous week for the trend calculation, we can close this issue.
I opened a separate issue https://github.com/corona-warn-app/cwa-documentation/issues/550 about getting the help text corrected.
Edit: PS If I am right, then tomorrow, Monday, March 15, 2021 the app will show "Currently 1.19" for the 7-Day R Value with a steady trend (since it is the same value showing for today, Sunday, March 14, 2021). 🙂
MikeMcC399
on 14 Mar 2021
Yes, @MikeMcC399 , I can confirm: The Trend for the R value uses the previous day for comparison.
And yes, the Nowcasting file always reflecting the "current" numbers after recalculation the the whole data set - so it does not include the history of R values. However, if you go backward in time (in the file, of course ;-) you will notice the calculated R-value will become stable and the prediction interval will become tighter and tighter.
Update: I hope I can finish the FAQ for the statistic tiles this week and let RKI analyst verify correctness of my explanation and the proper use of terminology. Once this is done, we will publish the FAQ.
Right afterward, I start the help text re-work task - thanks for you patience.
GisoSchroederSAP
on 15 Mar 2021
@GisoSchroederSAP
Thanks for your confirmation and update on your plans!
I reviewed the help text in English and German. Now at least I understand what it is trying to say, however it is unfortunately open to wrong interpretation. The German text is better, but the English text lost some meaning in the translation.
I made suggestions for a small change to the help text in https://github.com/corona-warn-app/cwa-documentation/issues/550 in the Proposed Fix section. Please take a look to see if you would support making this change.
MikeMcC399
on 15 Mar 2021
The background has been clarified and my prediction from yesterday (see https://github.com/corona-warn-app/cwa-documentation/issues/535#issuecomment-798946166) was proved correct, so this issue can be closed.
MikeMcC399
on 15 Mar 2021
Update: I just sent the 4 proposals for the statistics tiles for a technical examination.
Once this is done, we are going to translate into English language and start working on the text proposal for the app.
GisoSchroederSAP
on 16 Mar 2021
Related issues
 AndiLeni
·
3Comments
AndiLeni
·
3Comments
 cougarten
·
3Comments
cougarten
·
3Comments
 ndegendogo
·
3Comments
ndegendogo
·
3Comments
 kbobrowski
·
3Comments
kbobrowski
·
3Comments
 stritti
·
3Comments
stritti
·
3Comments
Most helpful comment
yes, @MikeMcC399, and not only the values are recalculated, but all the the prediction intervals as well - indicating how "stable" or "valid" a given value might be. That's why, I just can judge a call only on the latest available data, for the given moment.
Comparing those fix values in a highly-dynamic environment becomes challenging.
Anyway, the communication must be clear to avoid (or at least, to minimize) misunderstandings. So, thanks for having an eye on this topic!!!