We should test dask-cudf join performance with UCX. Today this involves using a few in-development branches:
UCX: As described in this post there is now a mostly working UCX + UCX-Py + Dask integration. @jakirkham has conda packages up for it here:
conda create -n ucx -c conda-forge -c jakirkham/label/ucx cudatoolkit=9.2 ucx-proc=*=gpu ucx ucx-py python=3.7https://github.com/jakirkham/staged-recipes/tree/17005b662e392672de7a82778b07eb4dec8b5ad9/recipes
cuDF serialization support, as improved by @rjzamora here: https://github.com/rapidsai/cudf/pull/1947
There is an old notebook doing this here although we would want to make a few changes:
- Use the
DGXclass from dask_cuda dev version, probably with only half of the GPUs for now, so something likecluster = DGX(cuda_visible_devices=[0,1,2,3]) - We might want to fool around with the data sizes a bit to make sure that things fit in only half of the device memory.
- Use the
cc @rjzamora and @madsbk , both of whom I think might be interested in this
 mrocklin
All 25 comments
Also cc @randerzander and @kkraus14 who might want to track this issue
mrocklin
on 24 Jun 2019
cc @gaohao95
 nsakharnykh
on 26 Jun 2019
nsakharnykh
on 26 Jun 2019
I created a gist with the current notebook and task stream profile here:
https://gist.github.com/quasiben/2530898f923d3cddcd34c6bed2a88543
Total time:
CPU times: user 53.9 s, sys: 7.11 s, total: 1min 1s
Wall time: 18min 48s
Also attaching a screen shot of the task stream

As you can see there isn't much communication visualized. This was run on a DGX box with v100s (32GB RAM). The join primarily stayed ~16GB but one GPUs approached the max:
| Processes:                                                       GPU Memory |
|  GPU       PID   Type   Process name                             Usage      |
|=============================================================================|
|    0     33902      C   ...len/miniconda3/envs/cudf-dev/bin/python 11090MiB |
|    1     33900      C   ...len/miniconda3/envs/cudf-dev/bin/python 30022MiB |
|    2     33904      C   ...len/miniconda3/envs/cudf-dev/bin/python 12050MiB |
|    3     33898      C   ...len/miniconda3/envs/cudf-dev/bin/python 13130MiB |
+-----------------------------------------------------------------------------+
I am going to rerun with less data
 quasiben
on 8 Jul 2019
quasiben
on 8 Jul 2019
@quasiben It may be worth passing as_index=False to the merge command as well as I'm not sure if we're handling serialization of the Indexes properly.
 kkraus14
on 8 Jul 2019
kkraus14
on 8 Jul 2019
In the middle of a debug session with @rjzamora I noticed that there were issues deserializing the distributed cuDF object. I have since filed an issue here:
https://github.com/dask/distributed/issues/2830
quasiben
on 8 Jul 2019
@kkraus14 there is no option fo as_index=False for merge ?
quasiben
on 8 Jul 2019
@quasiben I had a brainfart and mixed up groupby and join, disregard 😄
kkraus14
on 8 Jul 2019
Things should change when the second dataframe has more than one partition. I recommend playing around a bit with relative sizes.
mrocklin
on 9 Jul 2019
To be explicit here, I think that a success here would be a task stream that showed many red bars, but hopefully those bars would be small and correspond to multi-GB/s transfers.
mrocklin
on 9 Jul 2019
@mrocklin, indeed, with second dataframe having more than one partition more communication does occur. However, so does deserialization and errors like following arise:
File "/home/nfs/bzaitlen/GitRepos/cudf/python/cudf/cudf/dataframe/columnops.py", line 36, in __init__ super(TypedColumnBase, self).__init__(**kwargs) File "/home/nfs/bzaitlen/GitRepos/cudf/python/cudf/cudf/dataframe/column.py", line 160, in __init__ self._update_null_count(null_count) File "/home/nfs/bzaitlen/GitRepos/cudf/python/cudf/cudf/dataframe/column.py", line 173, in _update_null_count assert 0 <= null_count <= len(self) TypeError: 'NoneType' object cannot be interpreted as an integer
I've already logged this issue here: https://github.com/dask/distributed/issues/2830 and I'm going to be looking at it more closely now
quasiben
on 9 Jul 2019
I've made some progress regarding the error above. PRs:
handle proper serialization and cudf fixes -- and, I've returned to the benchmark test. I am now seeing errors in packing scheme:
distributed/worker.py:790> exception=error('unpack requires a buffer of 8 bytes')>)
Traceback (most recent call last):
  File "/home/nfs/bzaitlen/miniconda3/envs/cudf-dev/lib/python3.7/site-packages/tornado/ioloop.py", line 743, in _run_callback
    ret = callback()
  File "/home/nfs/bzaitlen/miniconda3/envs/cudf-dev/lib/python3.7/site-packages/tornado/ioloop.py", line 767, in _discard_future_result
    future.result()
  File "/home/nfs/bzaitlen/GitRepos/distributed/distributed/worker.py", line 797, in heartbeat
    address=self.contact_address, now=time(), metrics=self.get_metrics()
  File "/home/nfs/bzaitlen/GitRepos/distributed/distributed/core.py", line 752, in send_recv_from_rpc
    result = await send_recv(comm=comm, op=key, **kwargs)
  File "/home/nfs/bzaitlen/GitRepos/distributed/distributed/core.py", line 546, in send_recv
    response = await comm.read(deserializers=deserializers)
  File "/home/nfs/bzaitlen/GitRepos/distributed/distributed/comm/ucx.py", line 124, in read
    nframes, = struct.unpack("Q", obj[:8])  # first eight bytes for number of frames
struct.error: unpack requires a buffer of 8 bytes
to
Also, errors in CUDA:
ERROR:Call to cuOccupancyMaxPotentialBlockSize results in UNKNOWN_CUDA_ERROR
ERROR:Call to cuOccupancyMaxPotentialBlockSize results in UNKNOWN_CUDA_ERROR
ERROR:Call to cuOccupancyMaxPotentialBlockSize results in UNKNOWN_CUDA_ERROR
ERROR:Call to cuOccupancyMaxPotentialBlockSize results in UNKNOWN_CUDA_ERROR
ERROR:Call to cuOccupancyMaxPotentialBlockSize results in UNKNOWN_CUDA_ERROR
ERROR:Call to cuOccupancyMaxPotentialBlockSize results in UNKNOWN_CUDA_ERROR
ERROR:Call to cuLaunchKernel results in UNKNOWN_CUDA_ERROR
@kkraus14 noted that the above is often related to:
0 sized kernel launch
quasiben
on 25 Jul 2019
some more debug info:
ERROR:Call to cuOccupancyMaxPotentialBlockSize results in UNKNOWN_CUDA_ERROR
distributed.worker - WARNING -  Compute Failed
Function:  local_shuffle
args:      (<cudf.DataFrame ncols=2 nrows=15625000 >, 32, ['id'])
kwargs:    {}
Exception: CudaAPIError(700, 'Call to cuLaunchKernel results in UNKNOWN_CUDA_ERROR')

distributed.worker - WARNING -  Compute Failed
Function:  local_shuffle
args:      (<cudf.DataFrame ncols=2 nrows=1562501 >, 32, ['id'])
kwargs:    {}
Exception: CudaAPIError(700, 'Call to cuOccupancyMaxPotentialBlockSize results in UNKNOWN_CUDA_ERROR')

distributed.worker - WARNING -  Compute Failed
Function:  local_shuffle
args:      (<cudf.DataFrame ncols=2 nrows=1562500 >, 32, ['id'])
kwargs:    {}
Exception: CudaAPIError(700, 'Call to cuOccupancyMaxPotentialBlockSize results in UNKNOWN_CUDA_ERROR')

ERROR:Call to cuOccupancyMaxPotentialBlockSize results in UNKNOWN_CUDA_ERROR
ERROR:Call to cuLaunchKernel results in UNKNOWN_CUDA_ERROR
This last error, I believe, was due to handing cuDF 0 length memoryviews this has since been fixed in PR: https://github.com/rapidsai/cudf/pull/2378
quasiben
on 29 Jul 2019
Just ran the original notebook and now and the join worked smoothly with a running time of:
CPU times: user 4.59 s, sys: 1.22 s, total: 5.81 s
Wall time: 1min 49s

However, the call to head() never completes. Consider this an update with positive results but not a resolution
quasiben
on 29 Jul 2019
With the exception of that first transfer, most of those red bars are quite small, which is very nice to see :) I would be curious what cluster.scheduler.bandwidth looks like after running.
mrocklin
on 29 Jul 2019
(bandwidth is learned over time by looking at recent transfers)
mrocklin
on 29 Jul 2019
Actually, I am confused. This seems to be slower than what was happening in that notebook. Also, the merge operations are taking a surprisingly long time (I think?). 5s for a GPU merge seems long?
mrocklin
on 29 Jul 2019
If we're doing multi-GPU tests we should likely be turning on RMM pool mode otherwise we're going to be bottlenecked by cudaMalloc time.
kkraus14
on 29 Jul 2019
Even then, I suspect that we could malloc a very large dataframe in 5s. My guess is that that isn't currently our bottleneck.
mrocklin
on 29 Jul 2019
With the UCX/cuDF bug resolved and testing with the following PRs
- https://github.com/dask/distributed/pull/3059
- https://github.com/rapidsai/ucx-py/pull/180
- https://github.com/rapidsai/cudf/pull/2832
We are now getting better transfer results
With UCX (Dask-CUDA DGX)
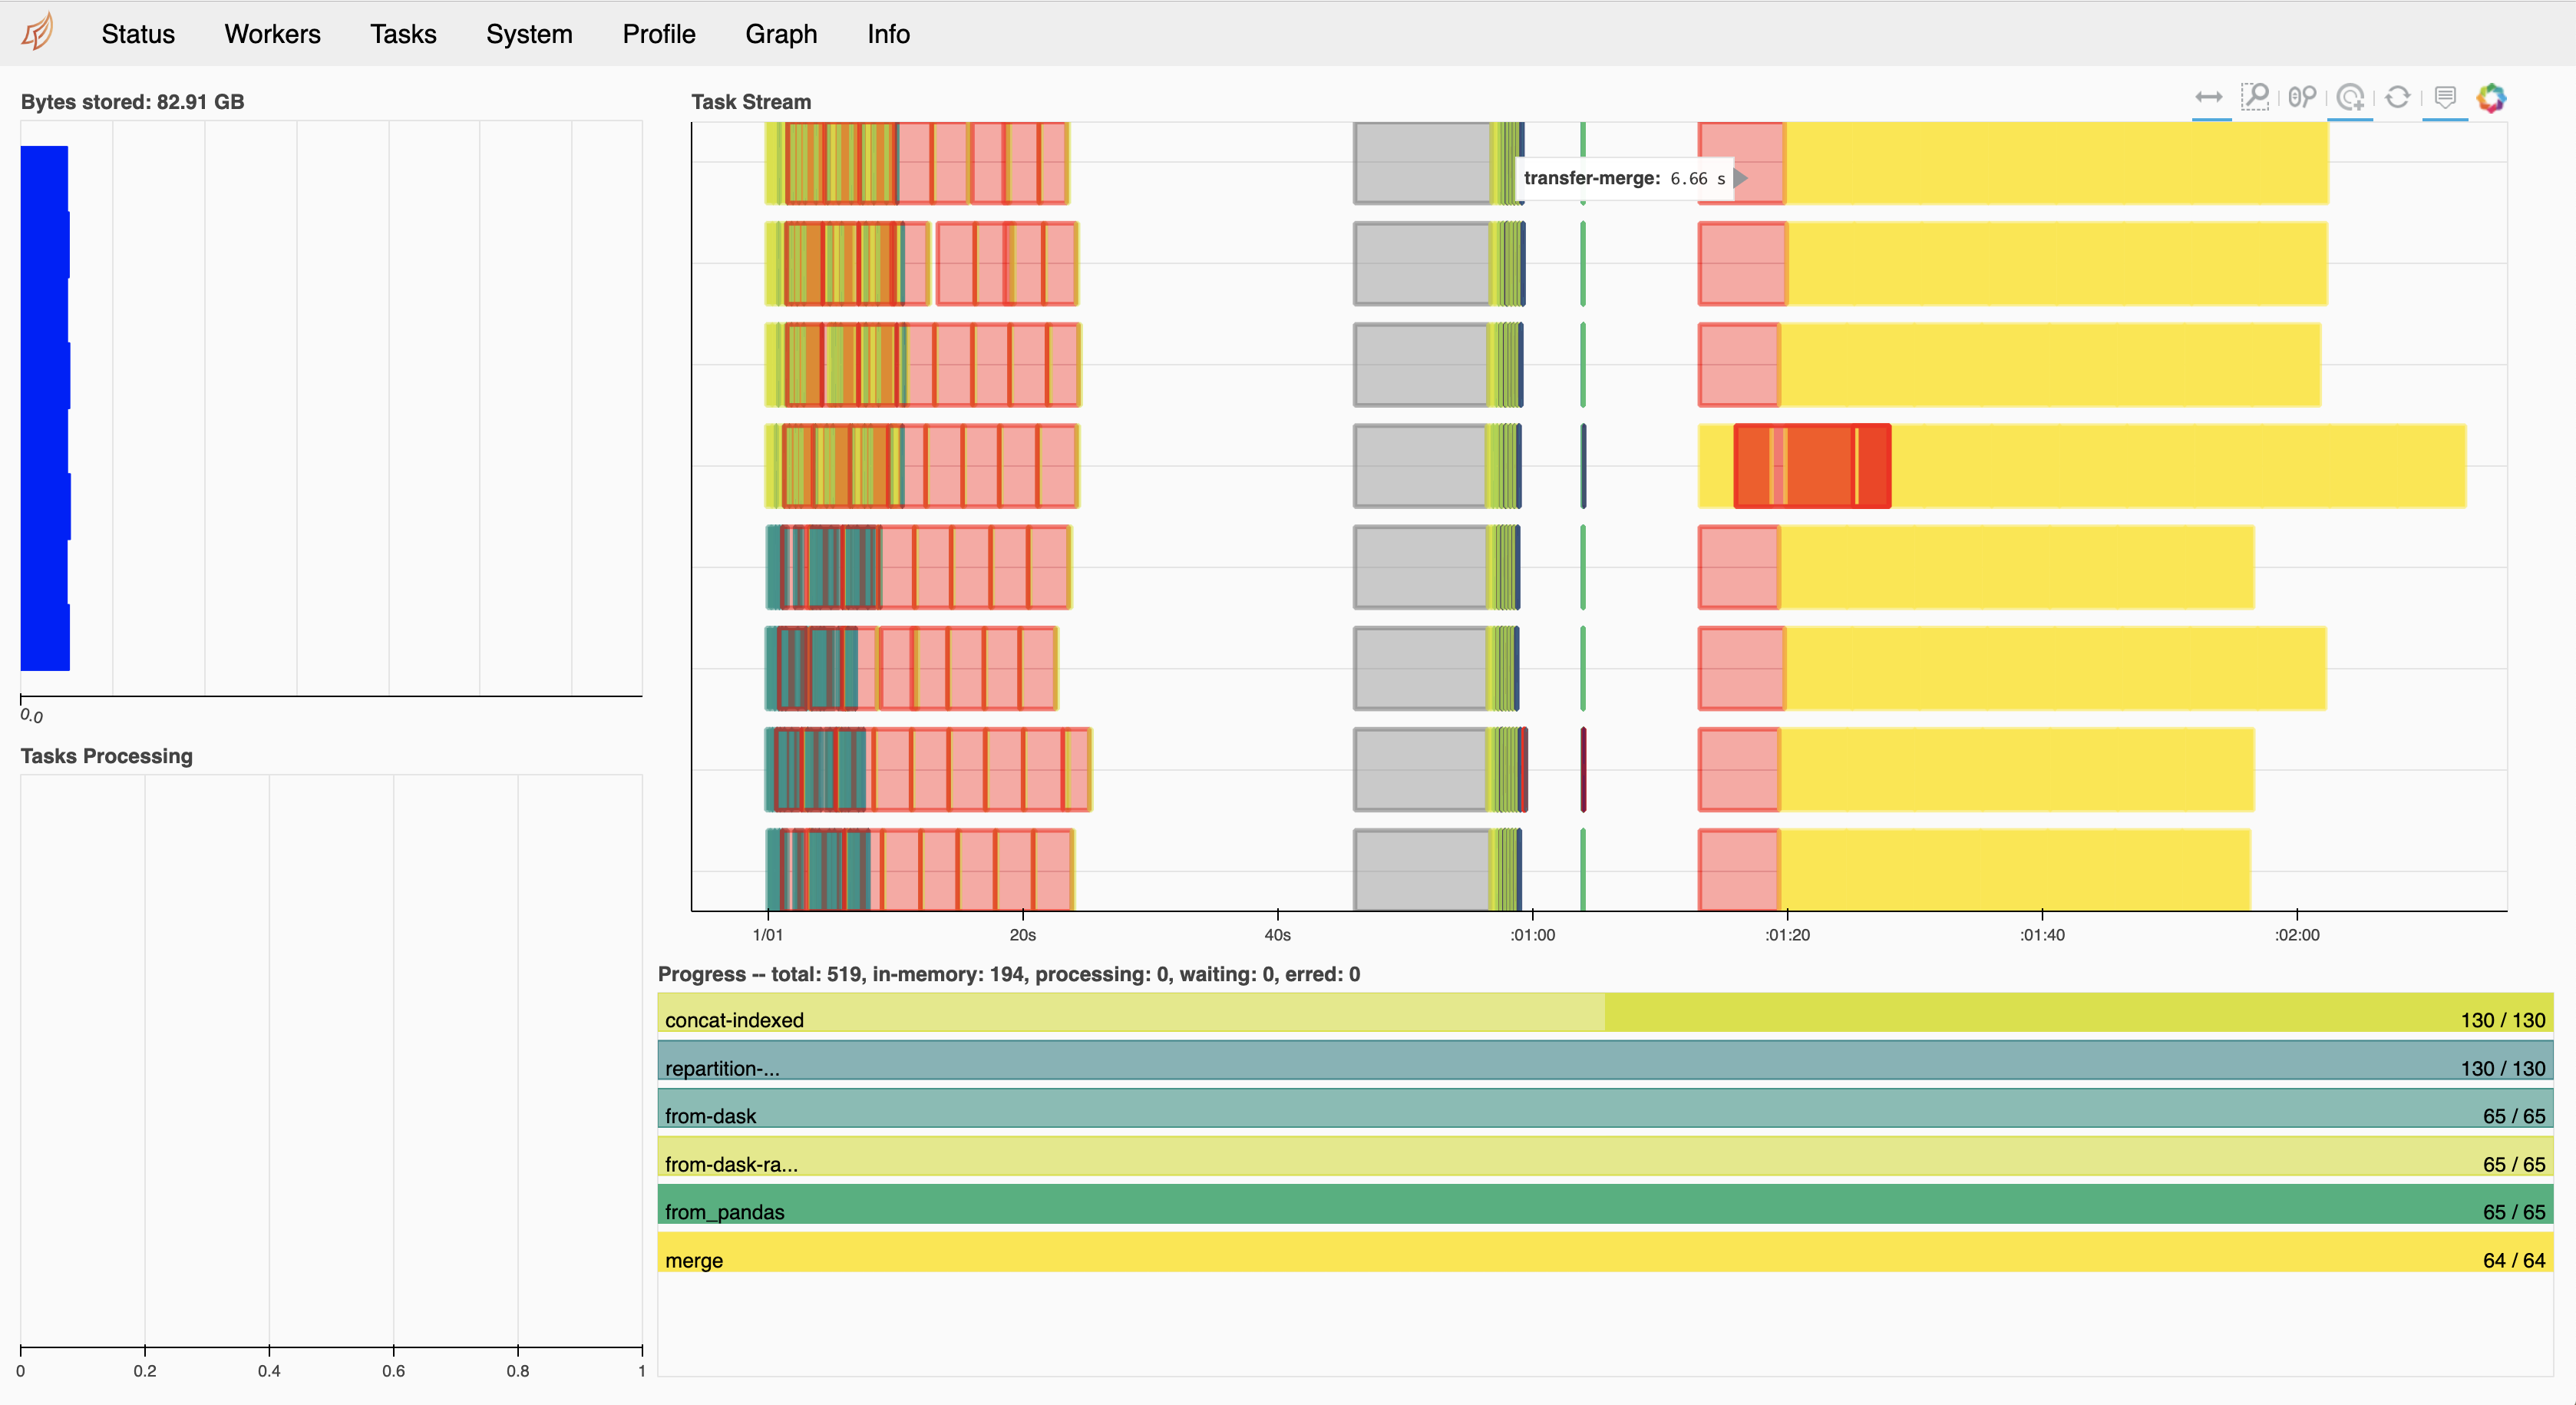
With TCP (Dask-CUDA LocalCUDACluster)
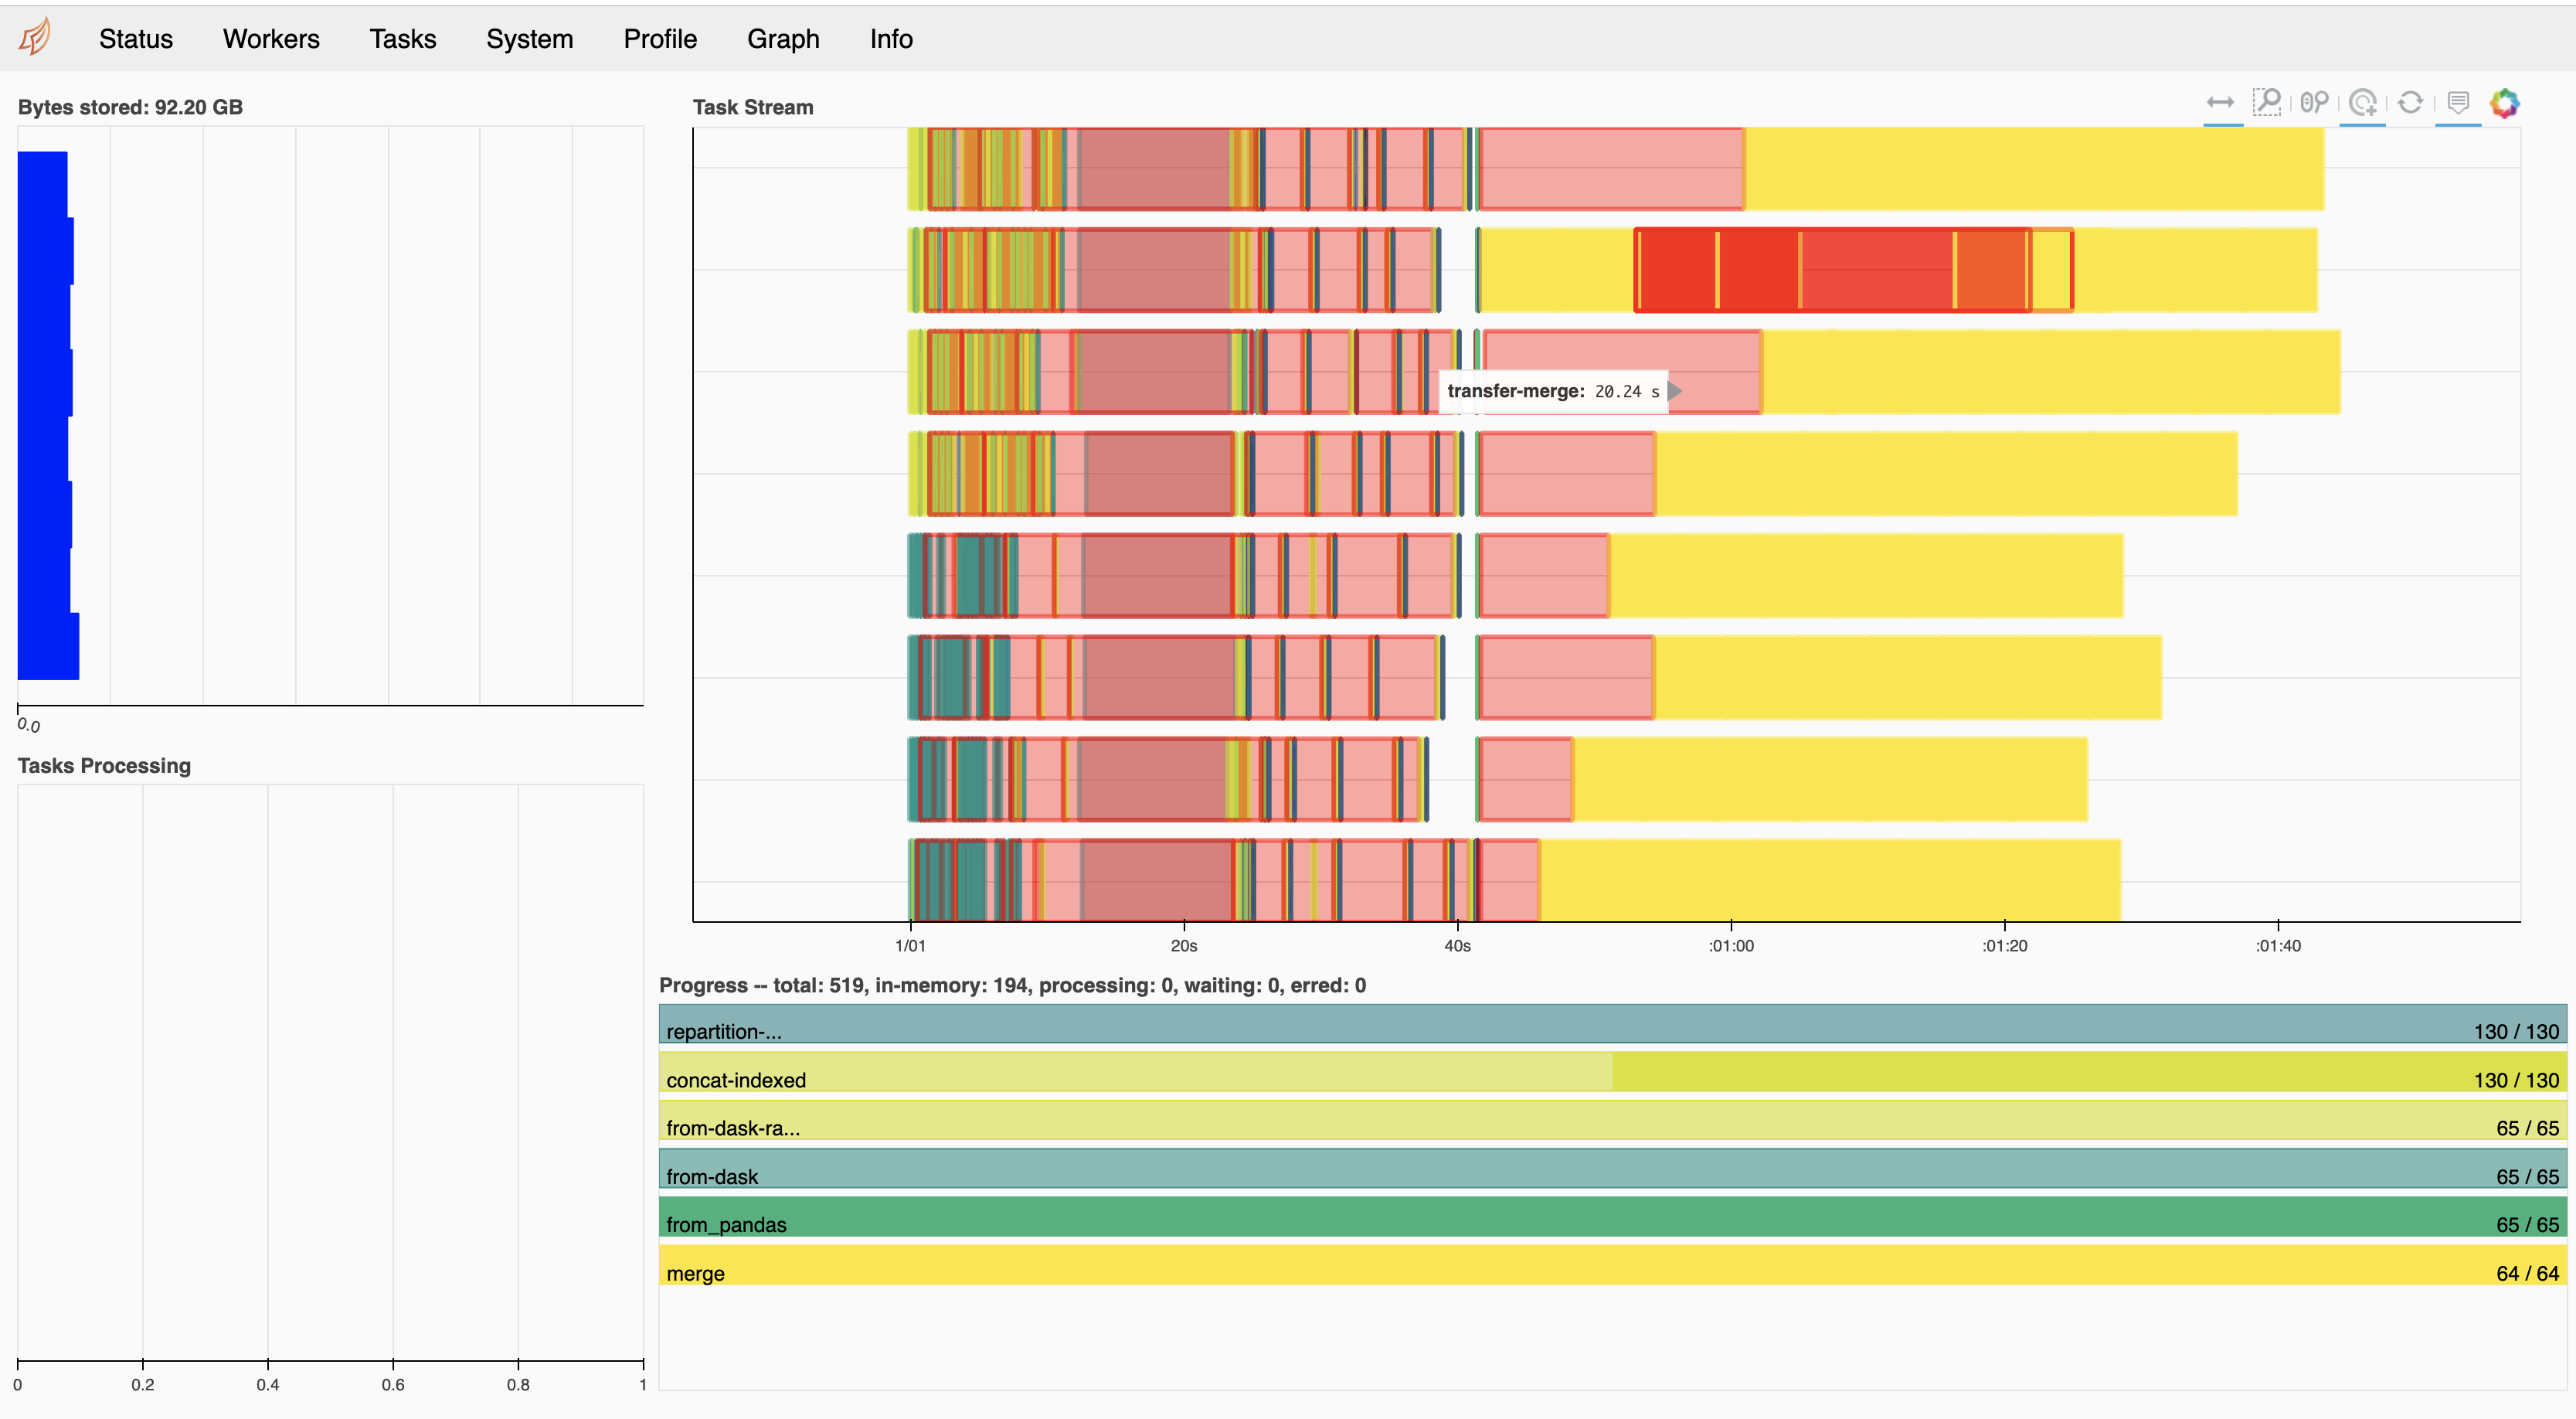
quasiben
on 19 Sep 2019
What are the huge gaps between tasks in the UCX profile above? I also still think it would be good to run with RMM pool mode enabled if possible as we're likely being completely bottlenecked within the ending merge operations in trying to allocate memory across the 8 gpus.
kkraus14
on 19 Sep 2019
I'm glad to see the speedup. However, I'm also curious about comparisons to speed of light here. If we're getting 10GB/s using NVLink then a 6s delay would mean that our chunks would be 60GB. If we're using IB then we might expect 2-5GB/s. My guess is that we're using smaller chunks, so we probably aren't at full performance yet. There is probably still plenty of work to do here is my guess.
mrocklin
on 19 Sep 2019
I ran with RMM and did not see much performance improvements. It should be noted that UCX does not know about RMM and cudaMalloc calls will be in addition to any pool created by RMM.
To the data transfer point, I observed data transfers of ~780 MB taking 6s (as measured by dask). My current understanding is that UCX chunks data into 8KB messages This PR https://github.com/openucx/ucx/pull/4123 may help mitigate the problem. For now we manipulate segment sizes with UCX_SEG_SIZE=2MB but I have not done that. Lastly, I want to share nvlink output after a run:
GPU 0: Tesla V100-SXM2-32GB (UUID: GPU-c2fece48-7c2a-fb72-b12a-1ec51c75effd)
         Link 0: Rx1: 750000 KBytes, Tx1: 240000 KBytes
         Link 1: Rx1: 0 KBytes, Tx1: 240000 KBytes
         Link 2: Rx1: 187500 KBytes, Tx1: 120000 KBytes
         Link 3: Rx1: 187499 KBytes, Tx1: 120000 KBytes
         Link 4: Rx1: 187500 KBytes, Tx1: 120000 KBytes
         Link 5: Rx1: 187499 KBytes, Tx1: 120000 KBytes
GPU 1: Tesla V100-SXM2-32GB (UUID: GPU-2bcc2433-3b0b-8903-4a6d-84d6d7185db3)
         Link 0: Rx1: 0 KBytes, Tx1: 0 KBytes
         Link 1: Rx1: 0 KBytes, Tx1: 0 KBytes
         Link 2: Rx1: 0 KBytes, Tx1: 0 KBytes
         Link 3: Rx1: 240000 KBytes, Tx1: 750000 KBytes
         Link 4: Rx1: 0 KBytes, Tx1: 0 KBytes
         Link 5: Rx1: 0 KBytes, Tx1: 0 KBytes
GPU 2: Tesla V100-SXM2-32GB (UUID: GPU-85407420-6d95-5e17-4f56-144a4625fede)
         Link 0: Rx1: 0 KBytes, Tx1: 0 KBytes
         Link 1: Rx1: 0 KBytes, Tx1: 0 KBytes
         Link 2: Rx1: 240000 KBytes, Tx1: 0 KBytes
         Link 3: Rx1: 0 KBytes, Tx1: 0 KBytes
         Link 4: Rx1: 0 KBytes, Tx1: 0 KBytes
         Link 5: Rx1: 0 KBytes, Tx1: 0 KBytes
GPU 3: Tesla V100-SXM2-32GB (UUID: GPU-1a67c050-8f96-b4bb-6ac1-4d112d1de586)
         Link 0: Rx1: 120000 KBytes, Tx1: 187500 KBytes
         Link 1: Rx1: 0 KBytes, Tx1: 0 KBytes
         Link 2: Rx1: 0 KBytes, Tx1: 0 KBytes
         Link 3: Rx1: 0 KBytes, Tx1: 0 KBytes
         Link 4: Rx1: 120000 KBytes, Tx1: 187499 KBytes
         Link 5: Rx1: 0 KBytes, Tx1: 0 KBytes
GPU 4: Tesla V100-SXM2-32GB (UUID: GPU-76cbcc68-0b84-ed43-08c3-e6abd7d113e9)
         Link 0: Rx1: 120000 KBytes, Tx1: 187499 KBytes
         Link 1: Rx1: 0 KBytes, Tx1: 0 KBytes
         Link 2: Rx1: 0 KBytes, Tx1: 0 KBytes
         Link 3: Rx1: 0 KBytes, Tx1: 0 KBytes
         Link 4: Rx1: 120000 KBytes, Tx1: 187500 KBytes
         Link 5: Rx1: 0 KBytes, Tx1: 0 KBytes
GPU 5: Tesla V100-SXM2-32GB (UUID: GPU-f6b7ba47-0e35-e5f4-a32b-122aee107e72)
         Link 0: Rx1: 0 KBytes, Tx1: 0 KBytes
         Link 1: Rx1: 0 KBytes, Tx1: 0 KBytes
         Link 2: Rx1: 0 KBytes, Tx1: 0 KBytes
         Link 3: Rx1: 0 KBytes, Tx1: 0 KBytes
         Link 4: Rx1: 0 KBytes, Tx1: 0 KBytes
         Link 5: Rx1: 0 KBytes, Tx1: 0 KBytes
GPU 6: Tesla V100-SXM2-32GB (UUID: GPU-21e47961-1fbb-b666-02e2-e856ec9f6fa8)
         Link 0: Rx1: 0 KBytes, Tx1: 0 KBytes
         Link 1: Rx1: 0 KBytes, Tx1: 0 KBytes
         Link 2: Rx1: 0 KBytes, Tx1: 0 KBytes
         Link 3: Rx1: 0 KBytes, Tx1: 0 KBytes
         Link 4: Rx1: 0 KBytes, Tx1: 0 KBytes
         Link 5: Rx1: 0 KBytes, Tx1: 0 KBytes
GPU 7: Tesla V100-SXM2-32GB (UUID: GPU-bfd06e26-b8df-06ec-a144-91c26357d05b)
         Link 0: Rx1: 0 KBytes, Tx1: 0 KBytes
         Link 1: Rx1: 0 KBytes, Tx1: 0 KBytes
         Link 2: Rx1: 0 KBytes, Tx1: 0 KBytes
         Link 3: Rx1: 0 KBytes, Tx1: 0 KBytes
         Link 4: Rx1: 0 KBytes, Tx1: 0 KBytes
         Link 5: Rx1: 0 KBytes, Tx1: 0 KBytes
What you should notice is that GPUs 5,6,7 have 0 data transfer
quasiben
on 19 Sep 2019
We have join benchmarks with UCX logged here: https://github.com/rapidsai/ucx-py/wiki/Benchmarks . We are now working on improving performance
quasiben
on 22 Jan 2020
Related issues
 saifrahmed
·
3Comments
kkraus14
·
3Comments
saifrahmed
·
3Comments
kkraus14
·
3Comments
 yasmina-altair
·
3Comments
yasmina-altair
·
3Comments
 galipremsagar
·
3Comments
galipremsagar
·
3Comments
 ayushdg
·
3Comments
ayushdg
·
3Comments