Cudf: [QST] cuDF performance with gridsearchcv
In a conversation with @kkraus14 about cudf usage with cuml+gridsearch we looked at cudf performance. Attached is profile plot of running gridsearch+cuml+cudf.

Folks can download the full dask profile here:
https://gist.github.com/quasiben/1da49c5aa6e61d979dd42ce6c50e79b3
In the image above you can see that the computation is spending ~80% in the iloc call. My initial thought was that iloc/_prepare_series_for_add could be improved. I believe @kkraus14 suggested we look at host_to_device transfers see if we can build requisite indicies in cuda/cupy/numba_cuda instead of numpy (this is required during splitting/kfold calls)
 quasiben
All 59 comments
I'd like to do a little back-of-the-envelope calculation on the expected cost of host-to-device transfers.
Lets say that we have a 1GB dataset with ten columns of float32s. This is 25 million rows. An array to slice into this dataset would be 25MB (assuming 1-byte booleans). What are host-to-device transfer speeds? Lets say that they're 1GB/s, so a transfer would be around 25ms. How long does it take a cuml algorithm to train a dataset of this size?
My guess is that transfer speeds are a bit higher than 1GB/s and that training times take longer than 25ms (though I would not be surprised to be wrong here, GPUs are magical after all). If these guesses are correct then I doubt that the cost is in host-to-device transfers.
If transfer times are significant then we could also look into compressing the data on the host side before sending it over in this special case.
def iloc(self, indexer):
    if indexer.dtype == bool:
        ...
Using 1-bit booleans would take that transfer time down significantly.
 mrocklin
on 30 May 2019
mrocklin
on 30 May 2019
I'd like to do a little back-of-the-envelope calculation on the expected cost of host-to-device transfers.
Lets say that we have a 1GB dataset with ten columns of float32s. This is 25 million rows. An array to slice into this dataset would be 25MB (assuming 1-byte booleans). What are host-to-device transfer speeds? Lets say that they're 1GB/s, so a transfer would be around 25ms. How long does it take a cuml algorithm to train a dataset of this size?
My guess is that transfer speeds are a bit higher than 1GB/s and that training times take longer than 25ms (though I would not be surprised to be wrong here, GPUs are magical after all). If these guesses are correct then I doubt that the cost is in host-to-device transfers.
If transfer times are significant then we could also look into compressing the data on the host side before sending it over in this special case.
def iloc(self, indexer):
    if indexer.dtype == bool:
        ...
Using 1-bit booleans would take that transfer time down significantly.
The other thing to consider is the time it takes to allocate memory, though using the pool allocator could relieve the pressure from that. If you explore the linked profile you can see basically three noticeable operations taking time:
1) Host to device transfers
2) Device memory allocations / Device memory frees
3) Elementwise equality operations that we can remove (we check for content equality instead of reference equality in error)
 kkraus14
on 30 May 2019
kkraus14
on 30 May 2019
The profile very clearly shows that far and away the bottleneck is host to device transfers.
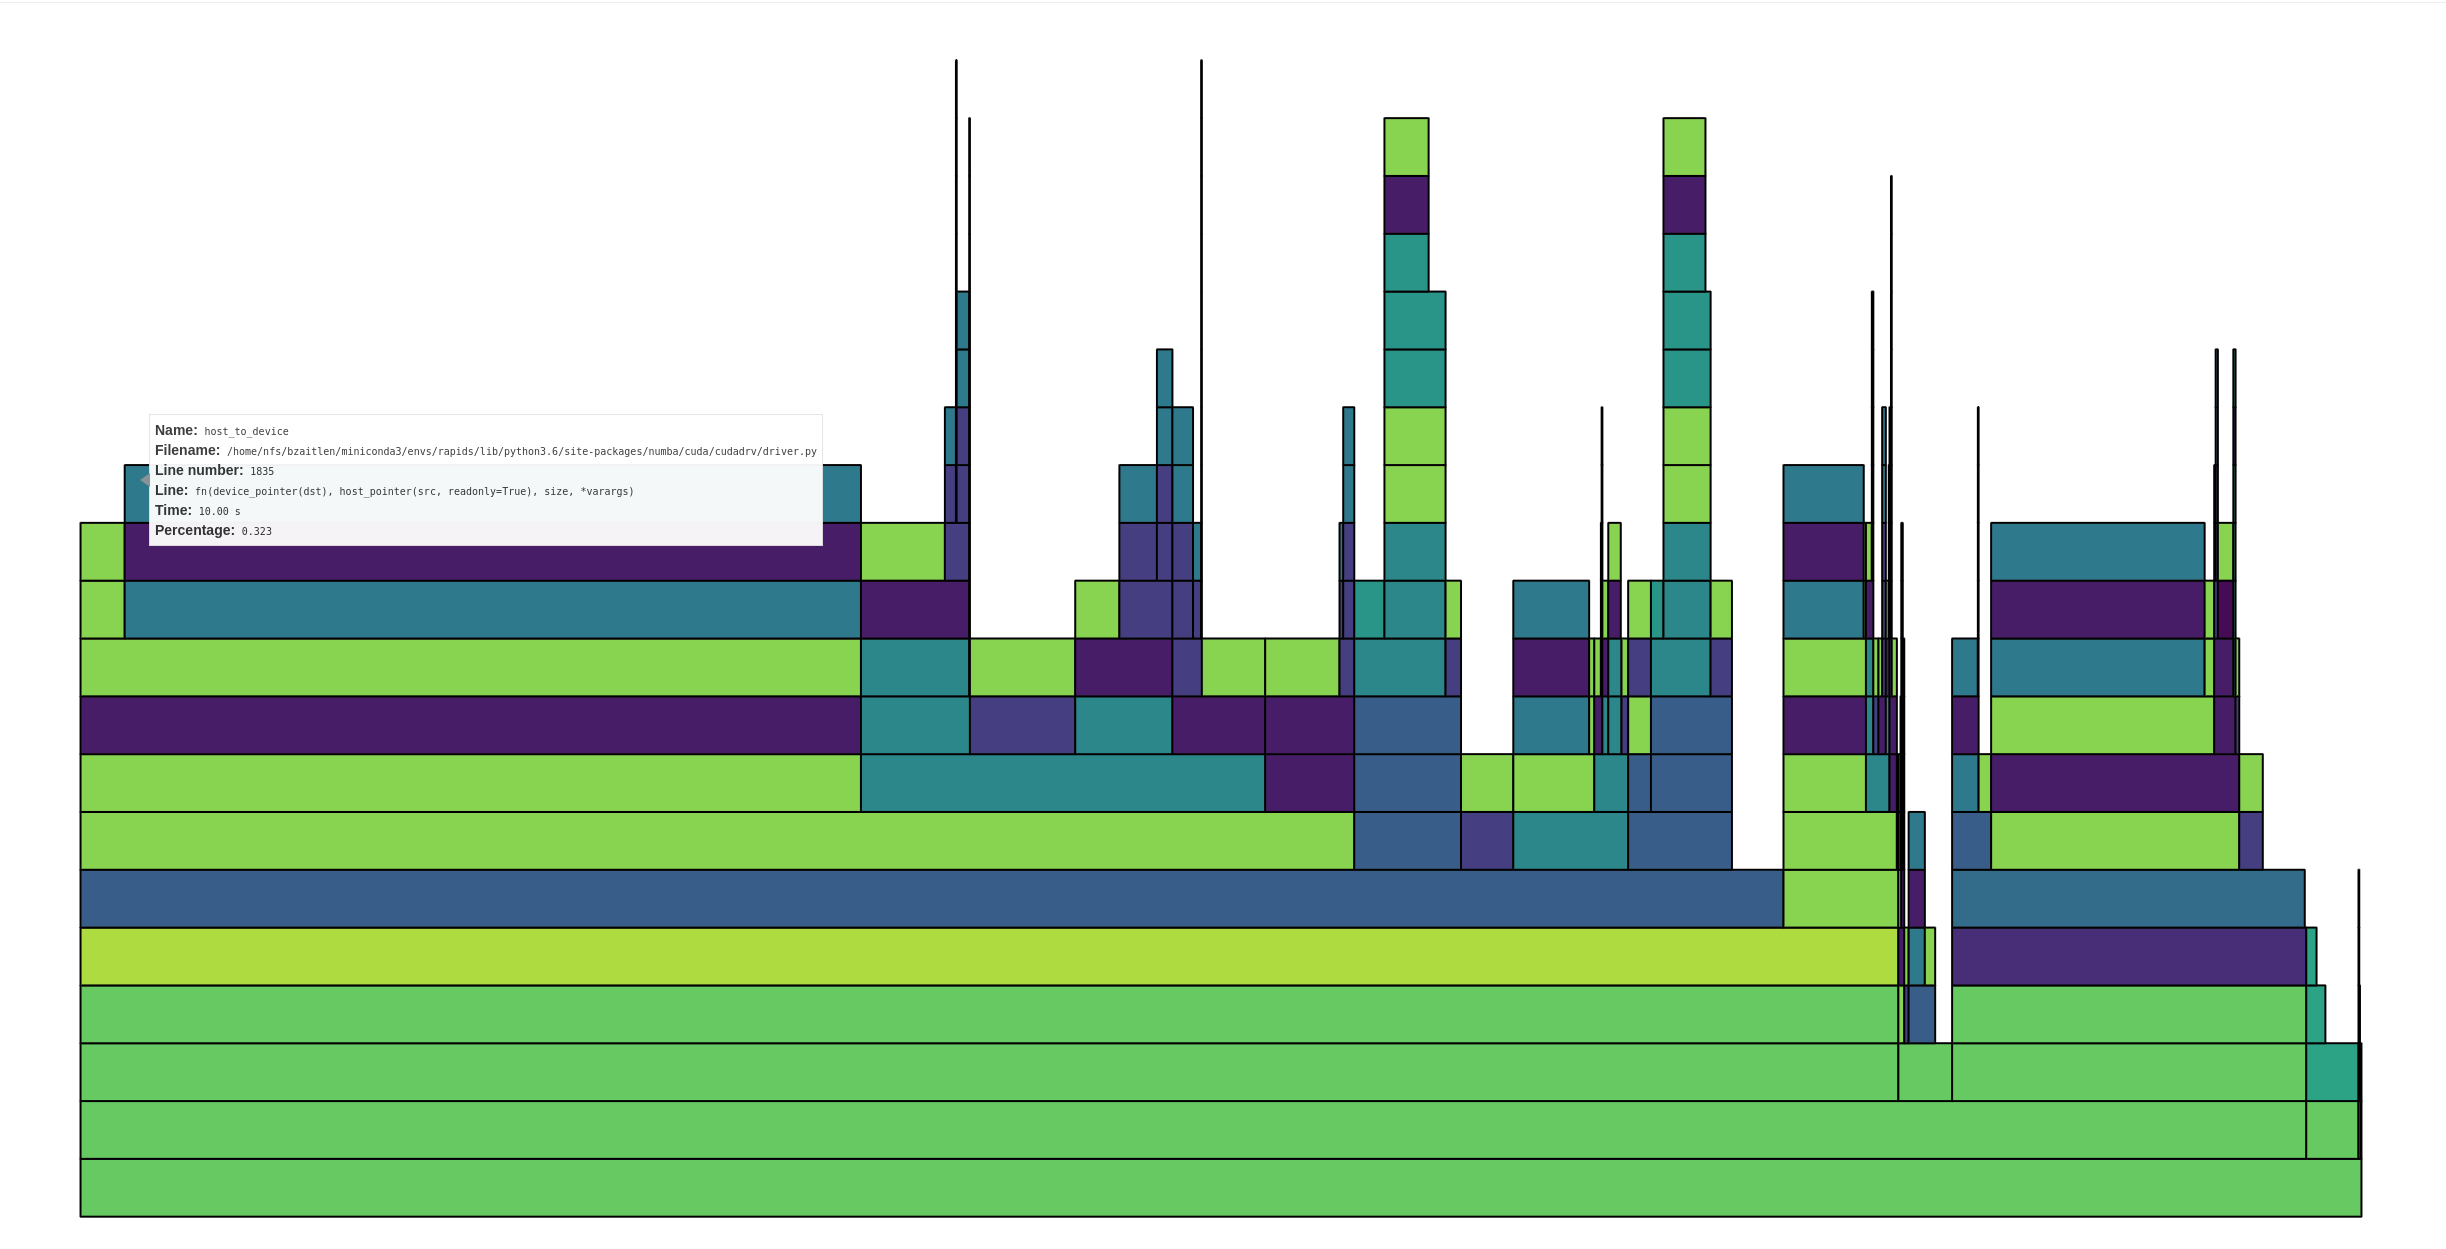
The box I'm hovering over shows ~1/3 time in host to device transfers, and that's not the only one. In total, I'd estimate anywhere from 50-75% of the time is in host to device transfers.
 jrhemstad
on 30 May 2019
jrhemstad
on 30 May 2019
Thanks @jrhemstad for looking into the profile. The host-to-device transfers, I believe, are occurring when sklearn creates host side indexes and uses those to subselect the dataframe
Specifically, a call like:
indices = np.arange(n_samples)
would either need to be monkeypatched or amending some of the function definition?
quasiben
on 30 May 2019
So does that mean that calls to fit are quite fast? In the 25ms range? Or is something else going on? I think that my back-of-the-envelope calculation shows that something else might be up. Maybe we're not moving data well between host and device somehow. Maybe we're moving way too much data for some reason. If my reasoning above is correct and if fit calls take much longer than 25ms, then something is off (two big ifs there though).
mrocklin
on 31 May 2019
The calls to fit are fast ~400ms.
I did some timings of iloc with various inputs and wanted to show them (see below).
Slicing is the fastest, numpy and cudf.Series iloc tests are very close, and I wrote small test to see if a numpy array could be expressed as a slice
In [1]: import pandas as pd

In [2]: import numpy as np

In [3]: import cudf

In [4]: df = pd.DataFrame({'a': range(100000)})

In [5]: arr = np.arange(40, 50000)

In [6]: cdf = cudf.from_pandas(df)

In [7]: %timeit cdf.iloc[arr] # vanilla numpy array
5.27 ms ± 171 µs per loop (mean ± std. dev. of 7 runs, 1 loop each)

In [8]: %timeit cdf.iloc[slice(40, 50000)] # slicing
747 µs ± 6.58 µs per loop (mean ± std. dev. of 7 runs, 1000 loops each)

In [9]: sr = cudf.Series(arr)

In [10]: %timeit cdf.iloc[sr] # gpu backed array

4.83 ms ± 72.6 µs per loop (mean ± std. dev. of 7 runs, 100 loops each)

In [11]: def test_range(array):
    ...:     min_val = array.min()
    ...:     max_val = array.max()
    ...:     test_range = np.arange(min_val, max_val+1)
    ...:     try:
    ...:         np.testing.assert_array_equal(test_range, array)
    ...:     except AssertionError:
    ...:         return array
    ...:     return slice(min_val, max_val)
    ...:

In [12]: def iloc_test(array):
    ...:     arr = test_range(array)
    ...:     return df.iloc[arr]
    ...:

In [13]: %timeit iloc_test(arr) # conditional test numpy->slice
1.23 ms ± 4.65 µs per loop (mean ± std. dev. of 7 runs, 1000 loops each)
@jakirkham and I recently revisited this work in a notebook here:
https://gist.github.com/9b86e189f3e4fe714c7ef8a566707236
We are still seeing timings for CPU/GPU indexing to be roughly the same. We are exploring how to minimize host-to-device transfers. I think it would be great if someone with deeper cudf indexing knowledge could meet with @jakirkham and/or @quasiben and explore if we can squeeze any more performance from iloc.
quasiben
on 21 Aug 2019
FWIW I was curious how CuPy performed in this case. Generated the following notebook with benchmarks: https://gist.github.com/jakirkham/d28d43d9d7e3a561e55988b9b922d983
It seems selection is fairly performant with CuPy arrays. Even in the worst case where the indices are on CPU, we are seeing a run time of ~100us. If we have the indices on the GPU, it's 5 times faster (so ~20us). Though I'm not sure if we need to worry about that at a first approximation.
Any thoughts on using CuPy here?
Edit: The benchmark had large error bars for the GPU indices case on the first set of runs. Subsequent runs have gravitated towards a shorter time with much smaller error bars. Have updated the result above to match this.
 jakirkham
on 21 Aug 2019
jakirkham
on 21 Aug 2019
To make things a bit more succinct, the bottleneck does not appear to be host-to-device transfers it appears to be .iloc. How can we improve that?
jakirkham
on 22 Aug 2019
@kkraus14 , I get the sense that you might want to weigh in here again
mrocklin
on 22 Aug 2019
.iloc performance should be fastest if your indices are on the device and of dtype int32:
In [27]: N = 100_000

In [28]: pos = np.arange(40, 50_000)

In [29]: a = cudf.Series(np.arange(N))

In [30]: %timeit a.iloc[pos] # pos is int64 host array
2.87 ms ± 1.05 µs per loop (mean ± std. dev. of 7 runs, 100 loops each)

In [31]: pos = cudf.Series(pos)._column

In [32]: %timeit a.iloc[pos] # pos is int64 device array
2.1 ms ± 3.64 µs per loop (mean ± std. dev. of 7 runs, 100 loops each)

In [33]: pos = pos.astype("int32")

In [34]: %timeit a.iloc[pos] # pos is int32 device array
1.82 ms ± 367 ns per loop (mean ± std. dev. of 7 runs, 1000 loops each)

In [35]: %timeit a.iloc[40:50_000]  # slicing is fastest
420 µs ± 347 ns per loop (mean ± std. dev. of 7 runs, 1000 loops each)

In [36]:
 shwina
on 22 Aug 2019
shwina
on 22 Aug 2019
Can someone dump a profile of where we're spending time in the iloc call? I'm sure there's some low hanging fruit in the Python / Cython that we can possibly clean up.
@jakirkham As we get into multi-GPU setups via Dask everything in host <--> device gets exponentially more expensive because of things like the CUDA API call serialization for host --> device copy and PCIe congestion. I wouldn't be surprised to see that when you hook up Dask to multiple GPUs in this scenario.
kkraus14
on 22 Aug 2019
.ilocperformance should be fastest if your indices are on the device and of dtypeint32:
Good to know. Unfortunately this is rarely going to be the case and likely not something we control.
jakirkham
on 22 Aug 2019
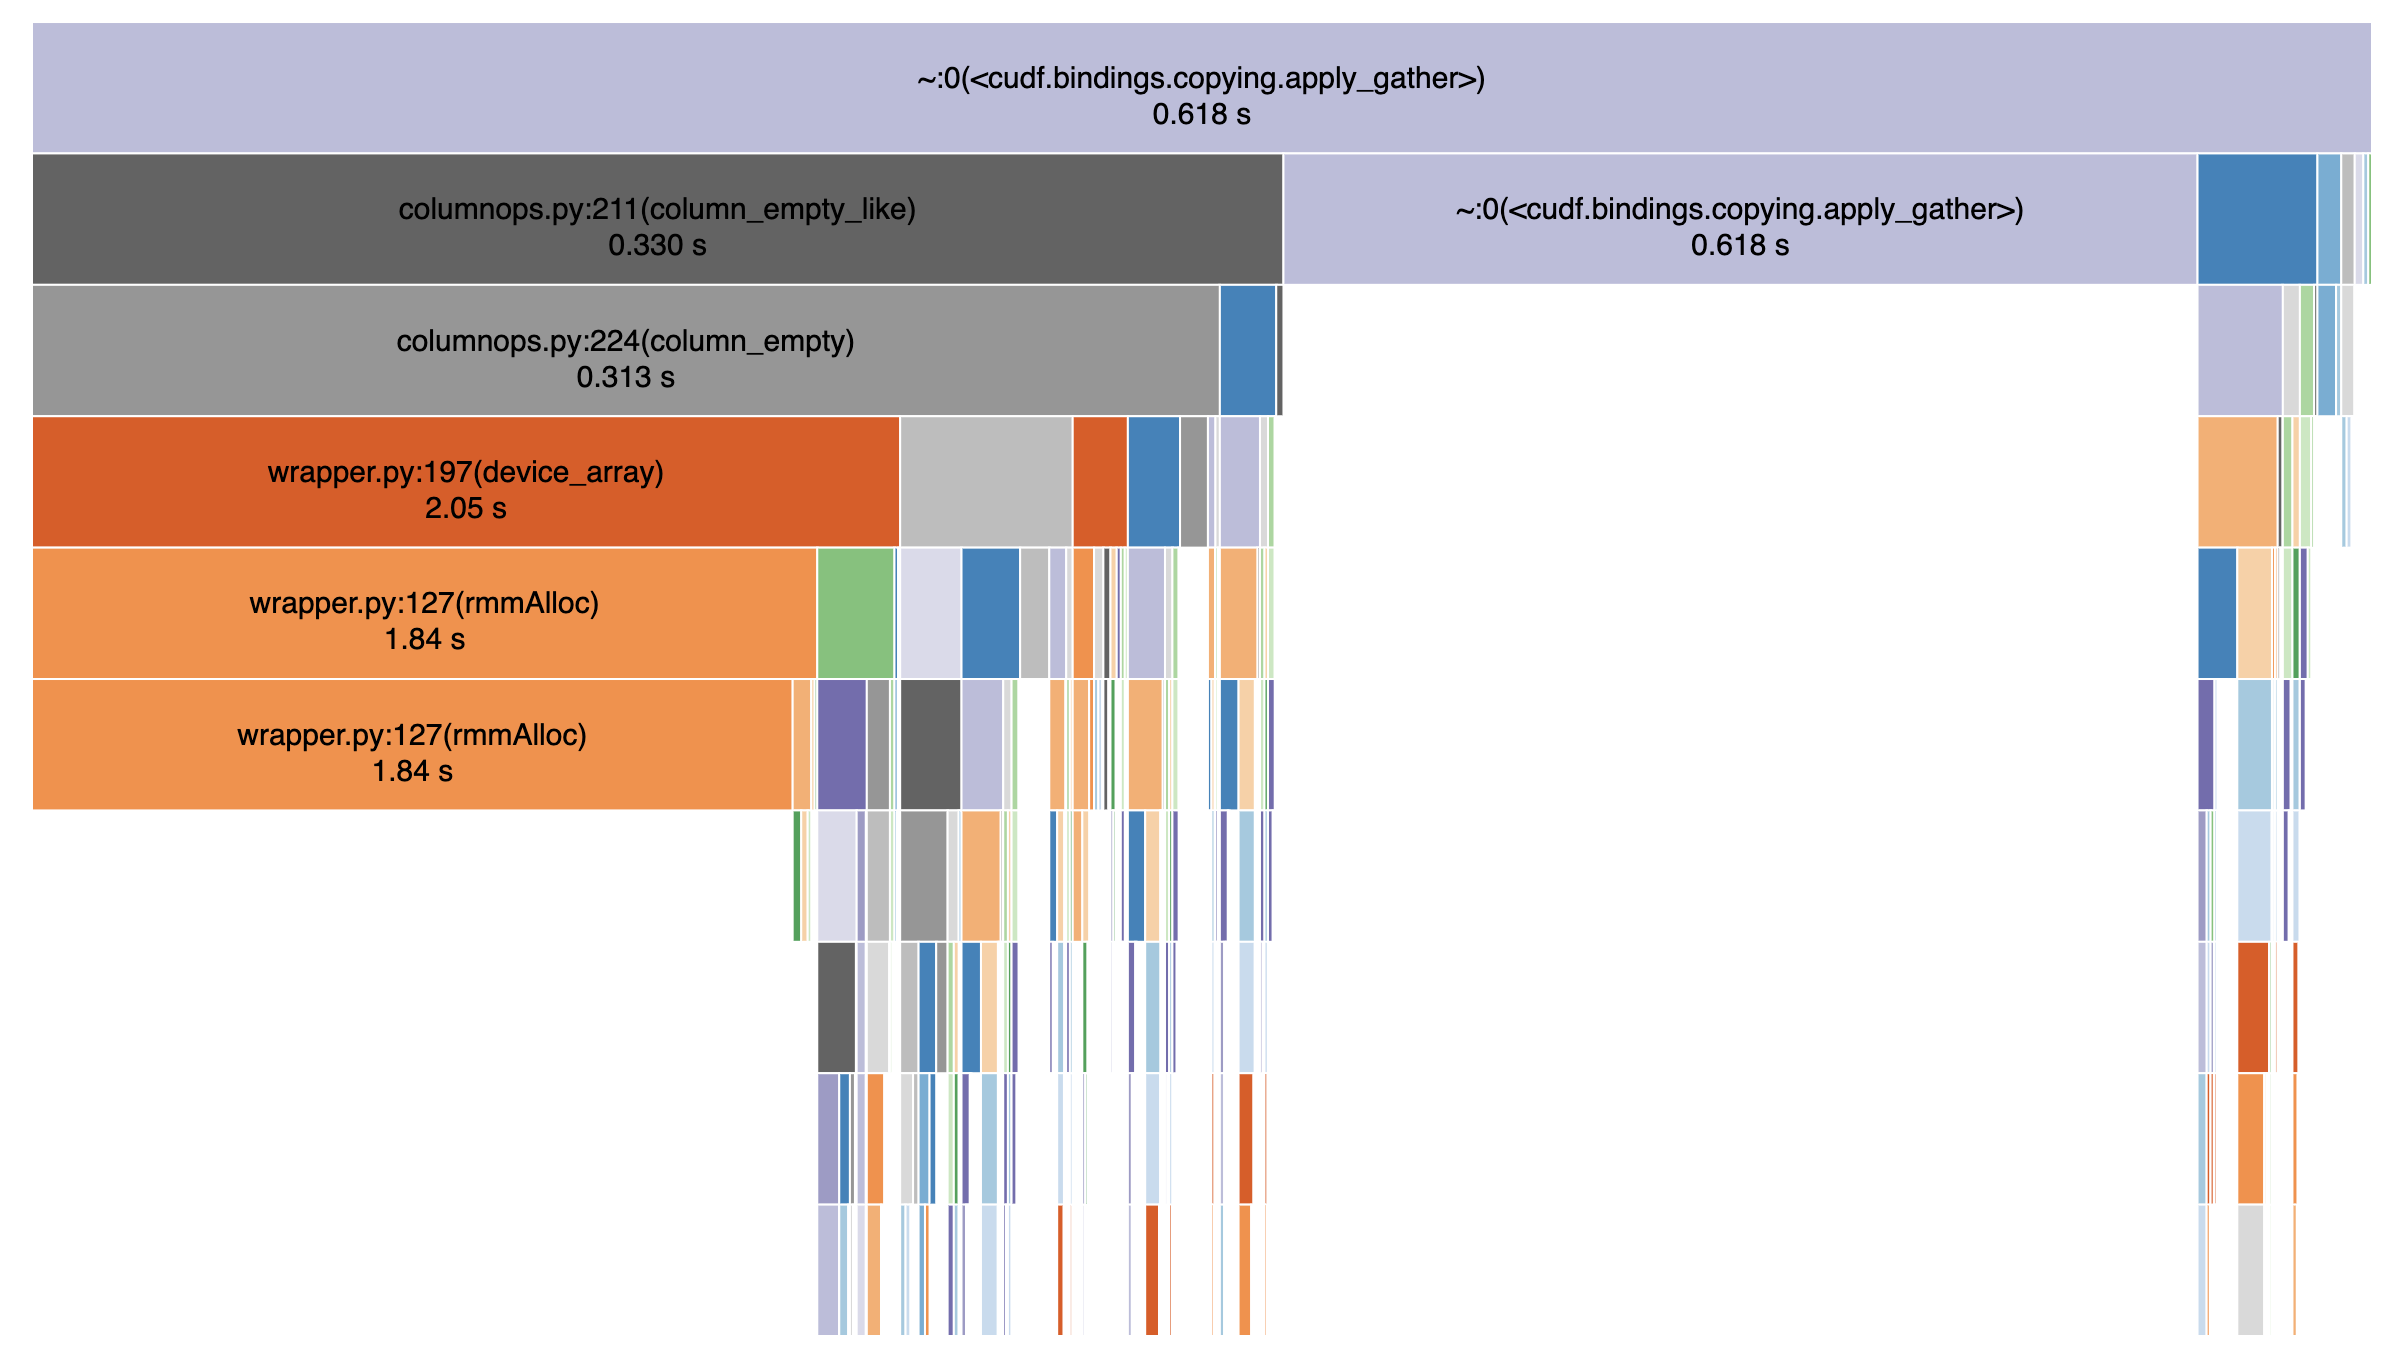
Here's the profile:
A significant (1/3rd) part of the gather call is spent normalizing negative indices.
shwina
on 22 Aug 2019
Could we use int32? In the case of Scikit-Learn I wonder if they would be
open to using int32 (or smaller) if we know that the size of the
array-to-be-indexed is small enough. This would be a performance
optimization on the CPU side as well.
On Thu, Aug 22, 2019 at 5:44 AM jakirkham notifications@github.com wrote:
.iloc performance should be fastest if your indices are on the device and
of dtype int32:Good to know. Unfortunately this is rarely going to be the case and likely
not something we control.—
You are receiving this because you commented.
Reply to this email directly, view it on GitHub
https://github.com/rapidsai/cudf/issues/1888?email_source=notifications&email_token=AACKZTBH3F6PJ3LPUL6MAKTQF2C3HA5CNFSM4HRG7SZKYY3PNVWWK3TUL52HS4DFVREXG43VMVBW63LNMVXHJKTDN5WW2ZLOORPWSZGOD446W3Q#issuecomment-523889518,
or mute the thread
https://github.com/notifications/unsubscribe-auth/AACKZTCSNO723FW2SGAIOATQF2C3HANCNFSM4HRG7SZA
.
mrocklin
on 22 Aug 2019
A significant (1/3rd) part of the gather call is spent normalizing negative indices.
Thanks @shwina! Where is the code for this?
jakirkham
on 22 Aug 2019
Apologies. Here's the code used to generate the profile:
import numpy as np

import cudf

N = 100_000

a = cudf.Series(np.arange(N))
pos = cudf.Series(np.arange(50, 50_000).astype("int32"))._column

for i in range(2000):
    a.iloc[pos]
Thanks for sharing that. Where in .iloc are we normalizing negative indices?
jakirkham
on 22 Aug 2019
It's the call to binary_operator under cudf.bindings.copying.apply_gather:
https://github.com/rapidsai/cudf/blob/branch-0.10/python/cudf/cudf/bindings/copying.pyx#L45-L49
shwina
on 22 Aug 2019
Just so I understand, why is the casting to int32 needed on these lines?
jakirkham
on 22 Aug 2019
Because the underlying libcudf function we use (gather) expects a gather map of int32 indices:
https://github.com/rapidsai/cudf/blob/branch-0.10/cpp/include/cudf/copying.hpp#L254-L255
shwina
on 22 Aug 2019
I see. So under the hood our data structures are based around int32 indexing. Correct?
jakirkham
on 22 Aug 2019
Correct.
Re: cupy performance, I wonder if ranges of indices are optimized to slices - and if that could explain the vast performance difference?
a = np.arange(100_000)
idxs = np.arange(50_000)
idxs2 = np.random.randint(0, 100_000, 50_000

ca = cp.asarray(a)
cidxs = cp.asarray(idxs)
cidxs2 = cp.asarray(idx2)

# how do timings compare for the below
ca[cidxs]
ca[cidxs2]
Thanks for explaining that to me. 🙂
jakirkham
on 22 Aug 2019
It's a fair question. The old benchmark should have had a better mixing of indices. Here's what I'm seeing with the case you put forward above.
In [4]: %timeit ca[cidxs]
21.3 µs ± 117 ns per loop (mean ± std. dev. of 7 runs, 100000 loops each)

In [5]: %timeit ca[cidxs2]
20.6 µs ± 311 ns per loop (mean ± std. dev. of 7 runs, 10000 loops each)
Edit: So it seems they are pretty similar even if the indices are randomly sampled.
jakirkham
on 22 Aug 2019
So I tried slowly building up the expression in _normalize_maps with a dummy series to see what happens. The final line is basically the runtime of _normalize_maps. Dropped profiling the attribute access as this is basically negligible in comparison.
Here's what I found. The cast is certainly expensive. Though so is the modulus.
In [2]: N = 100_000
   ...: a = cudf.Series(np.arange(N))

In [3]: %timeit cudf.dataframe.columnops.as_column(a)
2.99 µs ± 12.1 ns per loop (mean ± std. dev. of 7 runs, 100000 loops each)

In [4]: %timeit cudf.dataframe.columnops.as_column(a).astype("int32")
406 µs ± 7.74 µs per loop (mean ± std. dev. of 7 runs, 1000 loops each)

In [5]: %timeit cudf.dataframe.columnops.as_column(a).astype("int32").binary_operator("mod", np.int32(N))
720 µs ± 84.4 µs per loop (mean ± std. dev. of 7 runs, 1 loop each)
I wondered if we were getting bound by more-or-less performing a copy, but was a bit surprised to learn performing a copy took longer than the cast. Am I doing something wrong here?
In [8]: %timeit cudf.dataframe.columnops.as_column(a).copy()
2.67 ms ± 39.3 µs per loop (mean ± std. dev. of 7 runs, 1000 loops each)
Of course this is operating on int64. So tried the same with int32, but it seems to take roughly the same amount of time.
In [10]: a32 = cudf.dataframe.columnops.as_column(a).astype("int32")

In [11]: %timeit a32.copy()
4.13 ms ± 1.46 ms per loop (mean ± std. dev. of 7 runs, 100 loops each)
I think the summary of the above is casting and modulus take basically all of the time in _normalize_maps. Tried to see how much longer these took than a simple copy, but may have messed up that part somehow.
jakirkham
on 22 Aug 2019
Yeah even after getting rid of normalize_maps completely and a couple of small optimizations, what I'm left with is apply_gather spending its time evenly between memory allocation and the libcudf call:
In [4]: N = 100_000

In [5]: a = cudf.Series(np.arange(N))._column

In [6]: pos = cudf.Series(np.arange(50, 50_000)).astype('int32')._column.data.mem

In [7]: %timeit a[pos]
285 µs ± 326 ns per loop (mean ± std. dev. of 7 runs, 1000 loops each)
Is there room for improvement in apply_gather?
jakirkham
on 22 Aug 2019
Yes -- but from the profile above, the best performance we can get right now still seems to be about an order of magnitude off from cupy's (285us v/s 20us). Perhaps @jrhemstad would like to look at these numbers.
I'll investigate the possibility of getting us as close as possible to the 285 us shown above.
shwina
on 22 Aug 2019
Well the flip side of that is it would be an order of magnitude faster than cuDF is today. 😉 Thanks for looking into this @shwina! 😀
jakirkham
on 23 Aug 2019
Based on a discussion with @jrhemstad and @harrism:
- The primary reason for the slow iloc performance we are seeing on the libcudf side is the time spent doing memory allocations. cupy (by default) uses a pool allocator while we do not. @jakirkham you should see much better iloc performance by enabling the rmm pool allocator (the order of the below commands is important):
from librmm_cffi import librmm_config as rmm_cfg
import cudf
cudf.rmm.finalize()
rmm_cfg.use_pool_allocator = True
cudf.rmm.initialize()
This should improve performance across the entire workflow (not just iloc).
- There are other optimizations we can do: a significant portion of time is spent normalizing the gathermap (converting int64 values to int32, normalizing negative indices) and it should be feasible to implement solutions to these in the short term if iloc remains a bottleneck.
shwina
on 23 Aug 2019
There are other optimizations we can do: a significant portion of time is spent normalizing the gathermap (converting int64 values to int32, normalizing negative indices) and it should be feasible to implement solutions to these in the short term if iloc remains a bottleneck.
See https://github.com/rapidsai/cudf/issues/2675 for cuDF gather optimizations.
jrhemstad
on 23 Aug 2019
There may also be room for Cython optimizations in apply_gather. For example, here we are using enumerate, but we only use the index. We could change this to range and Cython would give us a C for-loop. There are probably more things like this.
Though haven't benchmarked that closely yet. So I'm not sure how much this kind of cleanup matters. Just mentioning it as other possible low hanging fruit.
jakirkham
on 23 Aug 2019
PRs #2682 and #2775 introduce set_allocator (for enabling GPU memory pool) and gather improvements respectively. Here are the results so far:
- CuPy
In [1]: from iloc_test import *

In [2]: cupy_iloc = CupyIloc(10_000)

In [3]: %timeit cupy_iloc.run()
18.8 µs ± 47.2 ns per loop (mean ± std. dev. of 7 runs, 100000 loops each)

In [4]: cupy_iloc = CupyIloc(100_000)

In [5]: %timeit cupy_iloc.run()
19.5 µs ± 28.1 ns per loop (mean ± std. dev. of 7 runs, 100000 loops each)

In [6]: cupy_iloc = CupyIloc(1_000_000)

In [7]: %timeit cupy_iloc.run()
38.6 µs ± 43.9 ns per loop (mean ± std. dev. of 7 runs, 10000 loops each)

In [8]: cupy_iloc = CupyIloc(10_000_000)

In [9]: %timeit cupy_iloc.run()
222 µs ± 91 ns per loop (mean ± std. dev. of 7 runs, 1000 loops each)

In [10]: cupy_iloc = CupyIloc(100_000_000)

In [11]: %timeit cupy_iloc.run()
2.03 ms ± 108 ns per loop (mean ± std. dev. of 7 runs, 100 loops each)
- cuDF (without pool and before gather optimizations)
In [12]: cudf_iloc = CudfIloc(10_000)

In [13]: %timeit cudf_iloc.run()
2.06 ms ± 1.7 µs per loop (mean ± std. dev. of 7 runs, 100 loops each)

In [14]: cudf_iloc = CudfIloc(100_000)

In [15]: %timeit cudf_iloc.run()
2.99 ms ± 562 µs per loop (mean ± std. dev. of 7 runs, 100 loops each)

In [16]: cudf_iloc = CudfIloc(1_000_000)

In [17]: %timeit cudf_iloc.run()
4.51 ms ± 686 µs per loop (mean ± std. dev. of 7 runs, 100 loops each)

In [18]: cudf_iloc = CudfIloc(10_000_000)

In [19]: %timeit cudf_iloc.run()
7.39 ms ± 592 µs per loop (mean ± std. dev. of 7 runs, 100 loops each)

In [20]: cudf_iloc = CudfIloc(100_000_000)

In [21]: %timeit cudf_iloc.run()
37.4 ms ± 22.7 ms per loop (mean ± std. dev. of 7 runs, 10 loops each)
- cuDF (with pool and before gather optimizations)
In [2]: cudf_iloc = CudfIloc(10_000)

In [3]: %timeit cudf_iloc.run()
1.82 ms ± 4.15 µs per loop (mean ± std. dev. of 7 runs, 1000 loops each)

In [4]: cudf_iloc = CudfIloc(100_000)

In [5]: %timeit cudf_iloc.run()
1.78 ms ± 2.04 µs per loop (mean ± std. dev. of 7 runs, 1000 loops each)

In [6]: cudf_iloc = CudfIloc(1_000_000)

In [7]: %timeit cudf_iloc.run()
1.81 ms ± 5.52 µs per loop (mean ± std. dev. of 7 runs, 1000 loops each)

In [8]: cudf_iloc = CudfIloc(10_000_000)

In [9]: %timeit cudf_iloc.run()
2.14 ms ± 21.1 µs per loop (mean ± std. dev. of 7 runs, 100 loops each)

In [10]: cudf_iloc = CudfIloc(100_000_000)

In [11]: %timeit cudf_iloc.run()
8.77 ms ± 675 ns per loop (mean ± std. dev. of 7 runs, 100 loops each)
- cuDF (with pool and gather optimizations)
In [1]: from iloc_test import *

In [2]: cudf_iloc = CudfIloc(10_000)

In [3]: %timeit cudf_iloc.run()
1.06 ms ± 198 ns per loop (mean ± std. dev. of 7 runs, 1000 loops each)

In [4]: cudf_iloc = CudfIloc(100_000)

In [5]: %timeit cudf_iloc.run()
1.06 ms ± 307 ns per loop (mean ± std. dev. of 7 runs, 1000 loops each)

In [6]: cudf_iloc = CudfIloc(1_000_000)

In [7]: %timeit cudf_iloc.run()
1.08 ms ± 234 ns per loop (mean ± std. dev. of 7 runs, 1000 loops each)

In [8]: cudf_iloc = CudfIloc(10_000_000)

In [9]: %timeit cudf_iloc.run()
1.44 ms ± 650 ns per loop (mean ± std. dev. of 7 runs, 1000 loops each)

In [10]: cudf_iloc = CudfIloc(100_000_000)

In [11]: %timeit cudf_iloc.run()
5.96 ms ± 2.5 µs per loop (mean ± std. dev. of 7 runs, 100 loops each)
Keep in mind that iloc on a cuDF series performs a gather operation on both a data column and an index column, so the performance of gather operations is currently comparable between CuPy and cuDF for very large inputs.
More improvements (both on the C++ and Python side) incoming as part of #2775.
shwina
on 12 Sep 2019
Benchmarks for non-contiguous gather, as the previous benchmarks were for the least interesting case of gathering contiguous indices:
Before any optimizations:

__getitem__ (ms)
sizes  cupy_times  cudf_times
0      10000    0.020242    0.844159
1     100000    0.021863    0.831406
2    1000000    0.063269    1.813774
3   10000000    1.023076    4.347990
4  100000000   11.196895   19.222527

__setitem__ (ms)
sizes       cupy       cudf
0      10000   0.016682   0.754948
1     100000   0.018928   1.257737
2    1000000   0.072048   2.887046
3   10000000   1.466885   5.868101
4  100000000  15.781870  39.944570

Using RMM pool allocator

__getitem__ (ms)
sizes  cupy_times  cudf_times
0      10000    0.020740    0.742941
1     100000    0.022202    0.735149
2    1000000    0.063808    0.773129
3   10000000    1.022408    1.713200
4  100000000   11.208498   12.864494
__setitem__ (ms)
sizes       cupy       cudf
0      10000   0.017421   0.654936
1     100000   0.018935   0.653210
2    1000000   0.072644   0.731168
3   10000000   1.465206   3.005741
4  100000000  15.754831  29.576471

Gather optimizations (https://github.com/rapidsai/cudf/pull/2775)

__getitem__ (ms)
sizes  cupy_times  cudf_times
0      10000    0.020859    0.237937
1     100000    0.021863    0.239685
2    1000000    0.063255    0.288165
3   10000000    1.022384    1.285703
4  100000000   11.207237   11.776507
__setitem__ (ms)
sizes       cupy       cudf
0      10000   0.016825   0.259976
1     100000   0.018759   0.258987
2    1000000   0.072505   0.366035
3   10000000   1.466815   2.392278
4  100000000  15.771518  23.315468

Adding numba fix (https://github.com/numba/numba/pull/4576)

__getitem__ (ms)
sizes  cupy_times  cudf_times
0      10000    0.020459    0.204051
1     100000    0.022428    0.203996
2    1000000    0.063453    0.252006
3   10000000    1.022005    1.257911
4  100000000   11.207066   11.755228
__setitem__ (ms)
sizes       cupy       cudf
0      10000   0.016525   0.227246
1     100000   0.018756   0.227032
2    1000000   0.072148   0.335391
3   10000000   1.464391   2.357388
4  100000000  15.779140  23.274782
@shwina @jakirkham do you think this issue should be closed now with https://github.com/rapidsai/cudf/pull/2775 in ?
quasiben
on 9 Oct 2019
Good question! Let me retest and report back.
jakirkham
on 9 Oct 2019
Ok I've installed the nightlies published in the last few hours. Also have tried to use RMM here, but I don't know if I'm doing this correctly. Here is what I'm seeing. Am I missing something?
In [1]: from rmm import rmm_config

In [2]: rmm_config.use_pool_allocator = True

In [3]: import numpy as np
   ...: import cupy as cp
   ...: import pandas as pd
   ...: import cudf as cd

In [4]: a = np.arange(100000)
   ...: idxs = np.random.randint(0, len(a), 50000)

In [5]: ca = cp.asarray(a)
   ...: cidxs = cp.asarray(idxs)

In [6]: s = pd.Series(a)

In [7]: cs = cd.Series(ca)

In [8]: %timeit ca[cidxs]
22 µs ± 1.75 µs per loop (mean ± std. dev. of 7 runs, 10000 loops each)

In [9]: %timeit cs.iloc[cidxs]
10.3 ms ± 902 µs per loop (mean ± std. dev. of 7 runs, 1 loop each)
Beware that cupy submits computations that run in the background. You need
something like cupy.cuda.Stream().synchronize() (unchecked)
On Wed, Oct 9, 2019, 4:52 PM jakirkham notifications@github.com wrote:
Ok I've installed the nightlies published in the last few hours. Also have
tried to use RMM here, but I don't know if I'm doing this correctly. Here
is what I'm seeing. Am I missing something?In [1]: from rmm import rmm_config
In [2]: rmm_config.use_pool_allocator = True
In [3]: import numpy as np
...: import cupy as cp
...: import pandas as pd
...: import cudf as cd
In [4]: a = np.arange(100000)
...: idxs = np.random.randint(0, len(a), 50000)
In [5]: ca = cp.asarray(a)
...: cidxs = cp.asarray(idxs)
In [6]: s = pd.Series(a)
In [7]: cs = cd.Series(ca)
In [8]: %timeit ca[cidxs]
22 µs ± 1.75 µs per loop (mean ± std. dev. of 7 runs, 10000 loops each)In [9]: %timeit cs.iloc[cidxs]
10.3 ms ± 902 µs per loop (mean ± std. dev. of 7 runs, 1 loop each)—
You are receiving this because you commented.
Reply to this email directly, view it on GitHub
https://github.com/rapidsai/cudf/issues/1888?email_source=notifications&email_token=AACKZTA2OUNXQOIZOB2FE3TQNZHATA5CNFSM4HRG7SZKYY3PNVWWK3TUL52HS4DFVREXG43VMVBW63LNMVXHJKTDN5WW2ZLOORPWSZGOEAZRBHA#issuecomment-540217500,
or unsubscribe
https://github.com/notifications/unsubscribe-auth/AACKZTHU4YQCVK3NAKHOADTQNZHATANCNFSM4HRG7SZA
.
mrocklin
on 9 Oct 2019
Beware that cupy submits computations that run in the background. You need
something like cupy.cuda.Stream().synchronize() (unchecked)
Sure. Even adding that line the performance difference remains 3 orders of magnitude.
jakirkham
on 10 Oct 2019
Offline @shwina suggested using cd.set_allocator(pool=True). Also added the CuPy synchronize line. Here's what I see with those changes.
In [1]: import numpy as np
   ...: import cupy as cp
   ...: import pandas as pd
   ...: import cudf as cd

In [2]: cd.set_allocator(pool=True)

In [3]: a = np.arange(100000)
   ...: idxs = np.random.randint(0, len(a), 50000)

In [4]: ca = cp.asarray(a)
   ...: cidxs = cp.asarray(idxs)

In [5]: s = pd.Series(a)

In [6]: cs = cd.Series(ca)

In [7]: %timeit ca[cidxs]; cp.cuda.Stream().synchronize()
50.4 µs ± 6.11 µs per loop (mean ± std. dev. of 7 runs, 10000 loops each)

In [8]: %timeit cs.iloc[cidxs]
1.25 ms ± 76 µs per loop (mean ± std. dev. of 7 runs, 1 loop each)
This is more inline with what we expected from these changes. It would still be nice to see if we can improve .iloc further here. Though it's also worth revisiting the grid search benchmark to see where things stand there.
jakirkham
on 10 Oct 2019
Keep in mind that getitem() on a Series is really two getitem()s (one on the Index, and one on the actual data).
Also from the benchmarks I posted above, it looks like 100000 is a small enough size that we don't see performance close enough to CuPy (we did put effort into optimizing for small sizes though). For larger sizes, the timings should be more comparable.
shwina
on 10 Oct 2019
Created a new notebook for benchmarking cuDF performance. Am still finding grid search to be slower when using cuDF. After doing a deep dive with SnakeViz am finding .iloc is dominating the performance. In particular am seeing this section of __getitem__ show up prominently in profiling. So it appears for the grid search use case there is more work to do here.
jakirkham
on 10 Oct 2019
After doing a deep dive with SnakeViz am finding .iloc is dominating the performance.
Interesting. How badly? 80%? Do you think that this would change with larger data sizes?
mrocklin
on 10 Oct 2019
In particular am seeing this section of
__getitem__show up prominently in profiling. So it appears for the grid search use case there is more work to do here.
That is all host to device copies. This is a limitation of giving us numpy arrays as opposed to slices or GPU arrays. I think in previous testing @shwina saw that gather has some non-negligible overhead currently and it gets amortized at ~10MM rows. This should hopefully greatly improve with the cudf::column refactor.
EDIT: There's a numpy optimization that will help, but still not ideal.
kkraus14
on 10 Oct 2019
Oh great. It sounds like that shifts the burden off of cudf and onto scikit-learn. Is that correct @jakirkham ?
mrocklin
on 10 Oct 2019
I don't think that captures the whole performance picture. Please see the simpler benchmark above. Even if we do send objects to the GPU, CuPy is well over an order of magnitude faster than cuDF here.
jakirkham
on 10 Oct 2019
Should add here is a host-to-device benchmark for the case above. Note the combined time (with indexing) is still an order of magnitude faster with CuPy than cuDF.
In [1]: import numpy as np
   ...: import cupy as cp

In [2]: idxs = np.random.randint(0, 100000, 50000)

In [3]: %timeit cp.asarray(idxs)
73.5 µs ± 17.5 µs per loop (mean ± std. dev. of 7 runs, 1 loop each)
I suspect that you're running into cupy async issues there as well.
In [1]: (100000 * 50000) * 8 / 1e9
Out[1]: 40.0
It's unlikely that we're moving 40GB in 70us. My understanding is that host-to-device bandwidth is on the order of a few GB/s
mrocklin
on 10 Oct 2019
If I might summarize maybe what John is pushing for though, does it make sense to convert from cudf to cupy and then hand off those arrays to cuml? I think that we tried this before and ran into striding/orientation issues, but presumably that would be a separate avenue to work on.
mrocklin
on 10 Oct 2019
@mrocklin, I think the calculation is incorrect. idxs has only 50000 elements. 0-100000 is the random int sample range.
quasiben
on 10 Oct 2019
I suspect that you're running into cupy async issues there as well.
I may have missed that when copying somehow. Anyways here's a fresh run. In any event the time shown above is still roughly correct albeit slightly lower.
%timeit cp.asarray(idxs); cp.cuda.Stream().synchronize()
82.5 µs ± 513 ns per loop (mean ± std. dev. of 7 runs, 10000 loops each)
Should add the time does vary some of course, but it doesn't become nearly 2 orders of magnitude slower, which is what we are seeing with .iloc.
Edit: Of course Ashwin has been pushing this in the right direction and made notable improvements. We just may need further improvements from .iloc if that is the path we intend to use.
jakirkham
on 10 Oct 2019
@mrocklin, I think the calculation is incorrect. idxs has only 50000 elements. 0-100000 is the random int sample range.
Ah! my mistake.
mrocklin
on 10 Oct 2019
What about with larger sizes? 50000 seems small?
mrocklin
on 10 Oct 2019
(keep in mind these are indices, not the data itself)
Edit: (this is also a subset of the complete dataset)
jakirkham
on 10 Oct 2019
FWIW I wanted to retest things here after the cuDF refactor. Here is what I'm seeing:
In [1]: import numpy as np
   ...: import cupy as cp
   ...: import pandas as pd
   ...: import cudf as cd
   ...: import rmm

In [2]: rmm.reinitialize(
   ...:     pool_allocator=True,
   ...:     initial_pool_size=int(2**30)
   ...: )
Out[2]: 0

In [3]: a = np.arange(100000)
   ...: idxs = np.random.randint(0, len(a), 50000)
   ...: s = pd.Series(a)

In [4]: ca = cp.asarray(a)
   ...: cidxs = cp.asarray(idxs)
   ...: cs = cd.Series(ca)

In [5]: %timeit ca[cidxs]; cp.cuda.Stream().synchronize()
41.2 µs ± 355 ns per loop (mean ± std. dev. of 7 runs, 10000 loops each)

In [6]: %timeit cs.iloc[cidxs]
1.24 ms ± 8.85 µs per loop (mean ± std. dev. of 7 runs, 1000 loops each)
For clarity, this is using the cuDF 0.12.0 nightly generated from commit ( https://github.com/rapidsai/cudf/commit/26ade6d257698a25a22a8d349e62f3be5d196f56 ) and CuPy 6.6.0.
jakirkham
on 8 Jan 2020
Gathers have been optimized and this is stale, so closing.
kkraus14
on 29 May 2020
Related issues
jrhemstad
·
3Comments
 ericmjl
·
3Comments
kkraus14
·
3Comments
ericmjl
·
3Comments
kkraus14
·
3Comments
 MurrayData
·
3Comments
MurrayData
·
3Comments
 razajafri
·
3Comments
razajafri
·
3Comments
Most helpful comment
@jakirkham and I recently revisited this work in a notebook here:
https://gist.github.com/9b86e189f3e4fe714c7ef8a566707236
We are still seeing timings for CPU/GPU indexing to be roughly the same. We are exploring how to minimize host-to-device transfers. I think it would be great if someone with deeper cudf indexing knowledge could meet with @jakirkham and/or @quasiben and explore if we can squeeze any more performance from iloc.