Crystal: Multiple Faulty Behaviors when using Process inside spawn in MT enabled program
Compiled with preview_mt and release mode.
This is the error I get:
Unhandled exception in spawn: BUG: Fiber was awaken without channel delivery state set (Exception)

  from /usr/share/crystal/src/deque.cr:463:14 in 'my_class'

  from ***/my_class:94:20 in '->'

  from /usr/share/crystal/src/fiber.cr:255:3 in 'run'

  from ???
The main logic in the code is something like
def get_from_channel
  data = @channel.receive
  # do stuff with it
end

10.times do
  spawn do
    loop {get_from_channel}
  end
end
I'm not sure this will be enough to reproduce, and the code is closed source.
 bararchy
All 43 comments
A way to reproduce would probably be extremely helpful
 jhass
on 25 Oct 2019
jhass
on 25 Oct 2019
@jhass Updated my issue
bararchy
on 25 Oct 2019
I'll try and create a reproducible code, but the overall logic is really just using Fibers and Channels like the Crystal gods intended :)
bararchy
on 25 Oct 2019
FWIW the minimal expansion for that to compile doesn't trigger:
class Bug
  @channel = Channel(Int32).new

  def get_from_channel
    data = @channel.receive
    # do stuff with it
  end

  def trigger
    10.times do
      spawn do
        loop {get_from_channel}
      end
    end
  end
end


Bug.new.trigger
sleep
@jhass here is a more full logic
class Executer
  alias DataSender = {data: String, channel: Channel(String)}
  def initialize
    @channel = Channel(DataSender).new
    looper
  end

  def exec(data : String) : String
    response_channel = Channel(String).new
    @channel.send({data: data, channel: response_channel})
    response_channel.receive
  end

  def looper
    10.times do
      spawn do
        loop { request_handler }
      end
    end
  end

  def request_handler
  data = @channel.receive
    data[:channel].send data[:data]
  end
end

executer = Executer.new

1000.times do
  spawn do
    puts executer.exec("hi there!")
  end
end

sleep
This seems to not reproduce also, but it might just be that it happened sometimes
bararchy
on 25 Oct 2019
btw, with
90000.times do
  spawn do
    puts executer.exec("hi there!")
  end
end
This becomes quite crazy, invalid mem errors, heap allocation errors, etc..
bararchy
on 25 Oct 2019
woot, I think it deadlocked
no new lines are written, and the CPU at 100%
bararchy
on 25 Oct 2019
shouldn't the methods exec and request_handler be protected with mutexes?
in this example, multiple fibers using the same shared channel without synchronization, which is a recipe to weird stuff to happen
b.cr
class Executer
  alias DataSender = {data: String, channel: Channel(String)}
  def initialize
    @channel = Channel(DataSender).new
    @producer_mutex = Mutex.new
    @consumer_mutex = Mutex.new
    looper
  end

  def exec(data : String) : String
    response_channel = Channel(String).new
    @producer_mutex.synchronize do
      @channel.send({data: data, channel: response_channel})
    end
    response_channel.receive
  end

  def looper
    10.times do
      spawn do
        loop { request_handler }
      end
    end
  end

  def request_handler
    @consumer_mutex.synchronize do
      data = @channel.receive
      data[:channel].send data[:data]
    end
  end
end

executer = Executer.new

quit = Channel(Nil).new
mutex = Mutex.new

10000.times do
  spawn do
    puts executer.exec("hi there!")

    mutex.synchronize do
      quit.send(nil)
    end
  end
end

10000.times do
  quit.receive
end

puts "DONE"
This works for me with
crystal run -Dpreview_mt b.cr
 lribeiro
on 25 Oct 2019
lribeiro
on 25 Oct 2019
Why should they? This defeats the whole purpose of MT :/
bararchy
on 25 Oct 2019
@lribeiro Isn't the whole point here is that @channel being a MT Safe object? if I Mutex lock the whole send + receive it means at a given time only a single Thread is working.
bararchy
on 25 Oct 2019
As seen in this Example from @waj : https://stackoverflow.com/a/30854065/1526733
bararchy
on 25 Oct 2019
@lribeiro Channel is meant to be the synchronization primitive and thus be MT-safe. Apparently there is a bug.
@bararchy does #8322 help?
 ysbaddaden
on 25 Oct 2019
ysbaddaden
on 25 Oct 2019
@ysbaddaden I've been reading the Channel code to double check, indeed it's already synchronized.
@bararchy I've tried it with 90000 without mutex and it doesn't trigger any errors.
crystal -v
Crystal 0.31.1 (2019-10-02)
LLVM: 8.0.1
Default target: x86_64-apple-macosx
class Executer
  alias DataSender = {data: String, channel: Channel(String)}
  def initialize
    @channel = Channel(DataSender).new
    looper
  end

  def exec(data : String) : String
    response_channel = Channel(String).new
    @channel.send({data: data, channel: response_channel})
    response_channel.receive
  end

  def looper
    10.times do
      spawn do
        loop { request_handler }
      end
    end
  end

  def request_handler
      data = @channel.receive
      data[:channel].send data[:data]
  end
end

executer = Executer.new

quit = Channel(Nil).new

90000.times do
  spawn do
    puts executer.exec("hi there!")

    quit.send(nil)
  end
end

90000.times do
  quit.receive
end

puts "DONE"
@lribeiro It takes some time to happen, try a few times, I'm on Linux btw.
➜  ~ crystal -v
Crystal 0.31.1 (2019-10-21)

LLVM: 9.0.0
Default target: x86_64-pc-linux-gnu
It still is stuck BTW, unless I manually stop it.
bararchy
on 25 Oct 2019
Let it running for 5m and couldn't reproduce it.
Might it be related to LLVM: 9?
crystal -v
Crystal 0.31.1 [0e2e1d067] (2019-09-30)

LLVM: 8.0.0
Default target: x86_64-unknown-linux-gnu
@lribeiro are you running my exact example or the Nil one? maybe the puts and specific data types are to blame?
bararchy
on 25 Oct 2019
I was able to make it fail (in linux inside docker) by using 900000.times and 100.times on looper.
Memory ballooned to 10GB quickly, running it natively on Mac gave a few warnings but still succeeded
Linux
hi there!GC Warning: Out of memory - trying to allocate requested amount (336 bytes)...
hi there!
GC Warning: Header allocation failed: dropping block
hi there!hi there!

GC Warning: Out of memory - trying to allocate requested amount (336 bytes)...
hi there!
GC Warning: Header allocation failed: dropping block
hi there!
GC Warning: Failed to expand heap by 15147008 bytes

GC Warning: Failed to expand heap by 262144 bytes
GC Warning: Out of Memory! Heap size: 43 MiB. Returning NULL!
hi there!
Invalid memory access (signal 11) at address 0x0
Mac OS
GC Warning: Repeated allocation of very large block (appr. size 266240):
    May lead to memory leak and poor performance
GC Warning: Repeated allocation of very large block (appr. size 1052672):
    May lead to memory leak and poor performance
GC Warning: Repeated allocation of very large block (appr. size 2101248):
    May lead to memory leak and poor performance
GC Warning: Repeated allocation of very large block (appr. size 1052672):
    May lead to memory leak and poor performance
GC Warning: Repeated allocation of very large block (appr. size 4198400):
    May lead to memory leak and poor performance
...
hi there!
hi there!
DONE
@lribeiro are you running my exact example or the Nil one? maybe the puts and specific data types are to blame?
Running the one with a quit channel to avoid waiting forever
lribeiro
on 25 Oct 2019
@ysbaddaden I'm trying to test with it, but it gives me some issues (git stuff, and compiler build, not original issue related).
Can anyone try that out? @lribeiro maybe?
bararchy
on 26 Oct 2019
@bararchy which Linux distro are you using and how you installed crystal?
 bcardiff
on 26 Oct 2019
bcardiff
on 26 Oct 2019
@bcardiff I'm using Arch and installed via pacman
bararchy
on 26 Oct 2019
@bararchy Does this only happen on release mode? Optimization may cause the problem, i.e compiler reordering. Adding asm("" ::: "memory" : "volatile") before fiber.enqueue might help.
 firejox
on 28 Oct 2019
firejox
on 28 Oct 2019
I've also been seeing runaway cpu in production (Ubuntu 18.04 LTS via apt) several times a day when using -Dpreview_mt and Channels. I wrote a watchdog script to kill runaway processes to preserve the last bit of my sanity.
But now, after reading the previous comment from @firejox I rebuilt without --release and deployed that to production. Tiny bit slower, but... so far so good, fingers crossed... if this works, I will hold off on trying to wrap all my Channel calls with Mutexes... 🤣
On a related note, I've always wished that --release could be not just a single flag, but more like -O2, -O3, etc. offering different levels of optimization. I figure it would make this kind of troubleshooting a little bit easier.
EDIT: Sorry, just didn't wait quite long enough. I do still get runaway processes even without --release. 😢
EDIT 2: Some new information. Some of the code paths that trigger the runaway cpu for me do not involve Channels at all, but they do have Process.runs. In this case, when the runaway cpu issue is happening, I notice an extra process appearing under the same name as the executable, but it is single-threaded and does not respond to SIGTERM, only SIGKILL, so I am guessing it is the child process started by Process.run. This loop seems to work for a while with many successful Process.runs before suddenly halting and going to 100% cpu (split between the original process and the extra process). I can see from log output that other fibers continue to execute (but slowly because the cpu is pegged). And again, I cannot reproduce this in a dev environment for some reason (same OS as production, but in a Docker container on a Linux host, the same Docker container I use to build the production executable).
EDIT 3: Last bit of info for today. The runaway processes actually do seem to complete if I wait long enough, but the runtime of each successive process (all of which should be very similar) appears to be increasing exponentially, which is why it never completes all 150 of them. The memory usage of the main Crystal process increases as well until I run out of memory. I straced one of the external processes and it looks like this, over and over:
write(4, "\200\216\320\246\371\177\0\0", 8) = 8
write(4, "\200\216\320\246\371\177\0\0", 8) = 8
write(4, "\200\216\320\246\371\177\0\0", 8) = 8
write(4, "\200\216\320\246\371\177\0\0", 8) = 8
write(4, "\200\216\320\246\371\177\0\0", 8) = 8
The main Crystal process strace looks like this:
read(189, 0x7faa81225000, 8192)         = -1 EAGAIN (Resource temporarily unavailable)
read(189, 0x7faa81225000, 8192)         = -1 EAGAIN (Resource temporarily unavailable)
read(189, 0x7faa81225000, 8192)         = -1 EAGAIN (Resource temporarily unavailable)
read(189, 0x7faa81225000, 8192)         = -1 EAGAIN (Resource temporarily unavailable)
read(189, 0x7faa81225000, 8192)         = -1 EAGAIN (Resource temporarily unavailable)
read(189, 0x7faa81225000, 8192)         = -1 EAGAIN (Resource temporarily unavailable)
At first, I notice a few of those EAGAINs, but as it starts to slow down, I see more and more until it is just a wall of those and strace and sshd become the top cpu users.
 anamba
on 31 Oct 2019
anamba
on 31 Oct 2019
@anamba Maybe your external processes are stuck in a loop somehow spitting out output? To the OP, what's the backtrace when it starts using 100% cpu? I assume it works fine without -Dpreview_mt ? I am able to get it to run out of RAM easily enough but don't get the error message you mention. Does it fail with crystal git master?
 rdp
on 5 Nov 2019
rdp
on 5 Nov 2019
@anamba you're amazing! your tip regarding processes lead me to check the relevant part, so, we have the same issue of runaway processes or at least issues in Processes in MT env.
The code in my loop which I removed
def request_handler
      data = @channel.receive
      # Do something with data in a new Process.new and
      # while ps.exists?
      # wait and respond with data
      data[:channel].send data[:data]
  end
As I thought it wasn't relevant, but I guess we are converging on the real target issue.
bararchy
on 5 Nov 2019
@anamba are you using IO::Memory to communicate with your Process? (get data, send data)
bararchy
on 5 Nov 2019
Win! reproducible!
--release -Dpreview_mt
task_channel = Channel(NamedTuple(
string: String,
channel: Channel(String))).new
2.times do
spawn do
loop do
data = task_channel.receive
string = data[:string]
error = IO::Memory.new
output = IO::Memory.new
ps = Process.new("echo", [string], output: output, error: error)
while ps.exists?
sleep 1
puts "Waiting for echo to finish"
end
data[:channel].send output.to_s
end
end
end
wait = Atomic(Int32).new(0)
100.times do |i|
spawn do
puts "sending: #{i}"
my_channel = Channel(String).new
task_channel.send({
string: "echooooooooo",
channel: my_channel,
})
my_channel.receive
puts "got data for: #{i}"
wait.add(1)
end
end
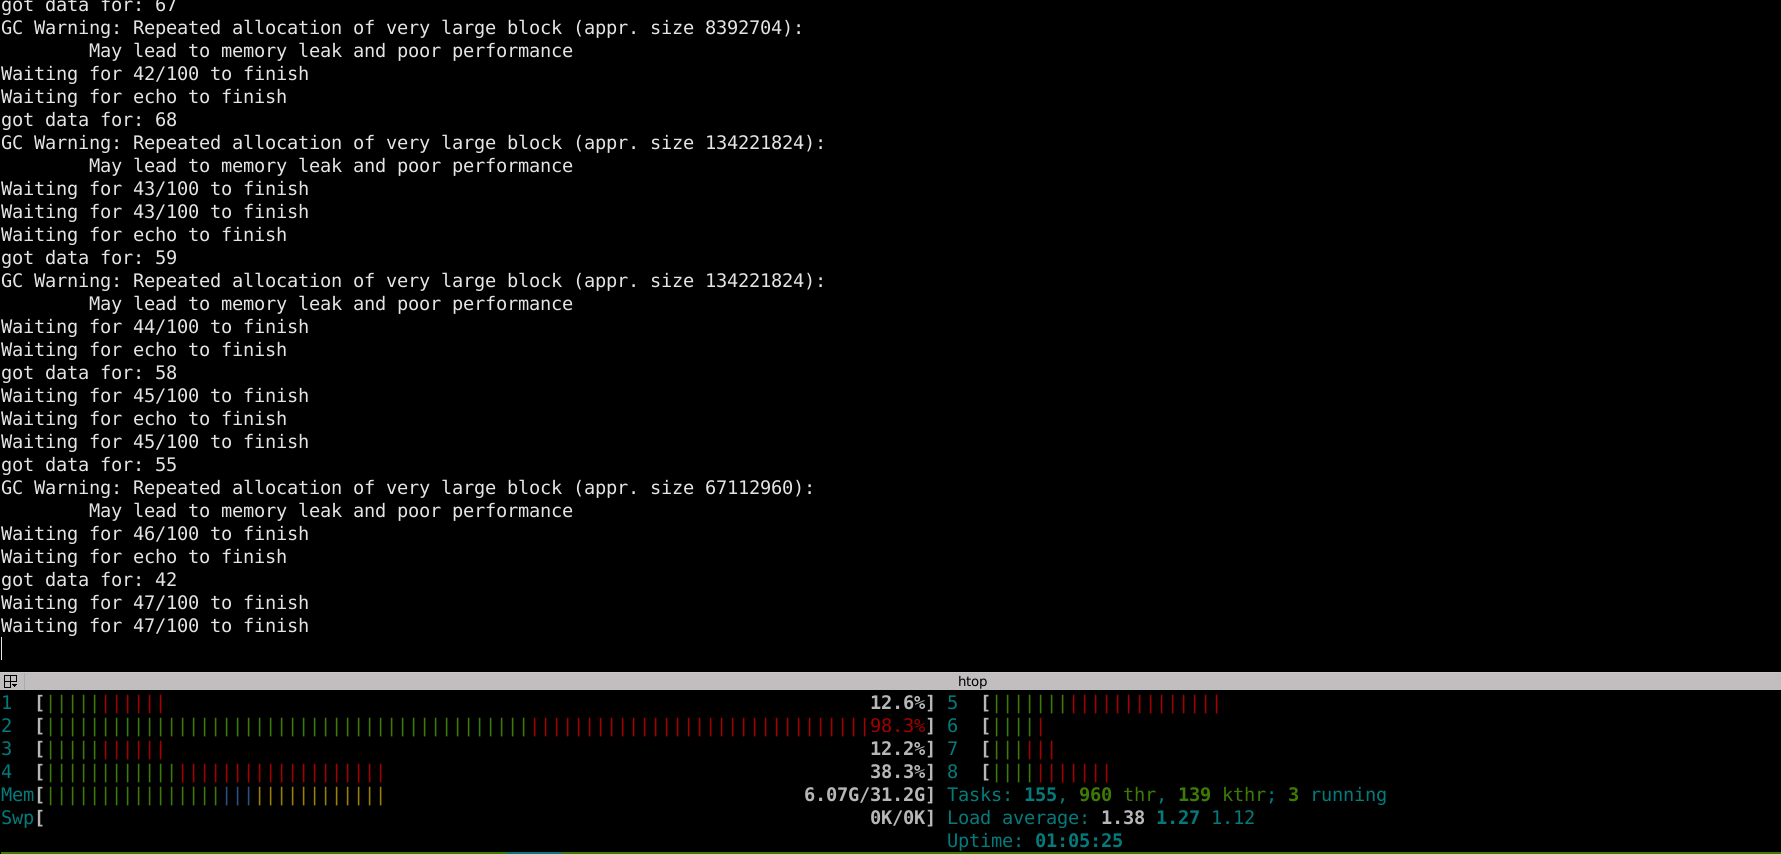
while wait.get < 100
puts "Waiting for #{wait.get}/100 to finish"
sleep 1
end
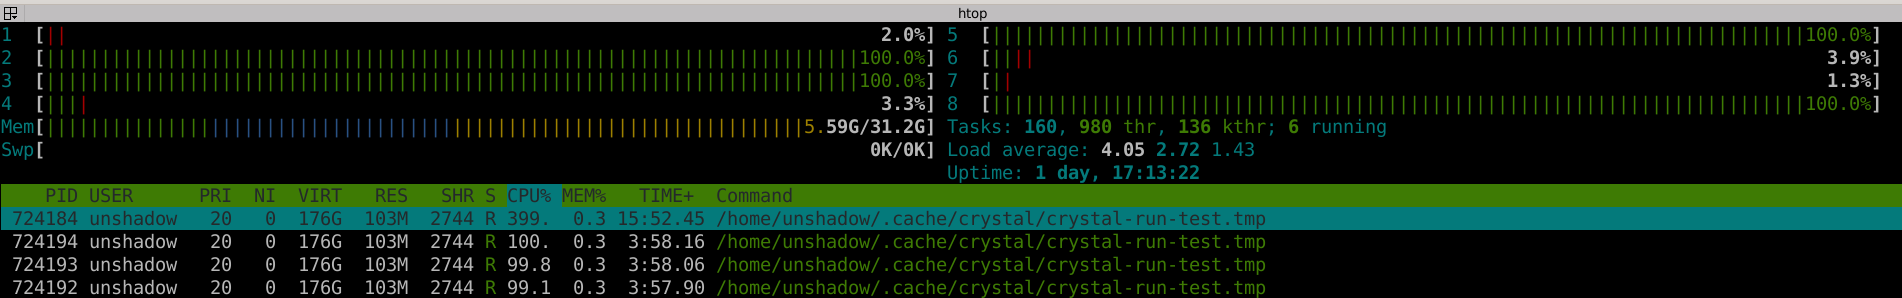
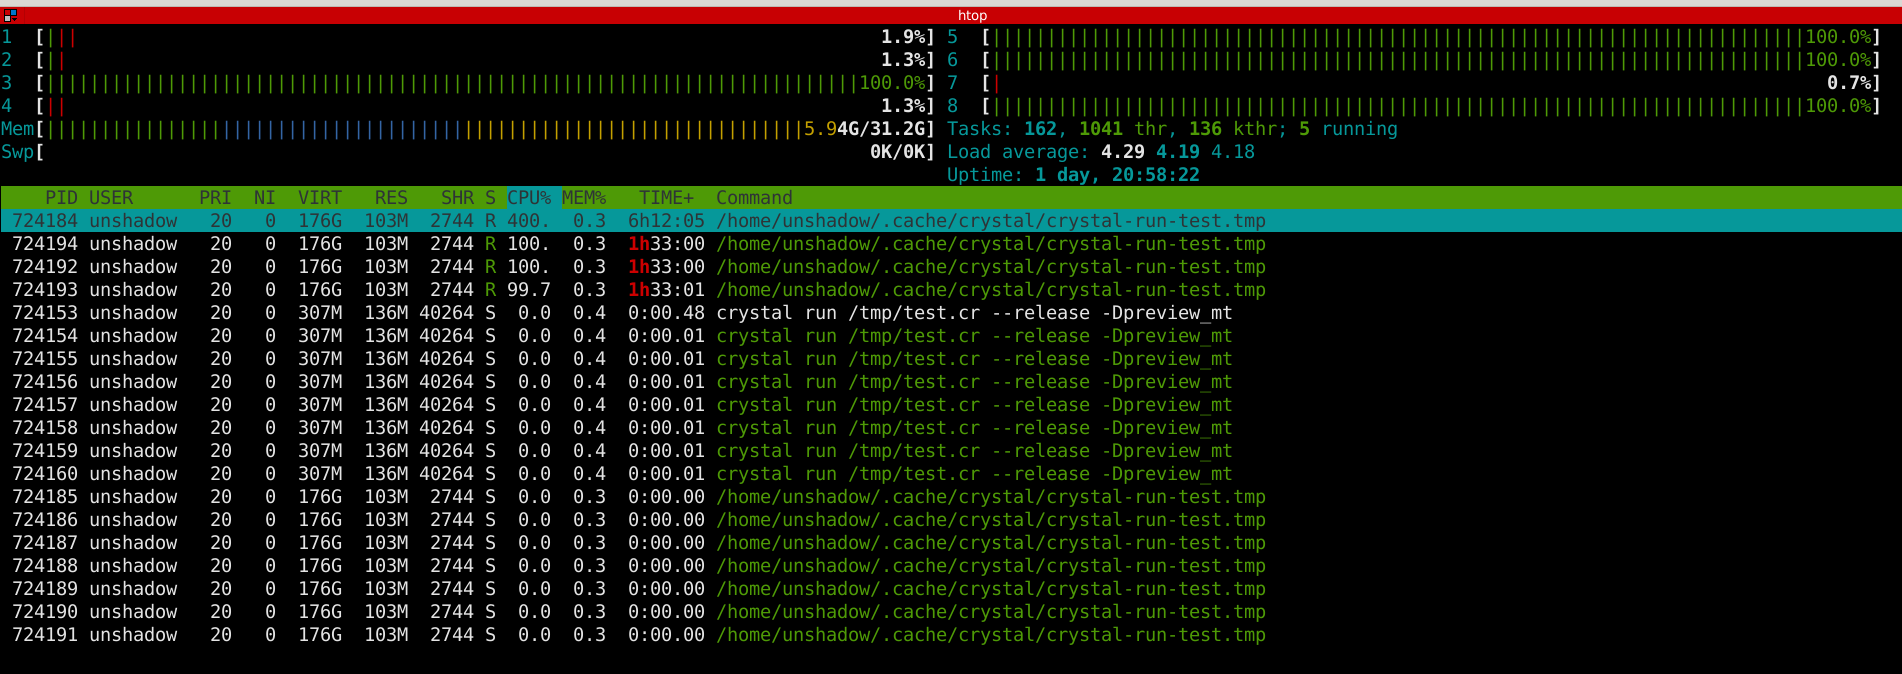
The above example won't reach above 31-32 for me, it gets to 100% CPU and hangs
bararchy
on 5 Nov 2019
How this looks like running
bararchy
on 5 Nov 2019
A bit reduced, but this:
chan = Channel(Nil).new

spawn do
  Process.run("echo", ["hello"])
  chan.send(nil)
end

chan.receive
with -Dpreview_mt shows me:
[warn] kevent: triggering EVFILT_USER event: Bad file descriptor
which might means there's a bug in Process inside spawn.
But one thing to notice about CPU consumption: doing while wait.get < 100 will hog the CPU. The same is true for while ps.exists?. Although it shouldn't crash, they are not a good coding practice. Instead of while ps.exists? maybe do ps.wait? Instead of atomic use a "wait group" (just a channel, send nil 100 times, expect 100 receive on the other side).
 asterite
on 5 Nov 2019
asterite
on 5 Nov 2019
Wait, but while .. Is in a block, with the sleep 1, why would it hog the CPU?
bararchy
on 5 Nov 2019
Yeah, sorry, I missed the sleep 1. Still, there exist alternative patterns for while + sleep.
I tried replacing Process.run with sleep and it works fine and doesn't hog the CPU. It's a problem with Process inside spawn, I'm almost sure. So the bug is legit :+1:
asterite
on 5 Nov 2019
BTW just noting in case its not clear, the issue is Process inside a spwn with preview_mt flag enabled
bararchy
on 5 Nov 2019
Indeed. Maybe it's related to the fact that Process uses fork, and fork doesn't work well with multiple threads and something is coded wrongly around that
asterite
on 6 Nov 2019
OK I was able to repro using https://github.com/crystal-lang/crystal/issues/8375#issuecomment-549991578 (failure traces followed by 100% cpu usage):
Sometimes I get
Unhandled exception in spawn: BUG: Fiber was awaken without channel delivery state set (Exception)
  from dev/crystal/src/gc/boehm.cr:110:5 in '->'
  from dev/crystal/src/fiber.cr:255:3 in 'run'
  from ???
...
GC Warning: Repeated allocation of very large block (appr. size 268439552):
    May lead to memory leak and poor performance
Sometimes
FATAL: tried to resume a dead fiber: #<Fiber:0x7f937c102f80>
  from dev/crystal/src/crystal/system/unix/pthread.cr:116:5 in 'resume'
  from dev/crystal/src/crystal/scheduler.cr:95:9 in 'run_loop'
  from dev/crystal/src/crystal/scheduler.cr:174:3 in '->'
  from dev/crystal/src/crystal/system/unix/pthread.cr:255:3 in '->'
  from GC_inner_start_routine
  from GC_call_with_stack_base
  from ???
  from clone
  from ???
and a few more like the first:
Unhandled exception in spawn: BUG: Fiber was awaken without channel delivery state set (Exception)
  from dev/crystal/src/deque.cr:463:14 in '->'
  from dev/crystal/src/fiber.cr:255:3 in 'run'
  from ???
and
Unhandled exception in spawn: BUG: Fiber was awaken without channel delivery state set (Exception)
  from /usr/share/crystal/src/channel.cr:181:11 in 'receive'
  from bad9.cr:31:5 in '->'
  from /usr/share/crystal/src/fiber.cr:255:3 in 'run'
  from /usr/share/crystal/src/fiber.cr:48:34 in '->'
  from ???
and occasionally a failure from "fork: out of memory" (sometimes it creates several fork processes that seem to eat up all RAM in system). Ubuntu 19.04
rdp
on 6 Nov 2019
@rdp nice! this is the exact set of issues I had :)
bararchy
on 6 Nov 2019
@asterite \ @bcardiff any idea on the status of this issue? it hurts us kinda bad right now. the performance downgrade from using non MT builds are quite large.
bararchy
on 7 Nov 2019
@bararchy I'm not working on any of this, I don't know about others. But MT is experimental, could you use things in a non-MT way for now?
asterite
on 7 Nov 2019
I can, as I'm doing currently :) but I would really really love to have MT working XD and this seems to be the only blocker after 2 months of hard testing
bararchy
on 7 Nov 2019
Keep MT feedback coming. Please! :-)
It's great how everyone contributed with more feedback.
Our attention is in MT. I've been iterating in other aspects of MT during the last couple of weeks. This issue is in the queue.
bcardiff
on 7 Nov 2019
@bararchy could you please verify if https://github.com/crystal-lang/crystal/pull/8465 fixes the issue in your original code? I just tried with the code from your comment and apparently it does.
 waj
on 12 Nov 2019
waj
on 12 Nov 2019
@waj seems it does, thanks!
bararchy
on 13 Nov 2019
To (further?) close the loop: Since it feels like 0.32.0 is imminent, I built crystal master today and use it to deploy to production, and it appears my issue is resolved as well. 🎉
This resolution has revealed other issues, but I'm still in the process of determining whether they are in my code (almost certainly).
anamba
on 16 Nov 2019
Related issues
 grosser
·
3Comments
grosser
·
3Comments
 TechMagister
·
3Comments
TechMagister
·
3Comments
 oprypin
·
3Comments
oprypin
·
3Comments
 ArthurZ
·
3Comments
ArthurZ
·
3Comments
 will
·
3Comments
will
·
3Comments
Most helpful comment
Keep MT feedback coming. Please! :-)
It's great how everyone contributed with more feedback.
Our attention is in MT. I've been iterating in other aspects of MT during the last couple of weeks. This issue is in the queue.