Crud: [4.1][Feature] New widget: chart
We should make it easier to add charts to the Dashboard / CRUDs. Especially since Backstrap already provides beautiful charts using Chart.JS
The syntax should be pretty similar to the ChartJS syntax: https://www.chartjs.org/docs/latest/charts/line.html
Food for thought: should the chart load its data with AJAX? That would make for faster page loads. But it would require the developer to create a route and controller for that chart, which is... less than ideal.
 tabacitu
All 8 comments
I made a lot of dashboards with charts. Charts should load via ajax.
You can compromise and make this optional.
 danbka33
on 15 Jan 2020
danbka33
on 15 Jan 2020
I'm working for this
 vonsogt
on 24 Jan 2020
vonsogt
on 24 Jan 2020
That's great @vonsogt . Let me know if you end up with something re-usable, and you can share your code. I guess the difficult part of creating this would be:
- to have the data loaded with AJAX, but still make it ridiculously easy for developers to create a new chart (by default they'd need to create both a route and a controller);
- to create a syntax that's easy to use, but also comprehensive, for passing down the dataset from PHP to JS;
I was looking at Laravel Charts - seems like the best library that does this in the Laravel ecosystem. Did you stumble upon anything better in your research?
Not sure we _can_ or _should_ do things with this library. But it did look easy to use, and it _does_ support ChartJS already :smile:
Let me know if you want my opinion on anything, I wanted to work on this but unfortunately it hasn't been a priority so far.
tabacitu
on 26 Jan 2020
The plan that I want to implement is like this:
- First I want to use this dependency
[ "@coreui/coreui-plugin-chartjs-custom-tooltips": "^1.3.1", "chart.js": "^2.9.3" ] - Then copy all needed resources using webpack.mix.js
- then decleare at config/backpack/base.php
- make a new _widgets_ blade that containt div class for widgets and add ChartJS script inside too
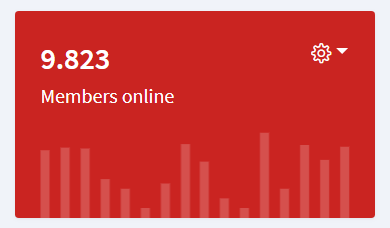
Example of new widgets (card_chart_bar.blade.php):
<div class="col-sm-6 col-lg-3">
    <div class="card text-white bg-danger">
        <div class="card-body pb-0">
            <div class="btn-group float-right">
                <button class="btn btn-transparent dropdown-toggle p-0" type="button" data-toggle="dropdown" aria-haspopup="true" aria-expanded="false">
                    <i class="nav-icon fa fa-cog"></i>
                </button>
                <div class="dropdown-menu dropdown-menu-right"><a class="dropdown-item" href="#">Action</a><a class="dropdown-item" href="#">Another action</a><a class="dropdown-item" href="#">Something else here</a></div>
            </div>
            <div class="text-value">9.823</div>
            <div>Members online</div>
        </div>
        <div class="c-chart-wrapper mt-3 mx-3" style="height:70px;">
            <canvas class="chart" id="card-chart1" height="70"></canvas>
        </div>
    </div>
</div>

@section('javascript')
<script>
    Chart.defaults.global.pointHitDetectionRadius = 1
    Chart.defaults.global.tooltips.enabled = false
    Chart.defaults.global.tooltips.mode = 'index'
    Chart.defaults.global.tooltips.position = 'nearest'
    Chart.defaults.global.tooltips.custom = coreui.ChartJS.CustomTooltips
    Chart.defaults.global.defaultFontColor = '#646470'

    const cardChart1 = new Chart(document.getElementById('card-chart1'), {
        type: 'line',
        data: {
            labels: ['January', 'February', 'March', 'April', 'May', 'June', 'July'],
            datasets: [{
                label: 'My First dataset',
                backgroundColor: 'transparent',
                borderColor: 'rgba(255,255,255,.55)',
                pointBackgroundColor: getStyle('--primary'),
                data: [65, 59, 84, 84, 51, 55, 40]
            }]
        },
        options: {
            maintainAspectRatio: false,
            legend: {
                display: false
            },
            scales: {
                xAxes: [{
                    gridLines: {
                        color: 'transparent',
                        zeroLineColor: 'transparent'
                    },
                    ticks: {
                        fontSize: 2,
                        fontColor: 'transparent'
                    }
                }],
                yAxes: [{
                    display: false,
                    ticks: {
                        display: false,
                        min: 35,
                        max: 89
                    }
                }]
            },
            elements: {
                line: {
                    borderWidth: 1
                },
                point: {
                    radius: 4,
                    hitRadius: 10,
                    hoverRadius: 4
                }
            }
        }
    })
</script>
@endsection
TODO:
- Make the ChartJS script easy to use for dynamic queries
vonsogt
on 27 Jan 2020
Looking most forward to the pie chart
 ziming
on 5 Feb 2020
ziming
on 5 Feb 2020
Good news! Just pushed a PR for this here https://github.com/Laravel-Backpack/CRUD/pull/2593
Looks like we're going to have it before we launch 4.1
tabacitu
on 23 Mar 2020
Aaand a better implementation here: https://github.com/Laravel-Backpack/CRUD/pull/2596
tabacitu
on 24 Mar 2020
Let's close this issue, and continue the conversation inside #2596 .
@vonsogt I like what you did there. I would like to be able to create that kind of widgets too. I agree there are use cases where that is maybe more informative than a big fat bar/line chart. Maybe after the chart widget is launched (4.1), we can clone it make a new chart widget that looks like that. Since it seems to use ChartJS too, it should be possible.
tabacitu
on 24 Mar 2020
Related issues
 packytagliaferro
·
3Comments
packytagliaferro
·
3Comments
 mklahorst
·
3Comments
mklahorst
·
3Comments
 jorgepires
·
3Comments
jorgepires
·
3Comments
 trip-somers
·
3Comments
trip-somers
·
3Comments
 voidstate
·
3Comments
voidstate
·
3Comments
Most helpful comment
I made a lot of dashboards with charts. Charts should load via ajax.
You can compromise and make this optional.