Core: Permanent error: Client exceeded max pending messages [2]: 512
Home Assistant release with the issue:
HA 0.93
Last working Home Assistant release (if known):
HA 0.91 (0.92.0?)
Operating environment (Hass.io/Docker/Windows/etc.):
Home Assistant, Raspberry
Lovelace interface on desktop Opera browser.
Component/platform:
homeassistant.components.websocket_api.http.connection
Description of problem:
Tons of errors in error log with no any clear reason. I have more than 15.000 such errors a day.
Problem-relevant configuration.yaml entries and (fill out even if it seems unimportant):
Traceback (if applicable):
ERROR (MainThread) [homeassistant.components.websocket_api.http.connection.xxxx] Client exceeded max pending messages [2]: 512
Additional information:
Didn't have this issue in 0.91 and most probable (I don't remember exactly) in 0.92.0 and did have it in 0.92.2.
 Spirituss
All 44 comments
Something blocked your browser to consume the websocket message. Turn on the debug log of webscoket_api component you will be able to see what was happening
logger:
  default: info
  logs:
    homeassistant.components.websocket_api: debug
 awarecan
on 17 May 2019
awarecan
on 17 May 2019
Hey there @home-assistant/core, mind taking a look at this issue as its been labeled with a integration (websocket_api) you are listed as a codeowner for? Thanks!
_This is a automatic comment generated by codeowners-mention to help ensure issues and pull requests are seen by the right people._
 ghost
on 18 May 2019
ghost
on 18 May 2019
Something blocked your browser to consume the websocket message. Turn on the debug log of webscoket_api component you will be able to see what was happening
logger:
  default: info
  logs:
    homeassistant.components.websocket_api: debug
I switched on debug and see a tons of messages from sensors with events. It seems that HA can't process so many messages. Log has about 15-30 messages per second.
There is an message example:
2019-05-18 16:16:04 DEBUG (MainThread) [homeassistant.components.websocket_api.http.connection.1659958224] Sending {'id': 3, 'type': 'event', 'event': <Event state_changed[L]: entity_id=sensor.energy_apparentpower_kettle_kitchen, new_state=<state sensor.energy_apparentpower_kettle_kitchen=77; unit_of_measurement= , friendly_name=kettle_kitchen ENERGY ApparentPower @ 2019-05-18T16:16:04.319552+03:00>, old_state=<state sensor.energy_apparentpower_kettle_kitchen=76; unit_of_measurement= , friendly_name=kettle_kitchen ENERGY ApparentPower @ 2019-05-18T16:15:59.983525+03:00>>}
2019-05-18 16:16:04 DEBUG (MainThread) [homeassistant.components.websocket_api.http.connection.1659958224] Sending {'id': 2, 'type': 'event', 'event': {'event_type': 'state_changed', 'data': {'entity_id': 'sensor.energy_reactivepower_kettle_kitchen', 'new_state': <state sensor.energy_reactivepower_kettle_kitchen=76; unit_of_measurement= , friendly_name=kettle_kitchen ENERGY ReactivePower @ 2019-05-18T16:16:04.334481+03:00>, 'old_state': <state sensor.energy_reactivepower_kettle_kitchen=74; unit_of_measurement= , friendly_name=kettle_kitchen ENERGY ReactivePower @ 2019-05-18T16:16:00.002101+03:00>}, 'context': {'id': 'xxx', 'parent_id': None, 'user_id': None}, 'time_fired': datetime.datetime(2019, 5, 18, 13, 16, 4, 334646, tzinfo=<UTC>), 'origin': 'LOCAL'}}
2019-05-18 16:16:05 ERROR (MainThread) [homeassistant.components.websocket_api.http.connection.1638344112] Client exceeded max pending messages [2]: 512
2019-05-18 16:16:05 INFO (MainThread) [homeassistant.components.websocket_api.http.connection.1638344112] Connection closed by client
2019-05-18 16:16:05 DEBUG (MainThread) [homeassistant.components.websocket_api.http.connection.1638344112] Disconnected
In your log, first two row (1659958224) are different connection as the last three row (1638344112).
Can you check what blocked the connection 1638344112?
awarecan
on 18 May 2019
Here are the previous messages for the connection 1638344112:
...
2019-05-18 16:10:58 DEBUG (MainThread) [homeassistant.components.websocket_api.http.connection.1638344112] Sending {'id': 2, 'type': 'event', 'event': <Event state_changed[L]: entity_id=counter.warning_counter, new_state=<state counter.warning_counter=8609; initial=0, step=1, friendly_name=Warnings, icon=mdi:hazard-lights @ 2019-05-18T16:10:58.130441+03:00>, old_state=<state counter.warning_counter=8608; initial=0, step=1, friendly_name=Warnings, icon=mdi:hazard-lights @ 2019-05-18T16:08:54.678641+03:00>>}
ing {'id': 2, 'type': 'event', 'event': <Event state_changed[L]: entity_id=counter.warning_counter, new_state=<state counter.warning_counter=8609; initial=0, step=1, friendly_name=Warnings, icon=mdi:hazard-lights @ 2019-05-18T16:10:58.130441+03:00>, old_state=<state counter.warning_counter=8608; initial=0, step=1, friendly_name=Warnings, icon=mdi:hazard-lights @ 2019-05-18T16:08:54.678641+03:00>>}
2019-05-18 16:10:58 DEBUG (MainThread) [homeassistant.components.websocket_api.http.connection.1638344112] Sending {'id': 2, 'type': 'event', 'event': <Event state_changed[L]: entity_id=automation.ha_warning_counter, new_state=<state automation.ha_warning_counter=on, last_triggered=2019-05-18T16:10:58.209950+03:00 @ 2019-05-18T16:03:37.354451+03:00>, old_state=<state automation.ha_warning_counter=on, last_triggered=2019-05-18T16:08:54.840850+03:00 @ 2019-05-18T16:03:37.354451+03:00>>}
2019-05-18 16:11:01 DEBUG (MainThread) [homeassistant.components.websocket_api.http.connection.1638344112] Sending {'id': 2, 'type': 'event', 'event': <Event state_changed[L]: entity_id=sensor.time, new_state=<state sensor.time=16:11; icon=mdi:clock, friendly_name=Time @ 2019-05-18T16:11:01.016647+03:00>, old_state=<state sensor.time=16:10; icon=mdi:clock, friendly_name=Time @ 2019-05-18T16:10:01.023533+03:00>>}
2019-05-18 16:16:05 ERROR (MainThread) [homeassistant.components.websocket_api.http.connection.1638344112] Client exceeded max pending messages [2]: 512
2019-05-18 16:16:05 INFO (MainThread) [homeassistant.components.websocket_api.http.connection.1638344112] Connection closed by client
2019-05-18 16:16:05 DEBUG (MainThread) [homeassistant.components.websocket_api.http.connection.1638344112] Disconnected
Could you explain how to check what blocked the connection?
I checked the log for other 'problem' connections, for most of them every time I see the message 'Client exceeded max pending messages [2]: 512' with new connection number, it is the first message I see in the log with this connection number and there is no any other type of messages with such connection number.
Spirituss
on 20 May 2019
I feel that is a client issue. What browser or mobile app are you using? Is there any proxy between your client and server?
The Sending xxx log only output when websocket read a message from its internal queue and ready to send to client. It looks like 16:11:01 is the last message had read from the queue, after that all event change message just put into the queue, but never pop out, until all 512 slots fulfilled. It took about 4 minutes (It is a reasonable time I think).
However, 1659958224 socket has been created and seems was processing the message. So I think the 1638344112 might be closed by client or some actor in between, but the close message was not reached the server, so server continue to publish message to that connection's queue.
Is that possible find when the first message 1638344112 sent? How long the connection keeps running? I know some router may brutally kill the socket connection if it kept open for a long time.
awarecan
on 20 May 2019
Just for information in order to track the issue - I keep the log file for this day (I relaunched HA already) so have all the history.
As for HA and hardware landscape: I have no proxy, on iphone I use official HA client, on MacBook I use Opera (VPN switched off), on Unifi the option IPS is activated.
Regarding 1638344112 - the first messages in log:
2019-05-18 16:03:51 DEBUG (MainThread) [homeassistant.components.websocket_api.http.connection.1638344112] Connected
2019-05-18 16:03:51 DEBUG (MainThread) [homeassistant.components.websocket_api.http.connection.1638344112] Sending {'type': 'auth_required', 'ha_version': '0.93.0'}
2019-05-18 16:03:52 DEBUG (MainThread) [homeassistant.components.websocket_api.http.connection.1638344112] Received {'type': 'auth', 'access_token': 'xxx'}
2019-05-18 16:03:52 DEBUG (MainThread) [homeassistant.components.websocket_api.http.connection.1638344112] Received access_token
2019-05-18 16:03:52 DEBUG (MainThread) [homeassistant.components.websocket_api.http.connection.1638344112] Auth OK
2019-05-18 16:03:52 DEBUG (MainThread) [homeassistant.components.websocket_api.http.connection.1638344112] Sending {'type': 'auth_ok', 'ha_version': '0.93.0'}
2019-05-18 16:03:52 DEBUG (MainThread) [homeassistant.components.websocket_api.http.connection.1638344112] Received {'id': 2, 'event_type': 'state_changed', 'type': 'subscribe_events'}
...
I stopped the node-red process and it seems that the error messages above mentioned stop coming. I will see log file a couple of days and will be back with the result.
Spirituss
on 28 May 2019
Which node red HA integration were you using ?
 balloob
on 29 May 2019
balloob
on 29 May 2019
Actually, I don't use any active Node-red and HA integration, just connected ND and HA via long term token. I have clean installation of ND with no any flows.
After I stoped the ND service (sudo systemctl disable nodered.service, node-red-stop), the problem is gone. It seems that token integration is the reason of the issue.
Spirituss
on 30 May 2019
But what Node Red integration of HA did you use? There are different plugins out there.
balloob
on 30 May 2019
Standard integration via:
node-red -> Manage Palette -> Install -> node-red-contrib-home-assistant-websocket -> paste HA long term token
P.S. I use Home Assistant, not HASS.io.
Spirituss
on 31 May 2019
Unfortunatelly, I see again these error messages:
2019-06-01 15:07:06 WARNING (MainThread) [homeassistant.components.websocket_api.http.connection.1633621712] Disconnected: Did not receive auth message within 10 seconds
Spirituss
on 1 Jun 2019
I'm seeing similar with NodeRed (same integration). Only on automation reloads.
 FuzzyMistborn
on 24 Jul 2019
FuzzyMistborn
on 24 Jul 2019
I have this error messages even with switched off NodeRed service.
Spirituss
on 29 Jul 2019
I do have the same problem, and it does look to me like it is trying to work out all the templates for custom icons even if I am not on the specific view causing Lovelace actually to crash (It show only "Reload Lovelace"), this has been working up until last update (I did update both HA to latest version and card-mod).
Before this update, I had everything up2date.
This is what I see in the log (and this is a microscopic extract of the thousands of lines it did generate
2019-08-29 15:01:14 DEBUG (MainThread) [homeassistant.components.websocket_api.http.connection.140552480992000] Received {'type': 'render_template', 'template': ":host {\n  --paper-item-icon-color:\n    {% if is_state(config.entity, 'on') %}\n      rgb(251, 205, 65);\n    {% elif is_state(config.entity, 'off') %}\n      rgb(2550, 0, 0);\n    {% else %}\n      rgb(128, 128, 128);\n    {% endif %}\n}\n", 'variables': {'user': 'Andrea', 'browser': 'fcb78dce-de4cfbf5', 'hash': ' ', 'config': {'entity': 'switch.studio_andrea_lg_monitor_1', 'name': 'LG Monitor #1', 'style': ":host {\n  --paper-item-icon-color:\n    {% if is_state(config.entity, 'on') %}\n      rgb(251, 205, 65);\n    {% elif is_state(config.entity, 'off') %}\n      rgb(2550, 0, 0);\n    {% else %}\n      rgb(128, 128, 128);\n    {% endif %}\n}\n", 'tap_action': {'action': 'none'}}}, 'entity_ids': ['switch.studio_andrea_lg_monitor_1'], 'id': 1530}
2019-08-29 15:01:14 ERROR (MainThread) [homeassistant.components.websocket_api.http.connection.140552480992000] Client exceeded max pending messages [2]: 512
2019-08-29 15:01:14 ERROR (MainThread) [homeassistant.components.websocket_api.http.connection.140552480992000] Client exceeded max pending messages [2]: 512
Please let me know if you might need further informations, I can also share the view which have the custom icon color style in it
Just also to clarify, it is a "Batteries" view, so it show quite a few batteries of my devices around the house and the style code is per-entity, so it is a bit of redundant code which I have noticed that cause a bit of glith (I can see the icon color switch from default-color to custom-color quite a few times without touching anything on the page).
 SeLLeRoNe
on 29 Aug 2019
SeLLeRoNe
on 29 Aug 2019
Hass.io have their own communication bus for Add-ons/NodeRed. That means, Hass.io can work with same NodeRed plugin but the direct communication has issues.
 pvizeli
on 30 Aug 2019
pvizeli
on 30 Aug 2019
Client exceeded max pending messages [2]: 512
9:14 AM components/websocket_api/http.py (ERROR) - message first occured at September 1, 2019, 8:09 PM and shows up **11504** times
(sometimes that number goes up to 500K)
Also having this issue and its causing major problems for me, on latest Hass.io, NodeRed and addons.
I think this is what happens but im not sure everything is related.
I'm using a lot of ESP32 nodes (~50, each with 25 switches and sensors which update every few seconds) with ESPHome and Mosquitto broker,
at some point, something corrupts Mosquitto and I start to get JSON Parse errors
Unable to parse JSON pod_18_lux_sensor: '1_{"unit_of_measurement":"lx","name":"pod 18 lux sensor","state_topic":"pod18/sensor/pod_18_lux_sensor/state","availability_topic":"pod18/status","unique_id":"ESPsensorpod_18_lux_sensor","device":{"identifiers":"a4cf125e7344","name":"pod18","sw_version":"esphome v1.13.6 Aug 20 2019, 14:27:40","model":"Espressif ESP-WROVER-KIT","manufacturer":"espressif"'
1:42 PM components/mqtt/discovery.py (WARNING)

Can't decode payload b'\xc0\x001008' on pod18/sensor/pod_18_bme680_pressure/state with encoding utf-8
then I start getting API Errors from NodeRed randomly and that error messages in the log
Reinstalling Mosquitto gets rid of the JSON parse errors, reinstalling NodeRed does not get rid of this error (perhaps disabling it does but that defeats the point).
The only thing that works is a complete HASS reinstall and manual migration to a new server (restoring a full snapshot restores the errors as well)
accompanied by:
socket.send() raised exception.
and
Error doing job: Exception in callback WebSocketResponse._send_heartbeat()
Traceback (most recent call last):
  File "/usr/local/lib/python3.7/asyncio/events.py", line 88, in _run
    self._context.run(self._callback, *self._args)
  File "/usr/local/lib/python3.7/site-packages/aiohttp/web_ws.py", line 101, in _send_heartbeat
    self._loop.create_task(self._writer.ping())  # type: ignore
AttributeError: 'NoneType' object has no attribute 'ping'
is there any way to clear that api message queue ?
 nirkons
on 2 Sep 2019
nirkons
on 2 Sep 2019
@nirkons maybe you should post this issue on community add-on NodeRed Project
pvizeli
on 2 Sep 2019
@nirkons maybe you should post this issue on community add-on NodeRed Project
I can try but I think this issue at least partially involves HASS itself, since reinstalling Hass does solve the (until it randomly happens again weeks later) issue without changes to NodeRed
nirkons
on 2 Sep 2019
already had this error for the first time. Updated to 0.98.2 two days ago.
Everything works fine.
No Node Red but Nabu Casa integration activated. Mosquitto is activated but not in use so far.
 Pirol62
on 3 Sep 2019
Pirol62
on 3 Sep 2019
I have an update!
My issue was caused by the config-template-card custom card in combination with card-mod.
I was using card-mod to change the icon color, but everything (16 different entities with icon change based on status value) was wrapped into this template card, because no "entities" were selected in the template card, it was refreshing all the inherited cards all the time, causing apparently a huge amount of request which ofc was causing the error described.
After a few investigation with the creator of both cards, we managed to find this and after removing the config-template-card from the lovelace view (which wasn't really needed for my setup), the error disappeared.
I am not really sure at this point that my error root problem is the same as anyone else, but I thought it might be useful for future refences or for other people to clarify what was causing me to have it.
SeLLeRoNe
on 4 Sep 2019
I have an update!
My issue was caused by the config-template-card custom card in combination with card-mod.
I was using card-mod to change the icon color, but everything (16 different entities with icon change based on status value) was wrapped into this template card, because no "entities" were selected in the template card, it was refreshing all the inherited cards all the time, causing apparently a huge amount of request which ofc was causing the error described.After a few investigation with the creator of both cards, we managed to find this and after removing the config-template-card from the lovelace view (which wasn't really needed for my setup), the error disappeared.
I am not really sure at this point that my error root problem is the same as anyone else, but I thought it might be useful for future refences or for other people to clarify what was causing me to have it.
Holy crap that might actually have worked, I removed all lovelace custom cards/files, for now it seems to have gotten rid of the error but I'll update after 24 hours and we'll see.
thanks!
nirkons
on 4 Sep 2019
@thomasloven clarified this to me.
The config-template-card, if no "entity" is specified, re-update everything on every entity update (across HA, not the view).
In my own case, I had that card almost on each view, most of the time without "entity" specified.
That was causing my UI to be kinda slow, Chrome to eat up to 1.2GB of RAM and that error to appear lately in combination with the card-mod update (which I originally thought it was the root cause of my problem).
Technically, specifying the list of entity the config-template-card will be used for in that view, will allow the update to be "pushed" only when one of those entities have a status update.
I really hope I made it clear enough, otherwise maybe Thomas might explain it better than me :D
SeLLeRoNe
on 4 Sep 2019
I've opened an issue for it on config-template-card. I will close this issue now.
If people experience still experience this issue while not using config-template-card, please make sure you can reproduce the issue without running any custom cards or custom components, and if so, please open a new issue.
balloob
on 4 Sep 2019
@balloob Why did you close my issue while I do not use config-template-card ?!
Spirituss
on 4 Sep 2019
This is the issue when issues get flooded with issues with unrelated causes. I still think that it's better to open a new issue. I do however think in your case that it has to do with node-red somehow, but I don't know what.
balloob
on 4 Sep 2019
I already stated that I also do not use node red. So just closing the issue due to unknown causes is not the solution. It’s easier just to prohibit to create an issues at all.
Spirituss
on 4 Sep 2019
Pls as a last argument: I do not use node red and I do not use the config-template-card.
But see this:

These are my plugins:
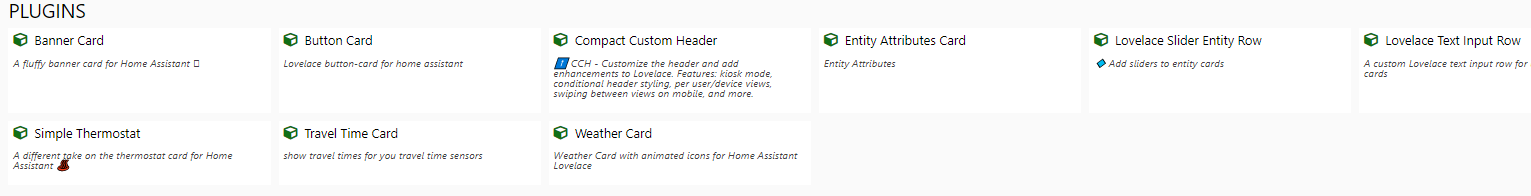
From my point of view, something changed with 0.98.x
All of the plugins worked without any issues before.
Pirol62
on 5 Sep 2019
Oh, after some research I found out, that I posted this issue here:
https://github.com/home-assistant/home-assistant/issues/15608
it seems, that this error is an old one, wich disappeared everywhere between 0.90.2 and now.
Pirol62
on 5 Sep 2019
I have an update!
My issue was caused by the config-template-card custom card in combination with card-mod.
I was using card-mod to change the icon color, but everything (16 different entities with icon change based on status value) was wrapped into this template card, because no "entities" were selected in the template card, it was refreshing all the inherited cards all the time, causing apparently a huge amount of request which ofc was causing the error described.
After a few investigation with the creator of both cards, we managed to find this and after removing the config-template-card from the lovelace view (which wasn't really needed for my setup), the error disappeared.
I am not really sure at this point that my error root problem is the same as anyone else, but I thought it might be useful for future refences or for other people to clarify what was causing me to have it.Holy crap that might actually have worked, I removed all lovelace custom cards/files, for now it seems to have gotten rid of the error but I'll update after 24 hours and we'll see.
thanks!
update: the error is back, it did not fix it.
For me, the error makes node-red unstable, since flows sometimes work but other times give off "API Error" and everything goes to hell :(
please reopen the issue
nirkons
on 5 Sep 2019
I am sorry I caused such confusion.
Didn't mean to.
SeLLeRoNe
on 5 Sep 2019
@Pirol62 I have this issue regardless automations reload!
Spirituss
on 19 Sep 2019
@nirkons I have reopened the issue.
Spirituss
on 19 Sep 2019
@nirkons I have reopened the issue.
thanks, I am still experiencing this issue (at least now its 20K and not 500K like before)
Client exceeded max pending messages [2]: 512
1:30 AM components/websocket_api/http.py (ERROR) - message first occured at September 18, 2019, 11:15 AM and shows up 21183 times
However, out of desperation I am using a workaround in node red, every time I am using a HASS API request, I am also starting a 5-10 second timer, if the API request goes through (moves to the next node) the timer gets sent a STOP payload, if the timer reaches 0 it retries the API request, usually it works on the second try.
There is a chance here theoretically to get stuck in a never ending retry loop (also can be solved with node red logic) but since it works pretty consistently on the 2nd try I'm leaving it like that
nirkons
on 19 Sep 2019
RIP my HA instance.
components/websocket_api/http.py (ERROR) - message first occured at 10:57 AM and shows up 168025 times
 timdonovanuk
on 1 Oct 2019
timdonovanuk
on 1 Oct 2019
HA authors should definitely add any mechanism that could process such kind of interface errors. They force the system to fall down, while there is no any tool to debug the reason of them.
Spirituss
on 1 Oct 2019
I am getting same error
 arnonel
on 31 Oct 2019
arnonel
on 31 Oct 2019
I'm also still receiving the error even after latest version
nirkons
on 31 Oct 2019
Only thing I changed today was enabling nabu casa trial (for casting)
arnonel
on 31 Oct 2019
Created this issue on my own with https://github.com/lukas-hetzenecker/home-assistant-remote
Linking two HA instances to each other, with entity_prefix setup at both HA instances. This created new entities with both prefixes showing in the names of every entity that was shared between instances. A pingpong effect that would clutter up both HA instances in no time, killing one instance would solve issues on the other.
Deleting entity_prefix solved my problem
 RikMuilwijk
on 10 Dec 2019
RikMuilwijk
on 10 Dec 2019
I started getting it today as well. Disabled all my plugins and hacks addons and still getting it. What's the best way to troubleshoot this error?
 skynet01
on 12 Jan 2020
skynet01
on 12 Jan 2020
I started getting it today as well. Disabled all my plugins and hacks addons and still getting it. What's the best way to troubleshoot this error?
I receive 1 time every 2 week, i change HA web port and the problem is fixed... i don't know that's in error... can't find nothing in log...
 tbkon3
on 16 Jan 2020
tbkon3
on 16 Jan 2020
I was able to trace it back to one of my open tabs pointing to HA in the browser. Looks like it was open for a long time and crashed and was hammering HA. It wouldn't be that big of a deal if it was easy to trace where it's coming from
skynet01
on 17 Jan 2020
Related issues
 bdraco
·
3Comments
bdraco
·
3Comments
 arangates
·
3Comments
arangates
·
3Comments
 coolriku
·
3Comments
coolriku
·
3Comments
 missedtheapex
·
3Comments
missedtheapex
·
3Comments
 aweb-01
·
3Comments
aweb-01
·
3Comments
Most helpful comment
HA authors should definitely add any mechanism that could process such kind of interface errors. They force the system to fall down, while there is no any tool to debug the reason of them.