Core: How to debug the source code using Visual Studio 2017?
All 94 comments
@noahfalk can you give guidance here?
 Petermarcu
on 30 Aug 2017
Petermarcu
on 30 Aug 2017
Is it possible to debug the .NET Core and ASP.NET Core source code in my projects?
Yes. These instructions are for windows (since we are talking about Visual Studio which only runs on windows. It is also important that we are talking about V2.0 (or later) .NET Core (e.g. what you get from https://www.microsoft.com/net/core#windowscmd)
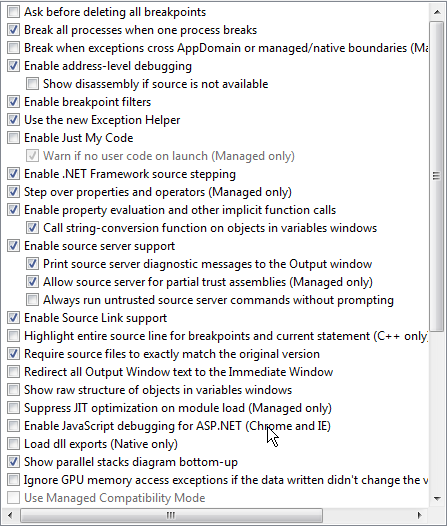
- Uncheck the (Tools -> Options -> Debugging -> Just My Code) checkbox.
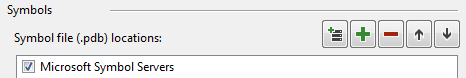
- Insure that the (Tools -> Options -> Debugging -> Symbol Settings -> Microsoft Symbol Servers) checkbox is set
- Insure that the (Tools -> Options -> Debugging -> Enable Source Link support) checkbox is checked
These steps will allow Visual Studio to find the *.PDB files that are needed for the .NET Core and ASP.NET Core libraries. However you need more than just the *.PDB files you also need the source code itself. Going forward we intend for all our libraries to have 'SourceLink' information so that you can fetch the source directly from GitHub. When this is present, VS will simply fetch the source from GitHub and the experience is beautiful. I have tested this on Visual Studio 15.3 (the latest released version).
This 'it just works' experience (when you step into or set breakpoints on framework code VS should simply fetch the correct source code), should work for V2.0 ASP.NET DLLs (that is Microsoft.aspnet.dll). Sadly the CoreFX, and CoreClr dlls (Typically System. dlls), will not be fixed until the V2.01 release (In a few weeks) and thus you need to fetch source code yourself using the instructions below.
Getting source from GitHub
Ultimately you should not need to do this, all our DLLs will have SourceLink information and VS will simply fetch it from GitHub for you. However some of our libraries currently do not have SourceLink information. We will fix this but the experience in that case is VS will ask you where to fetch the file from. You can work around this by fetching the source code from GitHub yourself and pointing VS at it.
- If the source code path contains src\mscorlib it lives in the https://github.com/dotnet/coreclr
- If the source code path contains corefxsrc it lives in https://github.com/dotnet/corefx
- If the source code path has the form .r*src where it is an ASP.NET DLL and it lives in https://github.com/aspnet/* (where * is the name from the source code path).
For example
C:\b\w\f92f3e96777ec37d\.r\Mvc\src\Microsoft.AspNetCore.Mvc\MvcServiceCollectionExtensions.cs
lives in https://github.com/aspnet/Mvc
Once you know the repository, you can fetch the repository and set it to the 2.0.0 version of the source like this.
    git clone https://github.com/dotnet/coreclr
    cd coreclr
    git checkout v2.0.0
At this point you can answer the VS dialog prompting you for the source file path. Once you set it for one source file it will work for any other source file in the same directory structure.
You can also set up where VS searches without having to wait to be prompted by right clicking on the solution -> Properties -> Debug Source Files and then add your directory to the 'Directories Containing Source Code'. Once you set up these paths, VS should simply find your source code.
Finally there is an option in (Tools -> Options -> Debugging -> General -> Require Source Files to match Exactly) which is set by default. If you have problems getting VS to find your source, you can try unselecting that checkbox to see if your version is wrong and the source checksums don't match.
ASP.NET 2.0 SourceLink (VS fetches from GitHub directly) should be working
The V2.0 ASP.NET DLLs (aspnet.dll) have the needed SourceLink information, they should just work. the instructions above for fetching source code for these DLLs. Please comment below if this is not the case.
Note that we did UPDATE the ASP.NET PDBs so they have sourceLink, which means that if you tried to step into ASP.NET dlls before, you may have already cached an old version of the PDBs and if so, Visual Studio will not try to refetch it. You can force the refetch by exiting Visual Studio deleting the %TEMP%\SymbolCache directory and then retrying. In addition once Visual Studio has attempted to fetch a particular source file it will not attempt doing it again. You can clear that history by right clicking on the solution -> Properties -> Debug Source Files and removing all names from the 'Do not look for these source files' textbox.
 vancem
on 31 Aug 2017
vancem
on 31 Aug 2017
@vancem Thank you for your detailed introductions. And I still have some advises.
- It seems people can easily debugging the nuget packages' source code if the authors add the 'SourceLink information'. Is there any documents about the SourceLink?
- Can we directly view the source code by the 'go to the definition' button? Other languages' IDEs(Java, Python, Go) have this feature and I think it will be very useful.
 scheshan
on 31 Aug 2017
scheshan
on 31 Aug 2017
@scheshan - Visual Studio does have a Edit.GotoDefinition (usually bound to the F12 key), which if activiated will find the symbol the cursor is on. However for code that is not part of the project, it takes you to a 'standin' that represents the interface (what can be determined without the source code). This is because it is more the exception than the rule that you want to debug through code that is not your own (that is why 'just my code' is on by default). I don't know of a way off hand of getting to source code for things outside your project except when actively debugging (but others who know more about VS may know of something).
More information on using SourceLink for your own projects is at https://github.com/ctaggart/SourceLink.
vancem
on 31 Aug 2017
@gregg-miskelly may know more about the behavior/limitations of goto definition in VS.
 noahfalk
on 31 Aug 2017
noahfalk
on 31 Aug 2017
Could go-to-definition be made to work with SourceLink?
*For CoreFX/CoreCLR -- this is probably the wrong approach as the dll that your project references isn't what you are going to running against, and I believe Roslyn already has solutions for indexing select open source projects anyway.
*For more normal NuGet packages where the implementation assembly is the same as what you compile against -- seems like an interesting idea to me, but the C# IDE folks would be better to comment on it that I would. @Pilchie @DustinCampbell?
 gregg-miskelly
on 1 Sep 2017
gregg-miskelly
on 1 Sep 2017
To be clear, if the question is "can 'Go To Definition' be made to work with source link today", then the answer is 'no'.
gregg-miskelly
on 1 Sep 2017
/cc @tmat
 davidfowl
on 1 Sep 2017
davidfowl
on 1 Sep 2017
/cc @nguerrera
At some point we had an idea that we could recreate a source project from information stored in the PDB -- it would require the compiler to add a bit more information to the PDB (such as unique ids of referenced assemblies and the compilation options used to build the assembly). But the idea hasn't been implemented yet.
Re reference assemblies vs. implementation assemblies -- I could imagine that if the reference assembly is in a nuget package, we could provide UI (e.g. combo box in the editor) with a selection of target frameworks that the package includes implementation assemblies for and then you could select one and that would navigate to the corresponding source.
UPDATE: The above doesn't take into consideration the current debugging context. If we are attached to a process then we know what the current runtime is and thus should be able to find the corresponding implementation assembly automatically. The IDE is currently not taking the current debugging context into consideration in features like Go To Definition, but it perhaps could.
 tmat
on 1 Sep 2017
tmat
on 1 Sep 2017
Stepping into core source code doesn't work at all for me. I'm trying to figure out why my custom authentication service isn't working properly but I can't step into the ControllerBase.Challenge() method in the following code (which was created by the default project template).
    [HttpPost]
    [AllowAnonymous]
    [ValidateAntiForgeryToken]
    public IActionResult ExternalLogin(string provider, string returnUrl = null)
    {
      // Request a redirect to the external login provider.
      var redirectUrl = Url.Action(nameof(ExternalLoginCallback), "Account", new { returnUrl });
      var properties = this.signInManager.ConfigureExternalAuthenticationProperties(provider, redirectUrl);
      return Challenge(properties, provider);
    }
If I set a breakpoint at return Challenge(properties, provider); it gets hit when I debug, but when I click "step into (F11)" it skips right over it and goes to the } on the next line.
I'm using VS 2017 (15.3.3) with, as far as I can tell, the proper settings.
I deleted my %TEMP%/SymbolCache directory which at least caused visual studio to spend a long time downloading various symbols the next time I tried to debug the project.
The project is a DotNetCore 2.0 project.
 NightWatchman
on 8 Sep 2017
NightWatchman
on 8 Sep 2017
@NightWatchman a few questions:
- Do you have symbols downloaded for whatever dll contains the implementation of 'Challenge'? (check the modules window)
- If so: what happens if you try and step into that function via the disassembly window?
- If not: why is downloading symbols failing? (Check symbols information)
gregg-miskelly
on 9 Sep 2017
I'm going to close this issue now as its been over 30 days without a response. Let us know if you need more assistance.
Petermarcu
on 12 Oct 2017
I have a update on this for the current version of .NET Core (Version 2.0.3).
On Windows, if you install this version of the .NET Framework then the normal Microsoft symbol server http://msdl.microsoft.com/download/symbols can find all the necessary symbolic (PDB) and annotated with SourceLink information to do source stepping in both the .NET Runtime Framework (CoreFX) as well as ASP.NET by fetching the symbolic information from that server and the source code from the appropriate GIT repository.
The upshot of this is that if you debug a .NET Core application using version 2.0.3 of the runtime (e,g. from https://www.microsoft.com/net/download/windows) and do the following
- Uncheck the (Tools -> Options -> Debugging -> Just My Code) checkbox.
- Insure that the (Tools -> Options -> Debugging -> Symbol Settings -> Microsoft Symbol Servers) checkbox is set
- Insure that the (Tools -> Options -> Debugging -> Enable Source Link support) checkbox is checked
Then you should be able to step into (or set breakpoints in) Framework or ASP.NET code and the source code will automatically be brought up.
Note that the framework code is precompiled and optimized by default, which means that stepping and local variable access in framework code may not be nice as you would like (variables may be unavailable)
vancem
on 8 Dec 2017
One other useful note. As mentioned above, by default the code in the Framework is optimized, however you can force it to NOT be. First you have to run the program with the COMPLUS_ZapDisable=1 environment variable set. You can set this variable conveniently by
- Right clicking on the Project (csproj) file in SolutionExplorer -> Properties -> Debug
- Click the 'Add' button in the 'Environment Variables' section of the Debug Pane.
This will cause the code to NOT use the rregenerated (Zapped) code. Next tell Visual Studio to suppress optimization by
- Check the checkbox in Tools -> Options -> Debugging -> General -> Suppress JIT optimization on module Load
Once you do this for your project, you don't need to do it again (until you have another project in which you want to step through framework code.
vancem
on 8 Dec 2017
I have written a blog post that is likely to be more user friendly here
vancem
on 20 Dec 2017
Is there currently a way to set it up so that go to definition brings me to the core source code? It's not really debugging I want this for, it is just to get an idea of what the magic method an article tells me to add actually does for my own understanding as searching on github can be a bit confusing and cumbersome (for me at least).
 GuerrillaCoder
on 12 Jan 2018
GuerrillaCoder
on 12 Jan 2018
@GuerrillaCoder Not currently. It's a feature we are considering to add to VS.
tmat
on 12 Jan 2018
@GuerrillaCoder
Something I have found to be very useful when understanding other people's code is to run a good profiler to allow me to understand it. The basic idea is to collect a DETAILED profile that will show you what your program is doing not to tune is performance but just to browse the execution and goto the source code as you do so. This has the advantage of focusing you in on the important code that actually RUNS in your case.
The PerfView tool is particularly good at doing this because it supports a 'Goto Source' feature that 'just works (if you use Version 2.0.3 of the .NET Core runtime and the V2.0.0 version of PerfView you can run (on windows).
It is pretty slick and works well for the kind of browsing you seem to want to do.
TO do this download the V2.0.0 version of PerfView and run the command
PerfView /DotnetAllocSampled /CpuSampleMSec=.125 collect
Thus turns on sampling (about 5K /sec) on any allocation as well as 8 times a millisecond. This does not slow the program down much but might not give you the level of detail you want (code that does not allocate much or use much CPU will be missed). If you want to catch everything use the /dotnetCalls, but be warned you should only do that in small scenarios because it slows the program down alot.
Once you have your data you can then open up the trace and go to the 'Advanced Group -> Any Stacks' view go to the 'Call Tree' tab (You should also read the tutorial / video on PerfView basics, including symbol resolution and grouping).
But the very cool thing is that once you find a method of interest, for example
system.console!System.Console.WriteLine(System.String)
you can select the node, right click and select 'Goto Source' and PerfView knows enough to fetch the right code from GitHub, download it and show you an annotated version of it.
Very Handy!
vancem
on 13 Jan 2018
@vancem That sounds excellent I will give it a go!
GuerrillaCoder
on 13 Jan 2018
Are there additional steps for debugging an open sourced package that is not a framework package? I am trying to step through the code for the Newtonsoft serializer, and have followed the instructions given in the blog post, but cannot step into the serializer code.
 wiiNinja
on 19 Jan 2018
wiiNinja
on 19 Jan 2018
How third party software (like Newtonsoft), handle symbols is of course up to them.
In the case of Newtonsoft, it would seem that https://github.com/JamesNK/Newtonsoft.Json/issues/881 is relevant.
vancem
on 20 Jan 2018
I stumbled across this post today while writing an alternative solution to the stack overflow link this issue links to. I don't write the solution again here, but can be viewed in the referenced stack overflow post.
 dozer75
on 23 Jan 2018
dozer75
on 23 Jan 2018
@dozer75, In your link you mention that the technique here (definitely the preferred solution) forces you to debug optimized code.
That is not true. As mentioned in this blog post I referenced above there is a straightforward way of disabling optimization of the .NET framework while debugging.
This is certainly not something that you can discover without help, so if you care please vote on this Visual Studio Suggestion
vancem
on 23 Jan 2018
@vancem Interesting, missed that, however the issue remains that not all libraries handles symbols and sourcelink, and as I understand this you can't debug them?
dozer75
on 24 Jan 2018
My Visual Studio installation trys to access a Source Path which doesnt exists on my machine, if I try to jump into framework specific code: E:\A_work\1791\ssrc\mscorlibsrc ... Any Ideas?
 Fruchuxs
on 2 Feb 2018
Fruchuxs
on 2 Feb 2018
Go to Tools->Options->Debugging->Symbols and check to see if that path is there in the "Symbol file (.pdb) locations" list box. I would also blow away the cached symbols there and let it rebuild the next time you debug.
wiiNinja
on 2 Feb 2018
If you get a prompt about a source path than symbols were loaded successfully.
Questions:
- Did you get a prompt asking if you would like to download the source file?
- What version of VS do you have?
- What version of .NET Framework are you trying to debug?
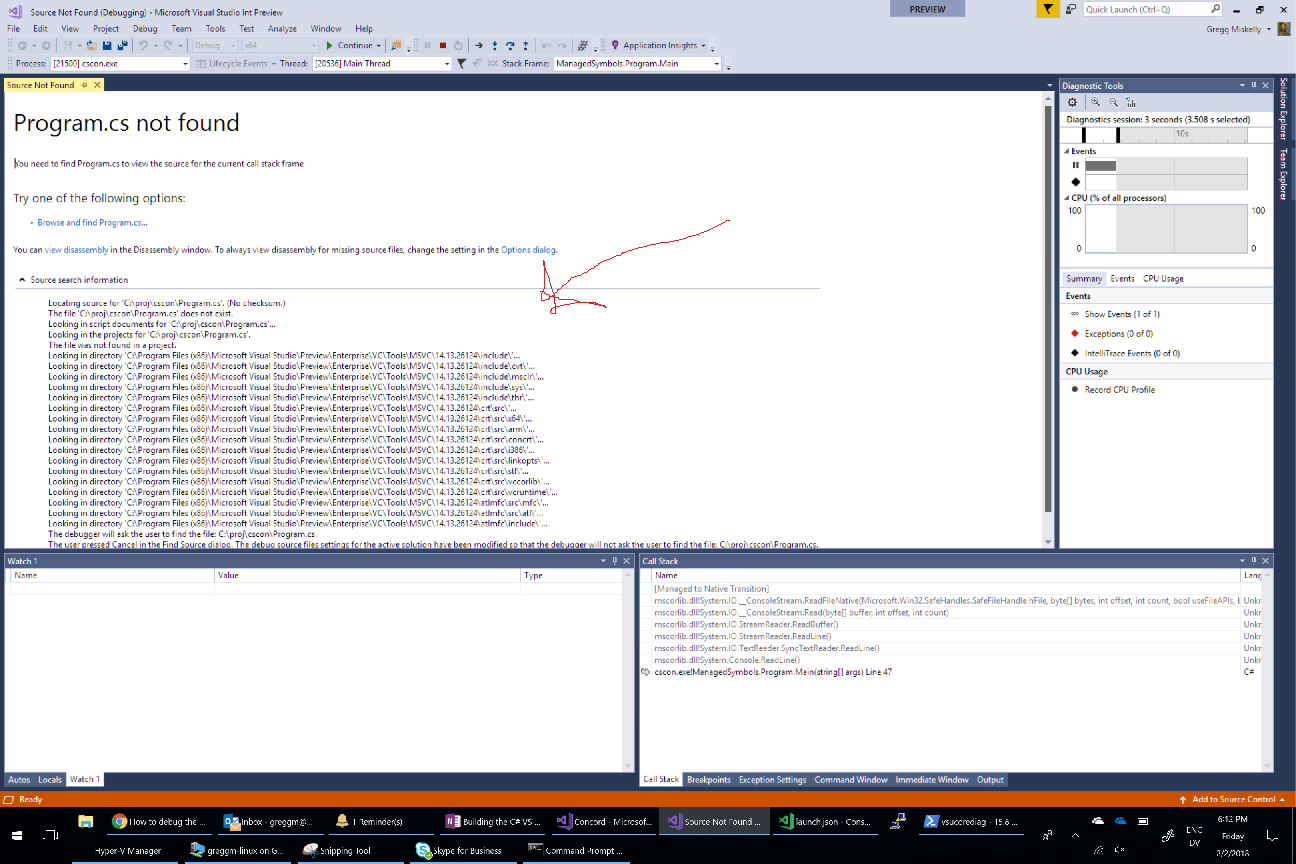
- In the 'No Source' tool window (it looks like a document) there is a log of the places where the debugger looked, can you paste that in?
gregg-miskelly
on 2 Feb 2018
@Fruchuxs - As greg mentions, the fact that it is looking for source code means that you found the symbol file (PDB). You will actually see which particular one if you look at the Debug -> Modules display for that DLL.
The fact that it is looking on your machine (in the original location it was built (on some other machine). means it is trying to find the source. This means for whatever reason it could not find it with SourceLink. This is what Greg is trying to debug with his information.
Now that could be because you are running a version of the runtime that does not have source link information (that is the git URL) in its PDBs, or that you are running a version of Visual Studio that does not support Source Link (you need VS 2017), or something about the configuration is wrong.
Note that you can work around this problem by fetching the source you care about from GIT and pointing VS at it. If you right click on your *.sln file in the solution explorer and select Properties -> Common Properties -> Debug Source Files, you will see all the places that it tries to look, as well as the files it had prompted you for and failed (it will not prompt again).
What I do is clear the set of failed files and then try to step through again. It will prompt you and now you have a file to give it. Once you give in one, it will figure out to look near it for other files so you tend to not have to give it much help (but you can by putting directories in the 'Debug Source Files' dialog.
vancem
on 2 Feb 2018
Thank you all!
I use the last released Version of VS 17 / .net core. He doesn't ask me for downloading the sources. I assume it's a problem with my proxy. Can I configure it?
I deleted the symbols cache by myself, it doesn't work.
I will try the workaround with the sources at Monday.
Fruchuxs
on 3 Feb 2018
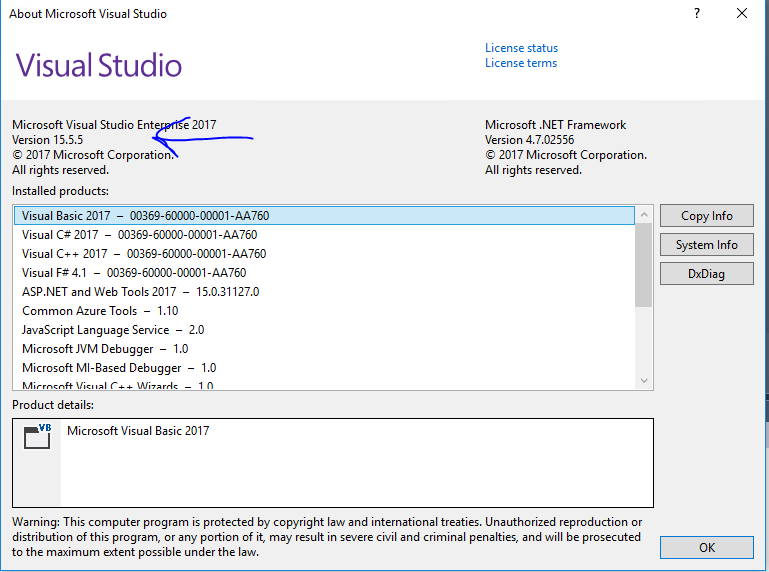
@Fruchuxs Can you go to 'Help->About Visual Studio' and tell us what version of VS you have (see first screen shot below)? Also, is the text in your "No Source" window (second screen shot)?
gregg-miskelly
on 3 Feb 2018
I have the same problem as @Fruchuxs on VS 2017 Enterprise 15.5.6.
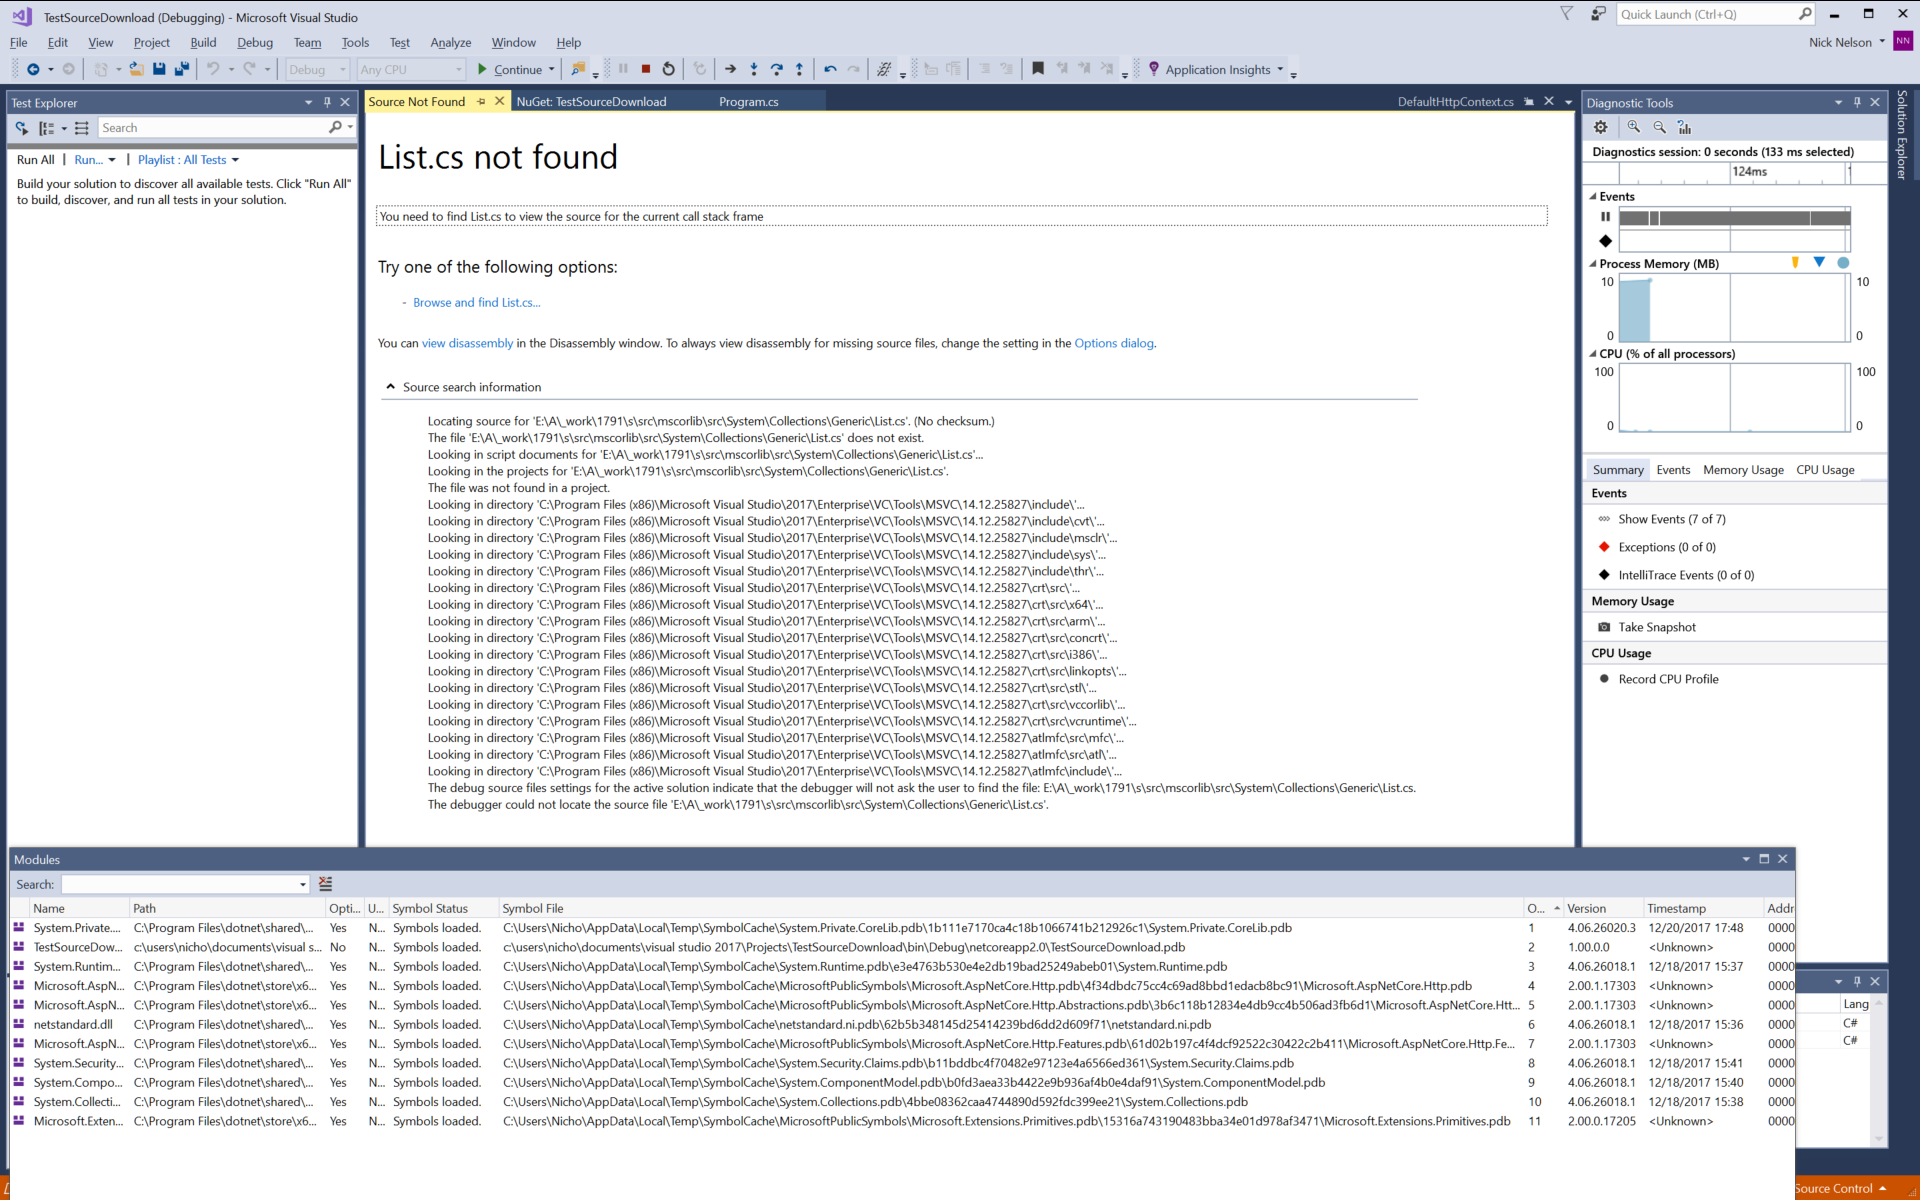
I'm using the 2.0.5 runtime. Trying to step into a new List<string>() failed, it didn't even prompt me to download the source code.
I also tried stepping into a new DefaultHttpContext(), which worked fine (the debugger prompted me to download the source code).
class Program
    {
        static void Main(string[] args)
        {
            var temp2 = new DefaultHttpContext();
            var temp = new List<string>();
        }
    }
When I look at the pdb for Microsoft.AspNetCore.Http.Abstractions with a text editor, I can see a reference to GitHub. When I do the same for the Systems.Collections.pdb which should contain List<string>, I don't see any reference to GitHub.
 npnelson
on 4 Feb 2018
npnelson
on 4 Feb 2018
VS 15.5.6 - the latest one.
Locating source for 'E:\A_work\1791\ssrc\mscorlibsrc\System\Threading\Tasks\Task.cs'. (No checksum.)
The file 'E:\A_work\1791\ssrc\mscorlibsrc\System\Threading\Tasks\Task.cs' does not exist.
Looking in script documents for 'E:\A_work\1791\ssrc\mscorlibsrc\System\Threading\Tasks\Task.cs'...
Looking in the projects for 'E:\A_work\1791\ssrc\mscorlibsrc\System\Threading\Tasks\Task.cs'.
The file was not found in a project.
The debug source files settings for the active solution indicate that the debugger will not ask the user to find the file: E:\A_work\1791\ssrc\mscorlibsrc\System\Threading\Tasks\Task.cs.
The debugger could not locate the source file 'E:\A_work\1791\ssrc\mscorlibsrc\System\Threading\Tasks\Task.cs'.
But I don't have a drive called "E:".
I'm behind a Web-Proxy. No download prompt or something similiar.
Fruchuxs
on 5 Feb 2018
I believe both @npnelson and @Fruchuxs issue is related to a build-time issue in .NET Core (see https://github.com/dotnet/buildtools/issues/1896). Effectively some framework DLLs need extra processing via a tool called 'GenFacades' and this tool drops the SourceLink information necessary to step into them.
You can tell this issue because it happens to only SOME parts of the framework (indeed exactly the list in https://github.com/dotnet/buildtools/issues/1896). The work-around is to download the source code for those particular DLLs locally (Note that only https://github.com/dotnet/corefx has this problem so if you clone that repository to the correct commit (which is in the version information for every DLL in CoreFX), then you can step through source.
vancem
on 5 Feb 2018
On further investigation, while the issue I mentioned above (1896) CAN be relevate to @npnelson s issue it is definitely not associatd with @Fruchuxs issue because that one clearly is trying to fetch things form 'mscorlib' which only exists in CoreCLR and CoreCLR does not generate facades (which is needed for issue 1896 to manifest).
I looked into it a bit, and most likely (and maybe in both cases) the issue is that while Version 2.0.3 of the runtime HAS proper sourceLink support, it is not true for Version 2.0.5.
One work-around is to simply go back to Version 2.0.3 (if you simply uninstall 2.0.5 it likely will fix things). You can download the source as mentioned in 1896 as well)
This should not affect ASP.NET DLLs (Since they were not updated in Version 2.0.5).
I should be able to fix this (by patching the PDBS). I will let you know when I have done this.
vancem
on 5 Feb 2018
Hmm okay, but if I want to jump into an asp.net method-call like a TagHelper from asp.net, I get the same problem.
EDIT: And I use version 2.0.3 of the Microsoft.AspNetCore.All nuget package.
Fruchuxs
on 6 Feb 2018
@Fruchuxs - My spot-tests of stepping into ASP.NET Code using V2.0.3 of ASP.NET That is the following line in my *.csproj
<PackageReference Include="Microsoft.AspNetCore.All" Version="2.0.3" />
I can successfully step into something like ImageTagHelper(...).
It also worked for 2.0.5 (this is the lastest public release).
Something you can try is to close VS, delete the %TEMP%\SymbolCache and then try again. This will force the symbols to be re-downloaded.
For TagHelpers the important DLL is probably Microsoft.AspNetCore.Mvc.TagHelpers, and if you go to the debug -> Windows -> Modules pane you will see this DLL and its cooresponding PDB. Mine is at
...\AppData\Local\Temp\SymbolCache\Microsoft.AspNetCore.Mvc.TagHelpers.pdb\A742A2B29D2B4658831AD145DC0849BD1
And yours should have this same GUID-like number. My PDB is
02/06/2018 11:32 AM 247,296 Microsoft.AspNetCore.Mvc.TagHelpers.pdb
and yours should have exactly the same size. If you get that far, and you are using a recent version of Visual Studio, I would expect it to work.
vancem
on 6 Feb 2018
I have patched the symbol files for .NET Core Framework dlls for version 2.0.5 of the .NET Runtime but ran into a snag getting the files uploaded to the Microsoft symbol server. We will get it figured out, but it may be a matter of days if we are unlucky.
In the mean time, if you are running on .NET Core V2.0.5 (X64) and want to step into .NET Framework code with source code in VS 2017 you can download and unzip DotNetCore_V2.05_X64_Symbols.zip and place them on the symbol path (go to tools -> Options -> Debugging -> Symbols).
With luck very soon I will tell you that it 'just works'.
vancem
on 7 Feb 2018
I have just confirmed that my updated PDBs have been published to the Microsoft symbol server. Thus you should now be able to step into code in framework code in V2.0.5 of .NET Core.
There is one caveat, which is that if you have ALREADY attempted to do this you have cached 'bad' information that needs to be flushed. To fix this.
close Visual Studio and delete the %TEMP%\SymbolCache directory. THis gets rid of the old PDBs.
You may also need to got the solution explorer right click on the solution file -> Properties -> Common Properties -> Debug Source Files, and then look if there are any entries in the 'Do not look for these Source Files' textbox. Delete any of these (this tells VS to try again to fetch the source code).
vancem
on 7 Feb 2018
Another reminder that the instructions here
Work (and in particular tell you how to see local variables in framework code if those are important to your debugging.
Also if you think that Visual Studio should diasable optimizations in the framework when you are stepping through it by default, please see this Visual Studio suggestion and vote for it.
vancem
on 7 Feb 2018
@vancem Thanks a bunch, I just tested it and it works great. This is an awesome feature.
npnelson
on 7 Feb 2018
Sorry for my late response.
Thanks for your work, but it didn't work for me. VS loads the PDBs from the symbol servers. I cleared them and he loads them again.
<PackageReference Include="Microsoft.AspNetCore.All" Version="2.0.3" />
Checked.
A742A2B29D2B4658831AD145DC0849BD1 My
A742A2B29D2B4658831AD145DC0849BD1 Yours
Checked.
Size of my TagHelpers.pdb: 241 KB (247.296 Bytes)
Hmmm, maybe strange.
If I want to debug an attribute-Tag-Helper he wants to open the Task.cs and always looks in the E:-Path. Now I tried to Debug the View()-Method-Call inside a controller and he tries to open
C:\b\w\e1736bbee5c34dcamodules\Mvcsrc\Microsoft.AspNetCore.Mvc.ViewFeatures\Controller.cs
Source Search Information:
Locating source for 'C:\b\w\e1736bbee5c34dcamodules\Mvcsrc\Microsoft.AspNetCore.Mvc.ViewFeatures\Controller.cs'. Checksum: SHA1 {89 cd 27 45 c0 e 2 8d cc 31 a7 f2 38 4 3e ef 59 90 87 ec}
The file 'C:\b\w\e1736bbee5c34dcamodules\Mvcsrc\Microsoft.AspNetCore.Mvc.ViewFeatures\Controller.cs' does not exist.
Looking in script documents for 'C:\b\w\e1736bbee5c34dcamodules\Mvcsrc\Microsoft.AspNetCore.Mvc.ViewFeatures\Controller.cs'...
Looking in the Edit-and-Continue directory 'D:\Desktop\Projekte\eswawi\enc_temp_folder\'...
The file with the matching checksum was not found in the Edit-and-Continue directory.
Looking in the projects for 'C:\b\w\e1736bbee5c34dcamodules\Mvcsrc\Microsoft.AspNetCore.Mvc.ViewFeatures\Controller.cs'.
The file was not found in a project.
Searching for documents embedded in the symbol file.
An embedded document was not found.
Looking for source using source server...
The debugger will ask the user to find the file: C:\b\w\e1736bbee5c34dcamodules\Mvcsrc\Microsoft.AspNetCore.Mvc.ViewFeatures\Controller.cs.
The user pressed Cancel in the Find Source dialog. The debug source files settings for the active solution have been modified so that the debugger will not ask the user to find the file: C:\b\w\e1736bbee5c34dcamodules\Mvcsrc\Microsoft.AspNetCore.Mvc.ViewFeatures\Controller.cs.
The debugger could not locate the source file 'C:\b\w\e1736bbee5c34dcamodules\Mvcsrc\Microsoft.AspNetCore.Mvc.ViewFeatures\Controller.cs'.
Fruchuxs
on 12 Feb 2018
@Fruchuxs - what version of Visual Studio are you using?
Does source lookup from the framework for any part of the framework? If it works sometimes but not others, it becomes very important to get the details right. Ideally you can repro your result on say the .NET sample MVC program (which we have here internally), and we can see if we can reproduce your issue internally. If so we have a very good chance of fixing it.
Vance
vancem
on 12 Feb 2018
I tried multiple "Step Into", he evertime asks me for finding the source manually.
As previously said, I'm using 15.5.6. I'm wondering that the path has changed but is still wrong.
Fruchuxs
on 14 Feb 2018
@Fruchuxs
After downloading the new PDBs, did you go to solution properties, go to the "Debug Source Files" tab, and clear out the 'Do not look for these source files' pain?
Do you have Tools->Options->Debugging->Enable Source Link support checked?
gregg-miskelly
on 14 Feb 2018
Did you mean the new downloaded PDBs by VS after deleting them? Yep, cleared the whole text field. I mean Source Link is activated, but I will check it tomorrow.
I didn't tried the linked PDBs cuz they are for 2.0.5.
Fruchuxs
on 14 Feb 2018
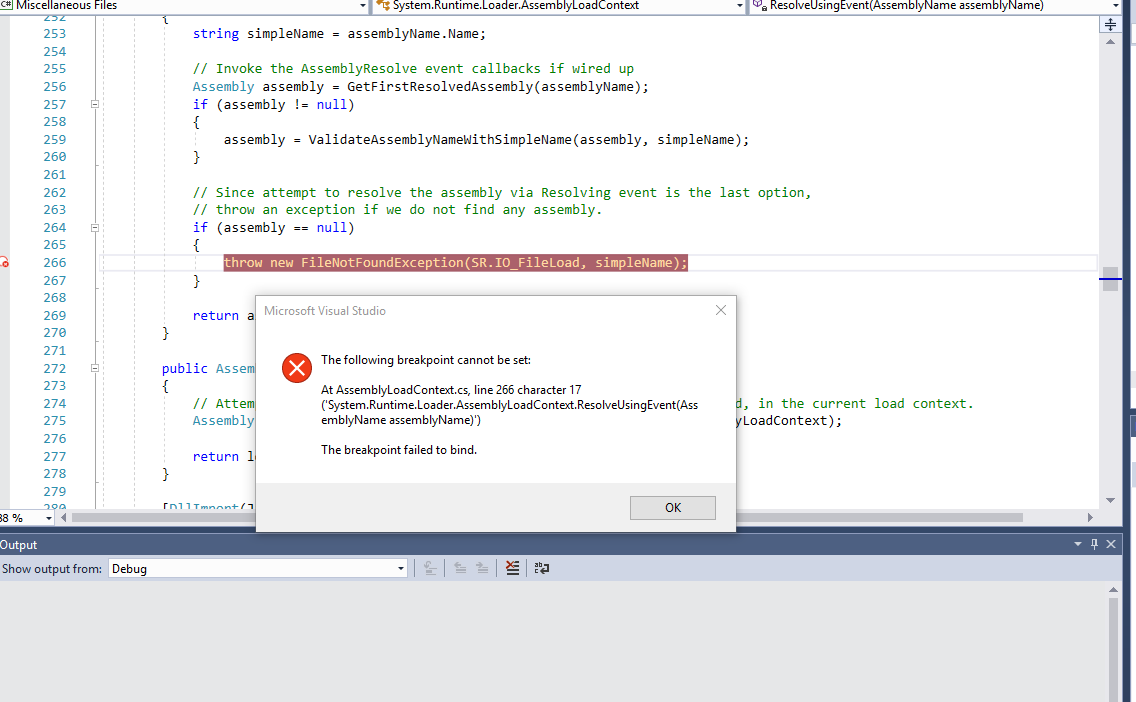
I read all the posts here and i still can't watch a variable in the .net core 2.0.0 source file AssemblyLoadContext.cs.
This file throws an exception, and I get jumped to the right line, but setting a breakpoint there doesn't get it to stop, and I get the attached error. When I try to watch for the variable, I get the following error:
| Name | Value | Type
-- | -- | -- | --
| assemblyName | Cannot obtain value of the local variable or argument because it is not available at this instruction pointer, possibly because it has been optimized away. | System.Reflection.AssemblyName
This is coming from an xunit test I'm trying to debug, and I did set the environment variable. going to dissasembly reveals some lines with question marks and some code, I don't know the meaning of it.
I'm trying to understand why it can't find a file $exception {System.IO.FileNotFoundException: Could not load the specified file.
File name: 'Microsoft.VisualStudio.TestPlatform.Common.resources'
at System.Runtime.Loader.AssemblyLoadContext.ResolveUsingEvent(AssemblyName assemblyName)} System.IO.FileNotFoundException
Even after installing Microsoft.VisualStudio.TestPlatform Nuget Package.
 ronenfe
on 9 Apr 2018
ronenfe
on 9 Apr 2018
@ronenfe this means that the process you are debugging is still using the pre-compiled native image for the code you are referencing. Unfortunately, I don't know if there is a good way to start the xunit worker process directly under the debugger with the environment variable COMPlus_ZapDisable=1 set from before CoreCLR loads.
gregg-miskelly
on 10 Apr 2018
I'm experiencing this error:
Microsoft.AspNetCore.Mvc.Core.pdb could not be found in the selected paths
I have followed the instructions. I have unchecked Just My Code, I have enabled Microsoft Symbol Servers, I have enabled Source Link Support.
The only symbol server path I have is the default Microsoft Symbol Server, which I have enabled. Could VS somehow not be connecting to the Microsoft Symbol Server?
My project is an ASP Net Core 2.0 MVC app (created with 'dotnet new mvc'). It says in the project properties that it is targeting .net core 2.0.
Visual Studio is version 15.6.6
What could be preventing this from working?
 duncangravill
on 13 Apr 2018
duncangravill
on 13 Apr 2018
What this almost definitely means is that whatever version of Microsoft.AspNetCore.Mvc.Core.pdb that is loading in your app is somehow not on the Microsoft symbol server. Can you --
- Pull up the modules window (Debug->Windows->Modules)
- Right click on the Microsoft.AspNetCore.Mvc.Core.pdb row
- Just to be sure, invoke 'Load Symbols' to force a load. This will likely bring up a file open dialog. Cancel out of that if it does.
- Assuming that doesn't succeed, right click on Microsoft.AspNetCore.Mvc.Core.pdb again, and invoke 'Symbol Load Information'
- Copy paste the relevant lines about trying to download from the Microsoft symbol server into here.
gregg-miskelly
on 13 Apr 2018
@vancem @Eilon
I know there were some issues with sourcelink for ASP.NET and there is this issue tracking them. https://github.com/aspnet/Universe/issues/1049
Petermarcu
on 13 Apr 2018
@Petermarcu duncangravill's issue isn't related to that - he can't even download the PDB.
gregg-miskelly
on 13 Apr 2018
@gregg-miskelly I have followed your instructions but the only information given in the Symbol Load Information is 'Symbols not loaded'
I have checked dotnet version info. I'm on SDK version 2.1.104 and Shared Framework Host version 2.0.6. I went to the official dotnet download page and saw that these versions are the same as the current downloads. I downloaded the current SDK download anyway and did a repair on mine. The commit SHA was exactly the same after as it was before, no changes, and this made no difference to not being able to load symbols.
Any other ideas? Could I somehow not be connecting to the symbol server? I'm just on a regular home wifi network? Many thanks for your help.
duncangravill
on 14 Apr 2018
@duncangravill to make sure I understand, your target app is running locally on Windows?
gregg-miskelly
on 14 Apr 2018
@gregg-miskelly No, I've dockerized the app using the VS Add Docker Support, it's running in a Linux Docker container.
Does this mean it's not possible? I thought perhaps it was just visual studio that needs the symbols and source code.
duncangravill
on 14 Apr 2018
Symbol server will work on Linux starting with .NET Core 2.1 and VS 2017 version 15.7 (both need to be updated).
There aren't any great options for getting this to work with .NET Core 2.0. There are symbols zip files with each release (example). But I am not sure if they have a portable PDB for all the parts of the runtime or not. Hopefully someone else on this thread can comment more about this.
You would then need to copy the symbols into the target container next to the module, and for source you would need to clone the repo and check it out at the right tag.
gregg-miskelly
on 14 Apr 2018
The symbol packages for .NET Core 2.0 build for Linux machines should have the portable PDBs necessary to debug the framework. As Gregg mentions, there is not symbol server support or source line support, until the 2.1 release (which by the way, there a Preview out that should work (see https://github.com/dotnet/core/blob/master/release-notes/download-archive.md).
For runtimes before that, you need to download the symbol package place the PDBs on your symbol path. This should allow VSCode to find the (portable) PDBs. However these PDBs may not have the SourceLink information for finding the source code automatically form GitHub. TO work around that you need to clone the appropriate repository to the correct version and then add that to your source path. It is a multistep process that requires some care.
If you can debug using the 2.1 preview, you should strongly consider doing that.
vancem
on 16 Apr 2018
@vancem Thanks for the great help. Where can I find the symbol package for .net core 2.0.6 ?
duncangravill
on 18 Apr 2018
If you need the .NET Core or .NET Framework symbols (as opposed to Microsoft.ASPNET* code) there is a link for the 2.0.6 release off of https://github.com/dotnet/core/blob/master/release-notes/download-archive.md. THen click on the 'runtime' link under the 'Debug Symbols' YOu then have to unzip it and you will find *.nupkgs for each of the OSes. unpack the nugget package for your OS and then you have the symbols you need.
ASP.NET dlls are not in there. I don't know off hand where they are.
vancem
on 18 Apr 2018
@vancem @gregg-miskelly I decided to download VS 15.7 and experiment with ASP.NET Core 2.1, but still am not able to download the symbols for Microsoft.AspNetCore.Mvc.Core. The Dockerfile added to the project by adding docker support uses images such as microsoft/aspnetcore:2.1, however these images don't exist on docker hub, so I downloaded the aspnetcore:2.1.0-preview1 and aspnetcore-build:2.1.300-preview1 images from the microsoft/aspnetcore repo and aliased them as the image requested by the docker file. The app runs. I've configured the debug options again disabling Just my Code and enabling Source Link and Symbol Servers. This time, however, when VS says that the symbols haven't been loaded and I manually try to load them, the open dialog doesn't appear, there is just a notice saying that the symbols are loading for a second or two before fading away. So it seems like some symbols may or may not have loaded, but visual studio doesn't seem to have accepted them if they have.
Could the reason it's still not succeeding be because of the docker images I'm using? I'd like to try using images for the preview 2 of asp.net core 2.1 but the microsoft/aspnetcore docker repo is being consolidated into the microsoft/dotnet reop and I haven't a clue which images I should be using or even if there are any appropriate images yet in the repo, I just can't see any tags that seem to correspond to aspnetcore-build.
duncangravill
on 20 Apr 2018
@duncangravill Can you try this --
First, to make sure that the VS Docker tools haven't cached an old version of vsdbg, delete these files/folders if you have them:
- %TMP%\GetVsDbg.ps1
- %USERPROFILE%\vsdbg
Next configure the debugger so that:
- Tools->Options->Debugger->Symbols->'Microsoft Symbol Server' checked
- Tools->Options->Debugger->Symbols-> Automatic symbol loading preference set to "Load all modules, unless excluded"
- Tools->Options->Debugger->General-> Just My Code is off
Hit F5.
Do symbols still not load?
If not, does the output window have anything useful?
We ran out of time in 5.7 to add manual symbol loading (right clicking on a module and loading symbols) and providing the symbol load info though the modules window, but automatic symbol loading should be working.
I did test preview1 back when it was released, and those symbols were available at that time. So I would expect them to still be there.
gregg-miskelly
on 21 Apr 2018
@gregg-miskelly I have tried this, but no success.
When I'm debugging and a breakpoint is hit, I look in the call stack and double click on a stack frame and a tab opens saying 'Microsoft.AspNetCore.Mvc.Core.pdb not loaded', I click the load symbols button and an error message appears 'Microsoft.AspNetCore.Mvc.Core.pdb could not be found in the selected paths'.
I have also checked the Modules window but as I should expect given your info there was no info in the modules window.
...So it seems like the symbols for the framework and runtime the app is targeting aren't on the server. The docker image I'm using is Microsoft/aspnetcore:2.1.0-preview1 and the MVC app was created with version 2.1.300-preview1-008174 of the tools.
duncangravill
on 25 Apr 2018
@gregg-miskelly @vancem
I'm still unable to acquire the debug symbols. I now have the released VS 15.7, I've updated my Dockerfile and project target framework to target microsoft/dotnet:2.1.0-rc1-aspnetcore-runtime and 2.1.0-rc1-final. I have repeated your steps to delete the debug folders. However I am still unable to download any symbols from the Microsoft Symbol server, I always get the error message 'Microsoft.AspNetCore.Mvc.Core.pdb could not be found in the selected paths'. I have checked the Symbol Cache on my machine and confirmed that no symbols have been downloaded.
Are there no symbols for RC1? Any ideas on why I'm still unable to download symbols? Thanks :)
duncangravill
on 9 May 2018
@duncangravill If you open the Debug pain of the output window, and scroll up to the top, do you see something like this? This is a bug in the Docker Tools, which I believe they have fixed, but not shipped yet. I am trying to fugue out how to work around it.
WARNING: The specified symbol cache directory 'C:\Users\greggm\AppData\Local\Temp\SymbolCache' is an invalid fully qualified directory name and was ignored.
WARNING: Symbol server entries in the symbol path are being ignored because the symbol cache path setting is missing or an invalid path.
@gregg-miskelly Thanks, yes, I'm seeing these warning messages.
duncangravill
on 10 May 2018
@duncangravill Thanks. The VS Docker Tools team did some work to improve this experience. Unfortunately that work didn't get done in time for 15.7, and further unfortunately my team didn't realize quite how broken things were without their work. This feature will get much better in 15.8.
In the mean time, you can work around this thusly --
- Open a developer command prompt
- Run:
"%DevEnvDir%vsregedit.exe" set "%VSINSTALLDIR:~0,-1%" HKLM AD7Metrics\Engine\{2833D225-C477-4388-9353-544D168F6030} ExcludeLocalSymbols DWORD 1 - Restart VS
This setting will get overwritten when you install a VS update, so you may need to redo this from time to time.
gregg-miskelly
on 10 May 2018
@gregg-miskelly Thank you, VS is now downloading the symbols, however, the source files are not being found by the Source Link.
In the 'Source search information' in the 'Source Not Found' tab there is information with the GitHub URL of the source file. I have checked the URL and am able to access the source files in a browser, however, the search information is reporting an error with error code 404.
I have tried to find a work around by downloading the source files and adding them to the asp.net core project, but unfortunately I encountered complications.
I appreciate that these features are currently under construction, I'm looking forward to upcoming improvements :)
duncangravill
on 15 May 2018
@duncangravill what URL was giving the 404? I haven't seen this issue.
gregg-miskelly
on 15 May 2018
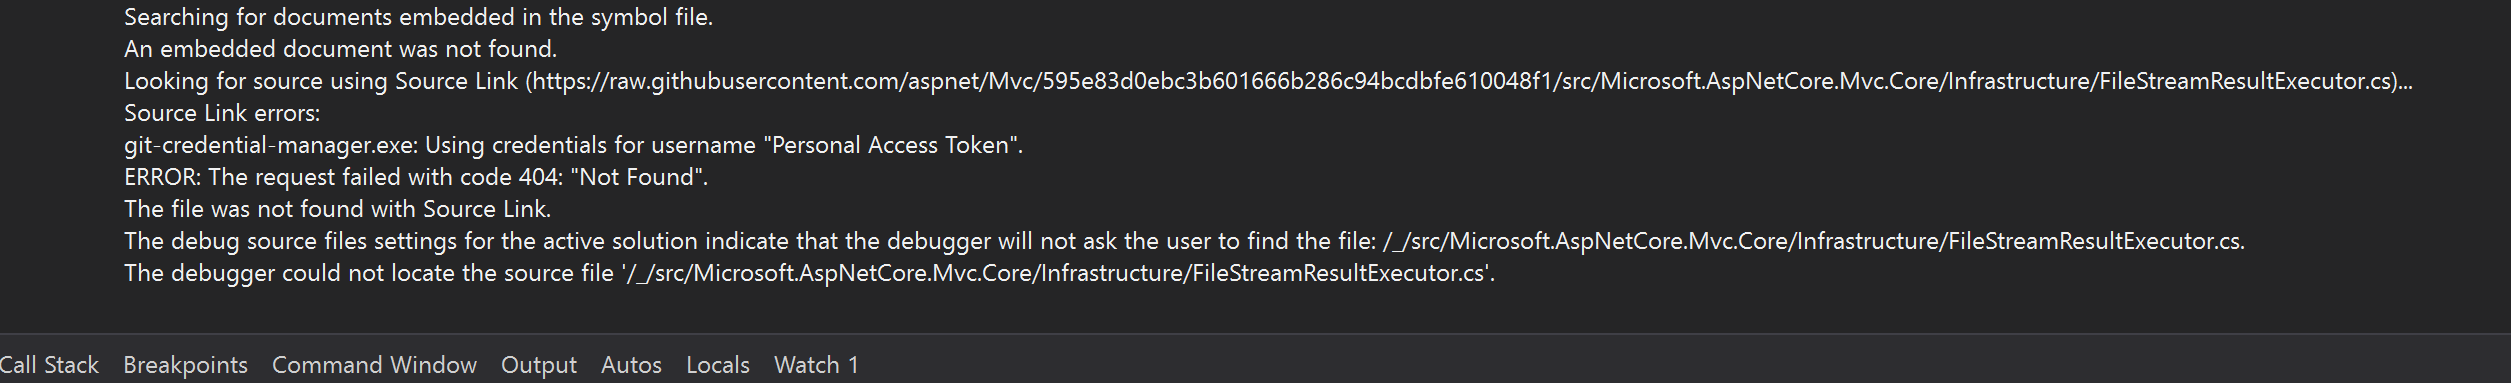
@gregg-miskelly
Looking for source using Source Link (https://raw.githubusercontent.com/aspnet/Mvc/595e83d0ebc3b601666b286c94bcdbfe610048f1/src/Microsoft.AspNetCore.Mvc.Core/Infrastructure/FileStreamResultExecutor.cs)...
Source Link errors:
git-credential-manager.exe: Using credentials for username "Personal Access Token".
ERROR: The request failed with code 404: "Not Found".
The file was not found with Source Link.
As the URLs can be viewed in a browser I'm wondering if the 404 is related to the credentials as 'Personal Access Token' seems a strange username, it seems strange though as credentials aren't needed to access the URL in the browser.
duncangravill
on 15 May 2018
@duncangravill: Thanks! What seems to be happening is that when we try to connect to GitHub with your credentials, GitHub doesn't like your credentials and so the SourceLink request fails. Visual Studio should probably try the URL again without authentication to handle cases where authentication isn't required.
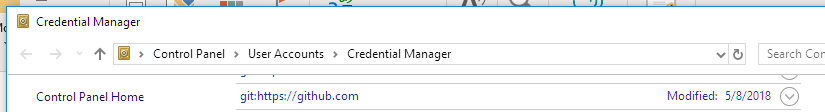
You can probably work around the issue if you go to Control Panel and open the Credential Manager, switch to 'Windows Credentials, find 'git:https://github.com' in the list, and delete it.
Example:
CC @chuckries
gregg-miskelly
on 15 May 2018
@duncangravill are you copying the Source Link error text from the "Source Not Found: Source Link Authentication Failed" page in Visual Studio? If so, what happens when you click the first hyperlink to try to authenticate to Source Link?
 chuckries
on 15 May 2018
chuckries
on 15 May 2018
@gregg-miskelly Super!! Both symbols and source via Source Link are loading, and I'm able to use these features debugging in a docker container!! Thank you!
@chuckries I wasn't seeing the page you mentioned, I was seeing the a source not found page like below:
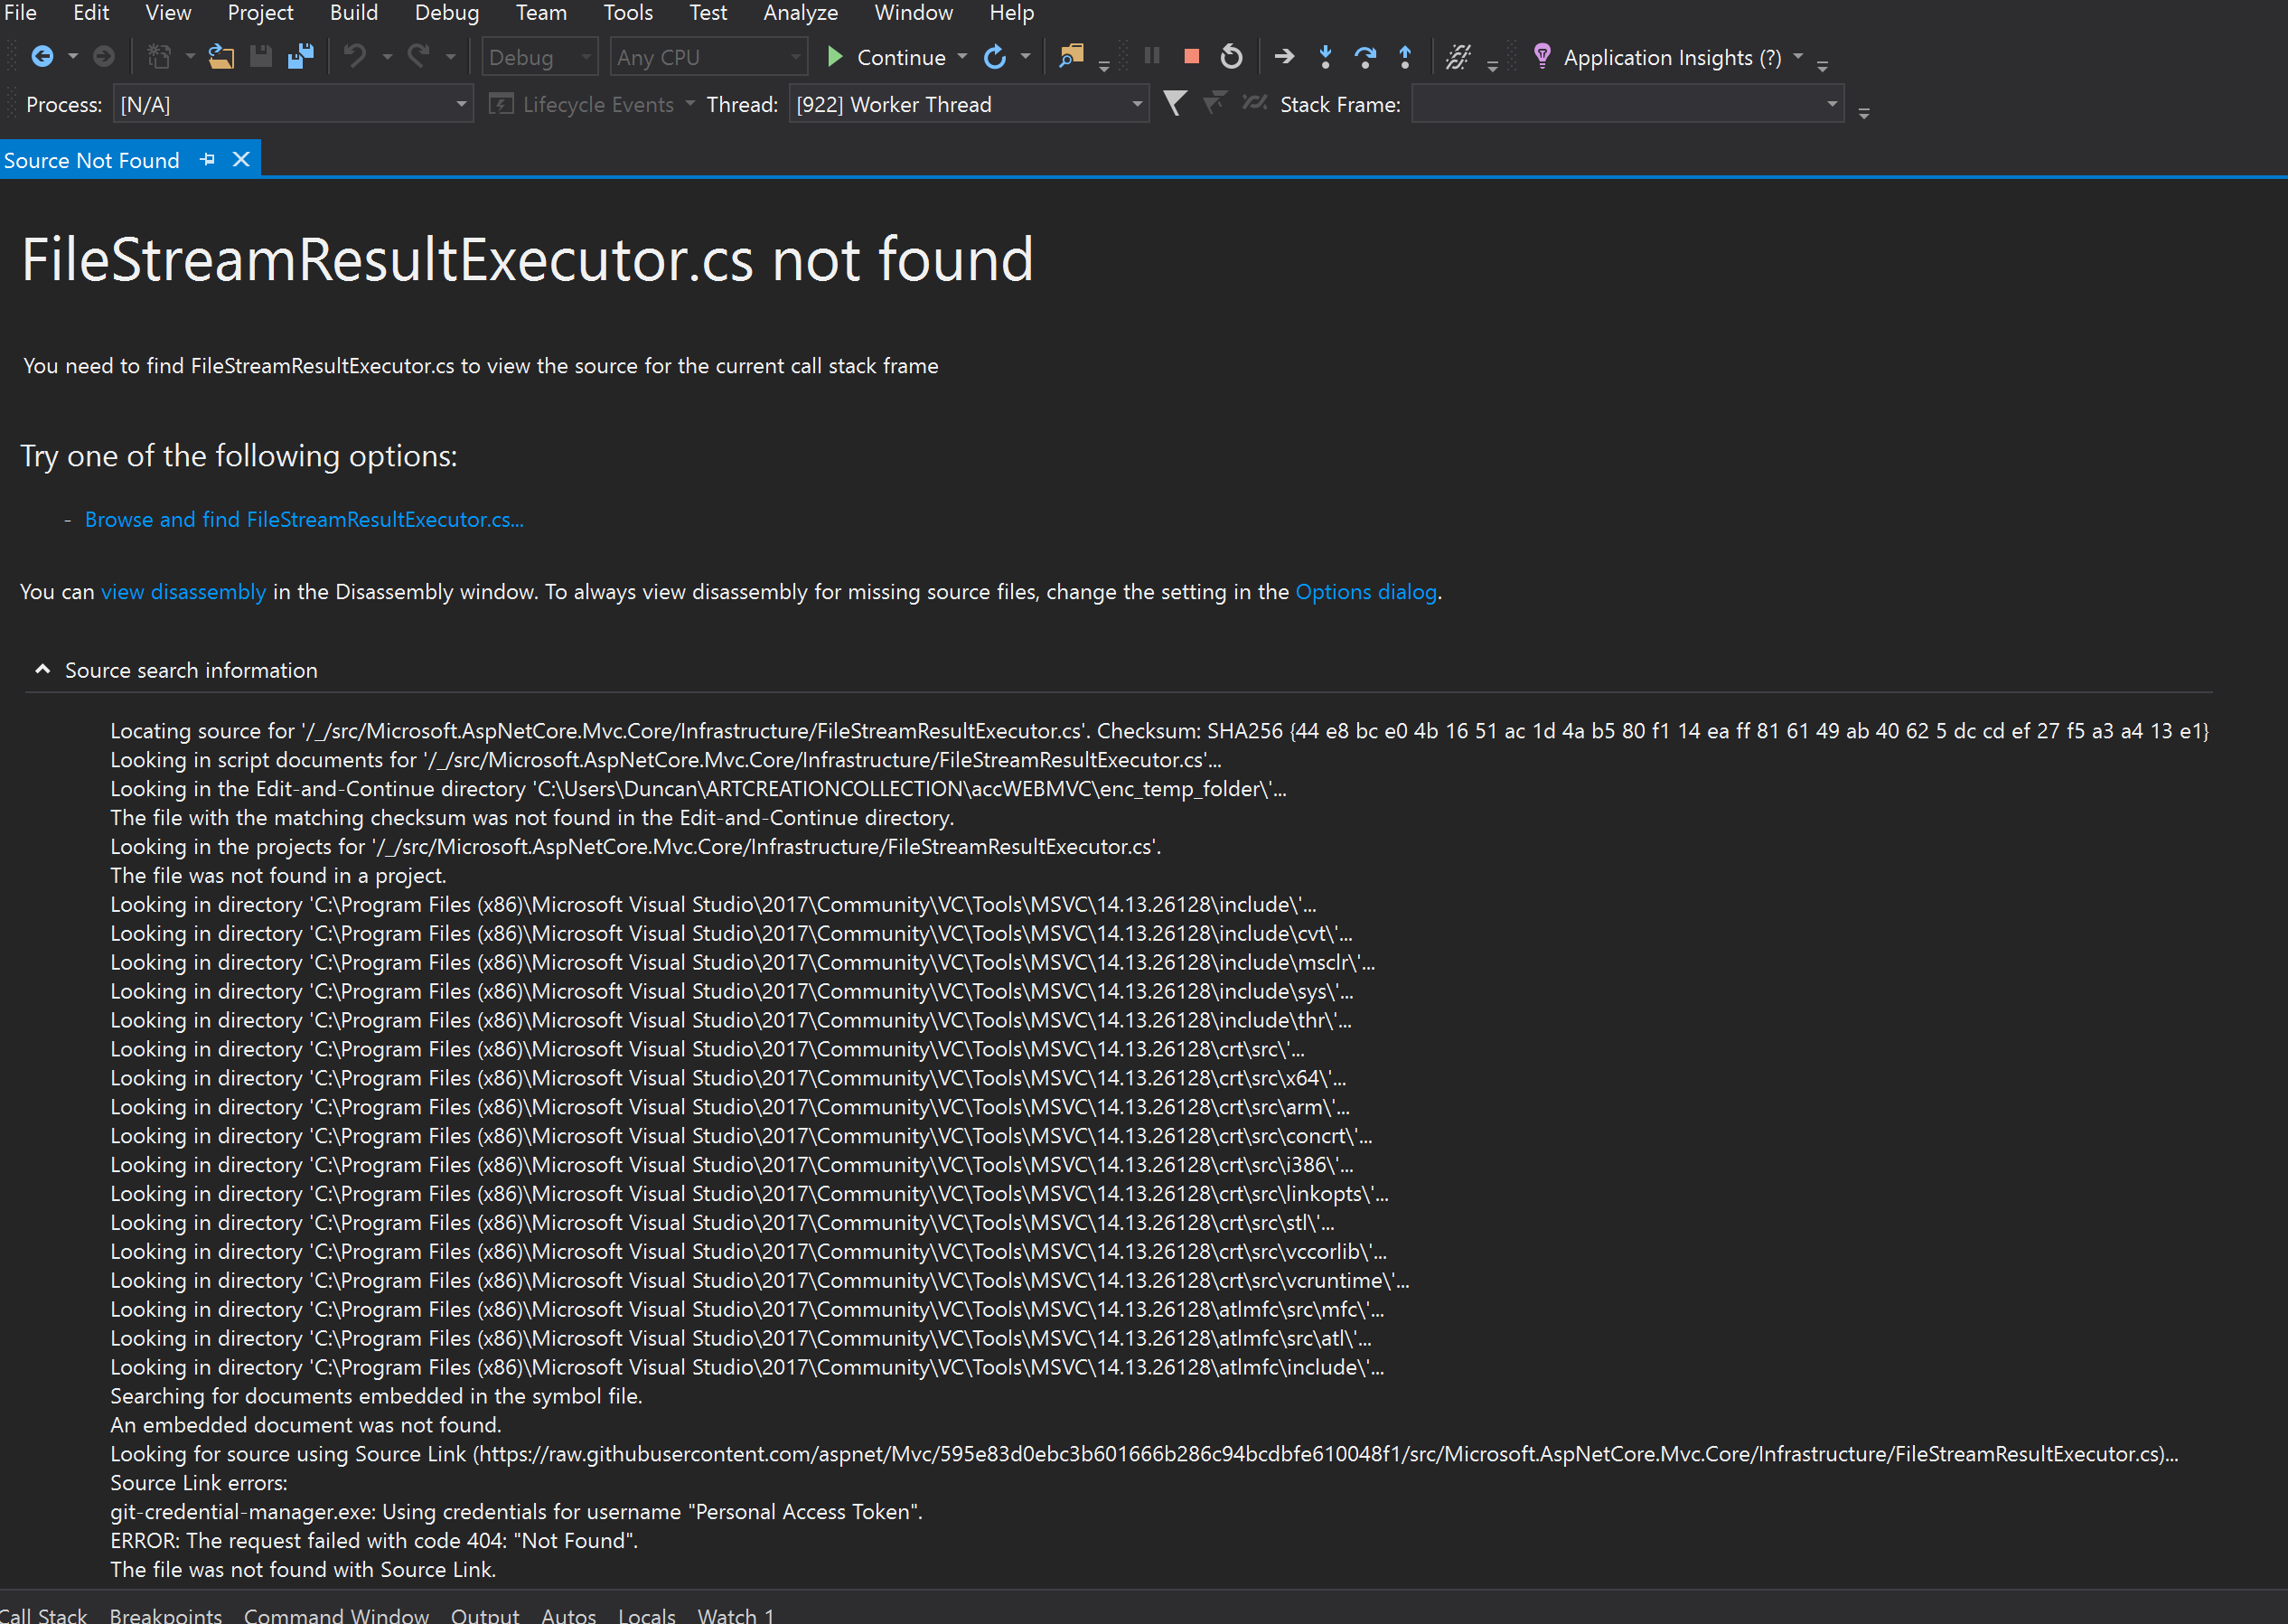
I suppose, if authentication is failing, then the 'Source Link Authentication Failed' isn't opening, instead there is a standard 'Source Not Found' page, as there isn't a hyperlink to authenticate to Source Link on this page I wasn't able to test it for you.
duncangravill
on 16 May 2018
I can't seem to get VS to load symbols for Microsoft.AspNetCore.Hosting.dll. Here's the log from VS 2017 15.7.1. What am I missing? I have source link enabled and just my code disabled
C:\Program Files\dotnet\Microsoft.AspNetCore.Hosting.pdb: Cannot find or open the PDB file.
C:\Program Files\dotnet\store\x64\netcoreapp2.0\microsoft.aspnetcore.hosting\2.0.3\lib\netstandard2.0\Microsoft.AspNetCore.Hosting.pdb: Cannot find or open the PDB file.
C:\WINDOWS\Microsoft.AspNetCore.Hosting.pdb: Cannot find or open the PDB file.
C:\WINDOWS\symbols\dll\Microsoft.AspNetCore.Hosting.pdb: Cannot find or open the PDB file.
C:\WINDOWS\dll\Microsoft.AspNetCore.Hosting.pdb: Cannot find or open the PDB file.
C:\Users\szilv\AppData\Local\Temp\SymbolCache\Microsoft.AspNetCore.Hosting.pdb\eab0dc3e770741c3804e14f3dfcc3f7affffffff\Microsoft.AspNetCore.Hosting.pdb: Cannot find or open the PDB file.
C:\Users\szilv\AppData\Local\Temp\SymbolCache\MicrosoftPublicSymbols\Microsoft.AspNetCore.Hosting.pdb\eab0dc3e770741c3804e14f3dfcc3f7affffffff\Microsoft.AspNetCore.Hosting.pdb: Cannot find or open the PDB file.
C:\Users\szilv\AppData\Local\Temp\SymbolCache\Microsoft.AspNetCore.Hosting.pdb\eab0dc3e770741c3804e14f3dfcc3f7a1\Microsoft.AspNetCore.Hosting.pdb: Cannot find or open the PDB file.
C:\Users\szilv\AppData\Local\Temp\SymbolCache\MicrosoftPublicSymbols\Microsoft.AspNetCore.Hosting.pdb\eab0dc3e770741c3804e14f3dfcc3f7a1\Microsoft.AspNetCore.Hosting.pdb: Cannot find or open the PDB file.
SYMSRV:  BYINDEX: 0x1BA
         C:\Users\szilv\AppData\Local\Temp\SymbolCache*https://msdl.microsoft.com/download/symbols
         Microsoft.AspNetCore.Hosting.pdb
         EAB0DC3E770741C3804E14F3DFCC3F7Affffffff


SYMSRV:  UNC: C:\Users\szilv\AppData\Local\Temp\SymbolCache\Microsoft.AspNetCore.Hosting.pdb\EAB0DC3E770741C3804E14F3DFCC3F7Affffffff\Microsoft.AspNetCore.Hosting.pdb - path not found


SYMSRV:  UNC: C:\Users\szilv\AppData\Local\Temp\SymbolCache\Microsoft.AspNetCore.Hosting.pdb\EAB0DC3E770741C3804E14F3DFCC3F7Affffffff\Microsoft.AspNetCore.Hosting.pd_ - path not found


SYMSRV:  UNC: C:\Users\szilv\AppData\Local\Temp\SymbolCache\Microsoft.AspNetCore.Hosting.pdb\EAB0DC3E770741C3804E14F3DFCC3F7Affffffff\file.ptr - path not found


SYMSRV:  HTTPGET: /download/symbols/Microsoft.AspNetCore.Hosting.pdb/EAB0DC3E770741C3804E14F3DFCC3F7Affffffff/Microsoft.AspNetCore.Hosting.pdb


SYMSRV:  HttpQueryInfo: 80190194 - HTTP_STATUS_NOT_FOUND


SYMSRV:  HTTPGET: /download/symbols/Microsoft.AspNetCore.Hosting.pdb/EAB0DC3E770741C3804E14F3DFCC3F7Affffffff/Microsoft.AspNetCore.Hosting.pd_


SYMSRV:  HttpQueryInfo: 80190194 - HTTP_STATUS_NOT_FOUND


SYMSRV:  HTTPGET: /download/symbols/Microsoft.AspNetCore.Hosting.pdb/EAB0DC3E770741C3804E14F3DFCC3F7Affffffff/file.ptr


SYMSRV:  HttpQueryInfo: 80190194 - HTTP_STATUS_NOT_FOUND


SYMSRV:  RESULT: 0x80190194


SYMSRV:  BYINDEX: 0x1BB
         C:\Users\szilv\AppData\Local\Temp\SymbolCache*https://msdl.microsoft.com/download/symbols
         Microsoft.AspNetCore.Hosting.pdb
         EAB0DC3E770741C3804E14F3DFCC3F7A1


SYMSRV:  UNC: C:\Users\szilv\AppData\Local\Temp\SymbolCache\Microsoft.AspNetCore.Hosting.pdb\EAB0DC3E770741C3804E14F3DFCC3F7A1\Microsoft.AspNetCore.Hosting.pdb - path not found


SYMSRV:  UNC: C:\Users\szilv\AppData\Local\Temp\SymbolCache\Microsoft.AspNetCore.Hosting.pdb\EAB0DC3E770741C3804E14F3DFCC3F7A1\Microsoft.AspNetCore.Hosting.pd_ - path not found


SYMSRV:  UNC: C:\Users\szilv\AppData\Local\Temp\SymbolCache\Microsoft.AspNetCore.Hosting.pdb\EAB0DC3E770741C3804E14F3DFCC3F7A1\file.ptr - path not found


SYMSRV:  HTTPGET: /download/symbols/Microsoft.AspNetCore.Hosting.pdb/EAB0DC3E770741C3804E14F3DFCC3F7A1/Microsoft.AspNetCore.Hosting.pdb


SYMSRV:  HttpQueryInfo: 80190194 - HTTP_STATUS_NOT_FOUND


SYMSRV:  HTTPGET: /download/symbols/Microsoft.AspNetCore.Hosting.pdb/EAB0DC3E770741C3804E14F3DFCC3F7A1/Microsoft.AspNetCore.Hosting.pd_


SYMSRV:  HttpQueryInfo: 80190194 - HTTP_STATUS_NOT_FOUND


SYMSRV:  HTTPGET: /download/symbols/Microsoft.AspNetCore.Hosting.pdb/EAB0DC3E770741C3804E14F3DFCC3F7A1/file.ptr


SYMSRV:  HttpQueryInfo: 80190194 - HTTP_STATUS_NOT_FOUND


SYMSRV:  RESULT: 0x80190194


https://msdl.microsoft.com/download/symbols: Symbols not found on symbol server.
 szilvaa
on 18 May 2018
szilvaa
on 18 May 2018
@szilvaa I can confirm that the symbols for Microsoft.AspNetCore.Hosting.dll version 2.0.3 are not on Microsoft Public Symbol Servers. Without symbols there is no Source Link information. I tried the 2.1.0-rc1 version and its symbols loaded successfully.
This bug looks relevant: https://github.com/aspnet/Hosting/issues/1284
@muratg @davidfowl @vancem Any ideas here?
chuckries
on 18 May 2018
Between 2.0 and 2.1 we were still working the kinks out of our symbol publishing story. There were bugs in either the way symbols were generated and/or how we automatically published them. Some of these builds we fixed things by hand, but there are now 9 different 2.0.X releases and we DON'T like to change things in servicing releases.
The upshot is that because it is so easy to upgrade and we KNOW that 2.1 works properly, the value of hand fixing every 2.0.X release is dubious (and decreases as time goes on).
All of our releases are here https://github.com/dotnet/core/blob/master/release-notes/download-archive.md. Ideally you install the latest 2.1 release if you want to debug through the framework. (they are side by side (although it does roll forward by default).
You could make a case that 2.0.7, which is the latest (and maybe last 2.0.X release), should work (and I agree with that since it currently is our latest 'officially released' version) if that does not have proper symbols, we should fix it by hand).
But if you want to be sure it works, just use 2.1.
vancem
on 18 May 2018
@vancem I think most of your comments are for .NET Core and not necessarily ASP.NET Core. I was unable to find any aspnet symbols linked from https://github.com/dotnet/core/blob/master/release-notes/download-archive.md.
Is there any more specific info about this for aspnet core?
chuckries
on 18 May 2018
cc @preetikr
 muratg
on 18 May 2018
muratg
on 18 May 2018
@chuckries My comments are mostly that 'things might not work before 2.1', which as we have seen in this particular case, certainly apply to ASP.NET Core. The build and symbol publishing systems for ASP.NET Core and .NET Core are different and EXACTLY what works and what does not and what was hand fixed and by whom definitely varies, but I believe my advice is still correct, namely.
- Things may or may not work before 2.1 depending on exactly what you are trying.
- The value of fixing up older servicing releases of 2.0.X is low and may never be done uniformly.
- Thus the best mitigation is to upgrade to 2.1 (which should not be a big deal).
- 2.0.7 is more likely to work than older versions, if it does not work we would probably fix it, but ideally you just use 2.1
vancem
on 18 May 2018
@vancem Thank you for your confirmation. I can't migrate beyond 2.0.5 because that's the latest that AWS Lambdas support. But I can use 2.1 on my machine and learn the things I want to learn by stepping through the source. I suspect most of that will be applicable to 2.0.x.
szilvaa
on 19 May 2018
I'm stepping through the source of FileStream.cs, Source Link has loaded the appropriate source for my Linux debug environment, however, I'd like to set a breakpoint in Stream.cs. Is there an easy way to load Stream.cs? I can't easily spot a call into Stream.cs so I'm not sure if I can step into it to get Source Link to automatically download Stream.cs. I've tried right clicking on the declaration of Stream as base class of FileStream and following Go To Definition and Go To Implementation, however these only show a version of Stream.cs from Metadata.
Is there a way I can instruct VS to download and display Stream.cs ?
Will the finished version of the Source Link feature enable Go To Definition to automatically download the source?
duncangravill
on 19 May 2018
The language services team is interested in leveraging SourceLink in Go To Definition. That work is tracked with: https://github.com/dotnet/roslyn/issues/24349
Here are the work arounds I can think of today:
- You could just download the file manually from HitHub and open it. You can use the tag to make sure you have the right version.
- You could make a tiny console app and call an API you know is implemented in it. Now you can step in.
- (Windows debugging only) You could set a breakpoint by function name, and then right click on the breakpoint in the breakpoints window and invoke 'Go To Source'.
gregg-miskelly
on 19 May 2018
Confirming the 3rd option that @gregg-miskelly recommends ...
I was having trouble stepping into the Identity UserManager.GetUserAsync() method. I nuked my local symbols as described by @vancem, restarted VS17 and compiled the project (this may not be required), and then created a new breakpoint by simply entering the name "GetUserAsync" (no quotes).
When I ran the project it took forever to start-up, but I stopped panicking when I noticed that the %Temp%\SymbolCache was growing like crazy downloading all the PDB files. ;-}
Once the home page rendered in the browser, I right-moused on the breakpoint, selected the "Go to Source Code" option and boom like that ... it opened up the file!
 samconn
on 14 Jun 2018
samconn
on 14 Jun 2018
I wanted to add that it is also possible (and pretty easy)( to debug through the framework if you use Visual Studio Code instead of Visual Studio. This is how you would do it on Linux for example (It also works on Windows).
See See https://github.com/OmniSharp/omnisharp-vscode/wiki/Debugging-into-the-.NET-Framework-itself for instructions on setting VSCode launch settings to make this work.
If anyone has specific instructions for doing this on Visual Studio for Mac, we should also add them here (it was raised recently in https://github.com/aspnet/Docs/issues/4155).
vancem
on 2 Jul 2018
I followed the instructions (Unchecked "Enable Just My Code", checked "Microsoft Symbol Servers" and checked ""Enable Source Link support"), but still can't step into ASP.NET Core source code because symbols are not loaded.
Here is the "Symbol Load Information" from the Modules window for Microsoft.AspNetCore.dll (empty lines were removed and personal information was redacted):
C:\Program Files\dotnet\Microsoft.AspNetCore.pdb: Cannot find or open the PDB file.
C:\Program Files\dotnet\shared\Microsoft.AspNetCore.App\2.1.2\Microsoft.AspNetCore.pdb: Cannot find or open the PDB file.
C:\WINDOWS\Microsoft.AspNetCore.pdb: Cannot find or open the PDB file.
C:\WINDOWS\symbols\dll\Microsoft.AspNetCore.pdb: Cannot find or open the PDB file.
C:\WINDOWS\dll\Microsoft.AspNetCore.pdb: Cannot find or open the PDB file.
C:\Users\[REDACTED]\AppData\Local\Temp\SymbolCache\Microsoft.AspNetCore.pdb\8e776b6e10b14bcab493c987e0107684ffffffff\Microsoft.AspNetCore.pdb: Cannot find or open the PDB file.
C:\Users\[REDACTED]\AppData\Local\Temp\SymbolCache\MicrosoftPublicSymbols\Microsoft.AspNetCore.pdb\8e776b6e10b14bcab493c987e0107684ffffffff\Microsoft.AspNetCore.pdb: Cannot find or open the PDB file.
C:\Users\[REDACTED]\AppData\Local\Temp\SymbolCache\Microsoft.AspNetCore.pdb\8e776b6e10b14bcab493c987e01076841\Microsoft.AspNetCore.pdb: Cannot find or open the PDB file.
C:\Users\[REDACTED]\AppData\Local\Temp\SymbolCache\MicrosoftPublicSymbols\Microsoft.AspNetCore.pdb\8e776b6e10b14bcab493c987e01076841\Microsoft.AspNetCore.pdb: Cannot find or open the PDB file.
C:\Users\[REDACTED]\Documents\Code\[REDACTED]\Microsoft.AspNetCore.pdb: Cannot find or open the PDB file.
SYMSRV:  BYINDEX: 0x2C7
         C:\Users\[REDACTED]\AppData\Local\Temp\SymbolCache*https://msdl.microsoft.com/download/symbols
         Microsoft.AspNetCore.pdb
         8E776B6E10B14BCAB493C987E0107684ffffffff
SYMSRV:  UNC: C:\Users\[REDACTED]\AppData\Local\Temp\SymbolCache\Microsoft.AspNetCore.pdb\8E776B6E10B14BCAB493C987E0107684ffffffff\Microsoft.AspNetCore.pdb - path not found
SYMSRV:  UNC: C:\Users\[REDACTED]\AppData\Local\Temp\SymbolCache\Microsoft.AspNetCore.pdb\8E776B6E10B14BCAB493C987E0107684ffffffff\Microsoft.AspNetCore.pd_ - path not found
SYMSRV:  UNC: C:\Users\[REDACTED]\AppData\Local\Temp\SymbolCache\Microsoft.AspNetCore.pdb\8E776B6E10B14BCAB493C987E0107684ffffffff\file.ptr - path not found
SYMSRV:  HTTPGET: /download/symbols/Microsoft.AspNetCore.pdb/8E776B6E10B14BCAB493C987E0107684ffffffff/Microsoft.AspNetCore.pdb
SYMSRV:  HttpQueryInfo: 80190194 - HTTP_STATUS_NOT_FOUND
SYMSRV:  HTTPGET: /download/symbols/Microsoft.AspNetCore.pdb/8E776B6E10B14BCAB493C987E0107684ffffffff/Microsoft.AspNetCore.pd_
SYMSRV:  HttpQueryInfo: 80190194 - HTTP_STATUS_NOT_FOUND
SYMSRV:  HTTPGET: /download/symbols/Microsoft.AspNetCore.pdb/8E776B6E10B14BCAB493C987E0107684ffffffff/file.ptr
SYMSRV:  HttpQueryInfo: 80190194 - HTTP_STATUS_NOT_FOUND
SYMSRV:  RESULT: 0x80190194
SYMSRV:  BYINDEX: 0x2C8
         C:\Users\[REDACTED]\AppData\Local\Temp\SymbolCache*https://msdl.microsoft.com/download/symbols
         Microsoft.AspNetCore.pdb
         8E776B6E10B14BCAB493C987E01076841
SYMSRV:  UNC: C:\Users\[REDACTED]\AppData\Local\Temp\SymbolCache\Microsoft.AspNetCore.pdb\8E776B6E10B14BCAB493C987E01076841\Microsoft.AspNetCore.pdb - path not found
SYMSRV:  UNC: C:\Users\[REDACTED]\AppData\Local\Temp\SymbolCache\Microsoft.AspNetCore.pdb\8E776B6E10B14BCAB493C987E01076841\Microsoft.AspNetCore.pd_ - path not found
SYMSRV:  UNC: C:\Users\[REDACTED]\AppData\Local\Temp\SymbolCache\Microsoft.AspNetCore.pdb\8E776B6E10B14BCAB493C987E01076841\file.ptr - path not found
SYMSRV:  HTTPGET: /download/symbols/Microsoft.AspNetCore.pdb/8E776B6E10B14BCAB493C987E01076841/Microsoft.AspNetCore.pdb
SYMSRV:  HttpQueryInfo: 80190194 - HTTP_STATUS_NOT_FOUND
SYMSRV:  HTTPGET: /download/symbols/Microsoft.AspNetCore.pdb/8E776B6E10B14BCAB493C987E01076841/Microsoft.AspNetCore.pd_
SYMSRV:  HttpQueryInfo: 80190194 - HTTP_STATUS_NOT_FOUND
SYMSRV:  HTTPGET: /download/symbols/Microsoft.AspNetCore.pdb/8E776B6E10B14BCAB493C987E01076841/file.ptr
SYMSRV:  HttpQueryInfo: 80190194 - HTTP_STATUS_NOT_FOUND
SYMSRV:  RESULT: 0x80190194
https://msdl.microsoft.com/download/symbols: Symbols not found on symbol server.
Further information:
- I'm using Visual Studio Community 2017 version 15.7.3.
- I'm debugging a
netcoreapp2.1application that is running locally (not in a container). - I'm using version 2.1.302 of the .NET Core SDK and version 2.1.2 of the .NET Core runtime.
If anyone knows what I'm doing wrong, that would be very helpful!
 youssefabidi
on 20 Jul 2018
youssefabidi
on 20 Jul 2018
@youssefabidi I was able to reproduce your issue about 1/2 hour ago. When trying to investigate it however the problem went away, and everything seems to work properly. This is what I get now (which looks correct)
C:\Program Files\dotnet\Microsoft.AspNetCore.Hosting.Abstractions.pdb: Cannot find or open the PDB file.
C:\Program Files\dotnet\shared\Microsoft.AspNetCore.App\2.1.2\Microsoft.AspNetCore.Hosting.Abstractions.pdb: Cannot find or open the PDB file.
C:\WINDOWS\Microsoft.AspNetCore.Hosting.Abstractions.pdb: Cannot find or open the PDB file.
C:\WINDOWS\symbols\dll\Microsoft.AspNetCore.Hosting.Abstractions.pdb: Cannot find or open the PDB file.
C:\WINDOWS\dll\Microsoft.AspNetCore.Hosting.Abstractions.pdb: Cannot find or open the PDB file.
C:\Users\Vancem\AppData\Local\Temp\SymbolCache\Microsoft.AspNetCore.Hosting.Abstractions.pdb\8a73a0e10c65481c827a7c925884d661ffffffff\Microsoft.AspNetCore.Hosting.Abstractions.pdb: Cannot find or open the PDB file.
C:\Users\Vancem\AppData\Local\Temp\SymbolCache\MicrosoftPublicSymbols\Microsoft.AspNetCore.Hosting.Abstractions.pdb\8a73a0e10c65481c827a7c925884d661ffffffff\Microsoft.AspNetCore.Hosting.Abstractions.pdb: Cannot find or open the PDB file.
C:\Users\Vancem\AppData\Local\Temp\SymbolCache\Microsoft.AspNetCore.Hosting.Abstractions.pdb\8a73a0e10c65481c827a7c925884d6611\Microsoft.AspNetCore.Hosting.Abstractions.pdb: Cannot find or open the PDB file.
C:\Users\Vancem\AppData\Local\Temp\SymbolCache\MicrosoftPublicSymbols\Microsoft.AspNetCore.Hosting.Abstractions.pdb\8a73a0e10c65481c827a7c925884d6611\Microsoft.AspNetCore.Hosting.Abstractions.pdb: Cannot find or open the PDB file.
SYMSRV:  BYINDEX: 0xB
         C:\Users\Vancem\AppData\Local\Temp\SymbolCache*https://msdl.microsoft.com/download/symbols
         Microsoft.AspNetCore.Hosting.Abstractions.pdb
         8A73A0E10C65481C827A7C925884D661ffffffff
SYMSRV:  UNC: C:\Users\Vancem\AppData\Local\Temp\SymbolCache\Microsoft.AspNetCore.Hosting.Abstractions.pdb\8A73A0E10C65481C827A7C925884D661ffffffff\Microsoft.AspNetCore.Hosting.Abstractions.pdb - path not found
SYMSRV:  UNC: C:\Users\Vancem\AppData\Local\Temp\SymbolCache\Microsoft.AspNetCore.Hosting.Abstractions.pdb\8A73A0E10C65481C827A7C925884D661ffffffff\Microsoft.AspNetCore.Hosting.Abstractions.pd_ - path not found
SYMSRV:  UNC: C:\Users\Vancem\AppData\Local\Temp\SymbolCache\Microsoft.AspNetCore.Hosting.Abstractions.pdb\8A73A0E10C65481C827A7C925884D661ffffffff\file.ptr - path not found
SYMSRV:  HTTPGET: /download/symbols/Microsoft.AspNetCore.Hosting.Abstractions.pdb/8A73A0E10C65481C827A7C925884D661ffffffff/Microsoft.AspNetCore.Hosting.Abstractions.pdb
SYMSRV:  HttpQueryInfo: 801900c8 - HTTP_STATUS_OK
SYMSRV:  Microsoft.AspNetCore.Hosting.Abstractions.pdb from https://msdl.microsoft.com/download/symbols: 2432 bytes
SYMSRV:  PATH: C:\Users\Vancem\AppData\Local\Temp\SymbolCache\Microsoft.AspNetCore.Hosting.Abstractions.pdb\8A73A0E10C65481C827A7C925884D661ffffffff\Microsoft.AspNetCore.Hosting.Abstractions.pdb
SYMSRV:  RESULT: 0x00000000
https://msdl.microsoft.com/download/symbols: Symbols downloaded from symbol server.
C:\Users\Vancem\AppData\Local\Temp\SymbolCache\Microsoft.AspNetCore.Hosting.Abstractions.pdb\8A73A0E10C65481C827A7C925884D661ffffffff\Microsoft.AspNetCore.Hosting.Abstractions.pdb: Symbols loaded.
I conclude from this that there was a intermittent failure with the msdl server but it has been fixed.
Please try it again.
vancem
on 20 Jul 2018
Yes, I confirm that it works now. The symbols are loaded and I can step into .NET Core and ASP.NET Core source code with no problem (most of it anyway, because of https://github.com/dotnet/buildtools/issues/1896).
I didn't think it was an intermittent issue because of the HTTP_STATUS_NOT_FOUND error. Anyway, I'm glad that the issue is fixed now: being able to step into framework source code is an extremely valuable feature!
Thanks a lot for your help, @vancem! And thanks to the team for their great work!
youssefabidi
on 21 Jul 2018
@youssefabidi : like you I was also led astray by the HTTP_STATUS_NOT_FOUND. Like you I assumed that the most common kind of intermittent error would be simply a timeout (the service is simply not responding). A HTTP_STATUS_NOT_FOUND implies that the service tried but failed to find something. I am assuming there was some service glitch with the service that a human probably found and fixed between the time we tried the first time and the second time. I was starting to guess this because symbols that HAD BEEN FOUND previously started to not be found. But before got further, it started to work.
vancem
on 23 Jul 2018
What's the status on Go To Definition that downloads the sources ? Where is that feature tracked?
Resharper has had for a decade. It's extremely useful to be able to peek inside a method you're calling to get a clarification on assumption. I feel like i'm flying blind without this.
 oliverjanik
on 29 Mar 2019
oliverjanik
on 29 Mar 2019
What's the status on Go To Definition that downloads the sources ? Where is that feature tracked?
@sharwell / @jinujoseph I believe you have an issue for that on https://github.com/dotnet/roslyn ?
 Pilchie
on 29 Mar 2019
Pilchie
on 29 Mar 2019
I found the issue: https://github.com/dotnet/roslyn/issues/24349 seems there's very little progress, unfortunately. At least the outlined steps are exactly what's needed.
oliverjanik
on 29 Mar 2019
@oliverjanik, yes thatz the right tracking bug, do you mind upvoting the issue (if you have not already)
Hopefully we will take a look at it soon.
 jinujoseph
on 29 Mar 2019
jinujoseph
on 29 Mar 2019
Does anyone have some kind of definitive way to debug source dot net code... this is getting somewhat stressful - every time I need to do this I have to end up downloading the entire source from git and just referencing the assembly directly.
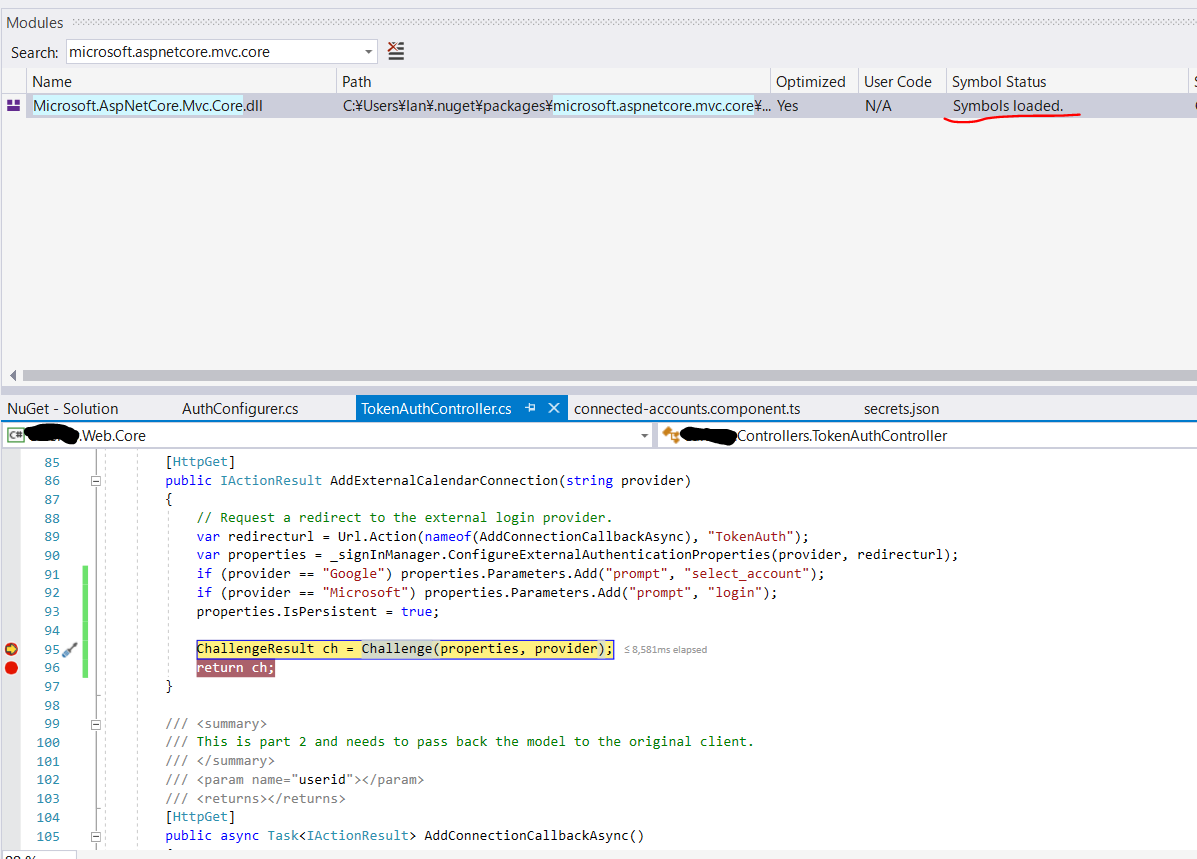
If the module window says "Symbols loaded", to me that means that any function I try to step into which is within that assembly, should work. Is this the case or not? Why is it so ambiguous?
Challenge is part of Mvc.Core, yet cannot be stepped into.
 worthy7
on 7 Jun 2019
worthy7
on 7 Jun 2019
If the module window says "Symbols loaded", to me that means that any function I try to step into which is within that assembly, should work. Is this the case or not?
It is not the case. A second condition is that to ensure step-in always works, the code shouldn't be optimized. You can see in the window that it says "Yes" in the 'Optimized' column which is likely what is causing the problem. There are a number of extra challenges when debugging optimized code such as the call may have been inlined or optimized away entirely and recreating the abstraction that you are stepping through the source line by line when the compiler has generated assembly that is radically different is a challenging problem. Many programing languages, including C#, make a best effort to debug optimized code but the abstraction is leaky to varying degrees.
Vance's blog post has a section about 'Disabling Framework Optimization' that is likely to be useful here. He mentions it in the context of resolving local variables, but it can also have an impact on accurate stepping.
Why is it so ambiguous?
Someone on the VS debugger team might be able speak better to the UI design here (@gregg-miskelly?) but underlying any UI the main technical requirements are going to be:
"have symbols" && "have source" && "code isn't optimized"
Its good feedback that the UI wasn't clear for you and you would appreciate if it didn't feel so ambiguous. Thanks for letting us know!
noahfalk
on 7 Jun 2019
One other useful note. As mentioned above, by default the code in the Framework is optimized, however you can force it to NOT be. First you have to run the program with the COMPLUS_ZapDisable=1 environment variable set. You can set this variable conveniently by
- Right clicking on the Project (csproj) file in SolutionExplorer -> Properties -> Debug
- Click the 'Add' button in the 'Environment Variables' section of the Debug Pane.
This will cause the code to NOT use the rregenerated (Zapped) code. Next tell Visual Studio to suppress optimization by
- Check the checkbox in Tools -> Options -> Debugging -> General -> Suppress JIT optimization on module Load
Once you do this for your project, you don't need to do it again (until you have another project in which you want to step through framework code.
Just tried to disable optimization following your recommendations in VS2019.
Cleaned the project and built it again, but no success.
...
int bucketNo, lockNo;

Tables tables = _tables;
GetBucketAndLockNo(hashcode, out bucketNo, out lockNo, tables._buckets.Length, tables._locks.Length);
..

 Legends
on 15 Oct 2019
Legends
on 15 Oct 2019
One other useful note. As mentioned above, by default the code in the Framework is optimized, however you can force it to NOT be. First you have to run the program with the COMPLUS_ZapDisable=1 environment variable set. You can set this variable conveniently by
- Right clicking on the Project (csproj) file in SolutionExplorer -> Properties -> Debug
- Click the 'Add' button in the 'Environment Variables' section of the Debug Pane.
This will cause the code to NOT use the rregenerated (Zapped) code. Next tell Visual Studio to suppress optimization by
- Check the checkbox in Tools -> Options -> Debugging -> General -> Suppress JIT optimization on module Load
Once you do this for your project, you don't need to do it again (until you have another project in which you want to step through framework code.
Just tried to disable
optimizationfollowing your recommendations in VS2019.
Cleaned the project and built it again, but no success.... int bucketNo, lockNo; Tables tables = _tables; GetBucketAndLockNo(hashcode, out bucketNo, out lockNo, tables._buckets.Length, tables._locks.Length); ..
Please refer to https://docs.microsoft.com/en-us/visualstudio/debugger/jit-optimization-and-debugging#limitations-of-the-suppress-jit-optimization-option
tl;dr you also need to add the environment variable COMPlus_ReadyToRun=0.
 IanKemp
on 9 Oct 2020
IanKemp
on 9 Oct 2020
Related issues
 lesomnus
·
3Comments
lesomnus
·
3Comments
 steevcoco
·
4Comments
steevcoco
·
4Comments
 rykr
·
3Comments
rykr
·
3Comments
 ffes
·
3Comments
ffes
·
3Comments
 leo2d
·
3Comments
leo2d
·
3Comments
Most helpful comment
Yes. These instructions are for windows (since we are talking about Visual Studio which only runs on windows. It is also important that we are talking about V2.0 (or later) .NET Core (e.g. what you get from https://www.microsoft.com/net/core#windowscmd)
These steps will allow Visual Studio to find the *.PDB files that are needed for the .NET Core and ASP.NET Core libraries. However you need more than just the *.PDB files you also need the source code itself. Going forward we intend for all our libraries to have 'SourceLink' information so that you can fetch the source directly from GitHub. When this is present, VS will simply fetch the source from GitHub and the experience is beautiful. I have tested this on Visual Studio 15.3 (the latest released version).
This 'it just works' experience (when you step into or set breakpoints on framework code VS should simply fetch the correct source code), should work for V2.0 ASP.NET DLLs (that is Microsoft.aspnet.dll). Sadly the CoreFX, and CoreClr dlls (Typically System. dlls), will not be fixed until the V2.01 release (In a few weeks) and thus you need to fetch source code yourself using the instructions below.
Getting source from GitHub
Ultimately you should not need to do this, all our DLLs will have SourceLink information and VS will simply fetch it from GitHub for you. However some of our libraries currently do not have SourceLink information. We will fix this but the experience in that case is VS will ask you where to fetch the file from. You can work around this by fetching the source code from GitHub yourself and pointing VS at it.
For example
lives in https://github.com/aspnet/Mvc
Once you know the repository, you can fetch the repository and set it to the 2.0.0 version of the source like this.
At this point you can answer the VS dialog prompting you for the source file path. Once you set it for one source file it will work for any other source file in the same directory structure.
You can also set up where VS searches without having to wait to be prompted by right clicking on the solution -> Properties -> Debug Source Files and then add your directory to the 'Directories Containing Source Code'. Once you set up these paths, VS should simply find your source code.
Finally there is an option in (Tools -> Options -> Debugging -> General -> Require Source Files to match Exactly) which is set by default. If you have problems getting VS to find your source, you can try unselecting that checkbox to see if your version is wrong and the source checksums don't match.
ASP.NET 2.0 SourceLink (VS fetches from GitHub directly) should be working
The V2.0 ASP.NET DLLs (aspnet.dll) have the needed SourceLink information, they should just work. the instructions above for fetching source code for these DLLs. Please comment below if this is not the case.
Note that we did UPDATE the ASP.NET PDBs so they have sourceLink, which means that if you tried to step into ASP.NET dlls before, you may have already cached an old version of the PDBs and if so, Visual Studio will not try to refetch it. You can force the refetch by exiting Visual Studio deleting the %TEMP%\SymbolCache directory and then retrying. In addition once Visual Studio has attempted to fetch a particular source file it will not attempt doing it again. You can clear that history by right clicking on the solution -> Properties -> Debug Source Files and removing all names from the 'Do not look for these source files' textbox.